

Image source: Pixabay
Industrial production continues to rise, while February monthly GDP erased January’s decline.
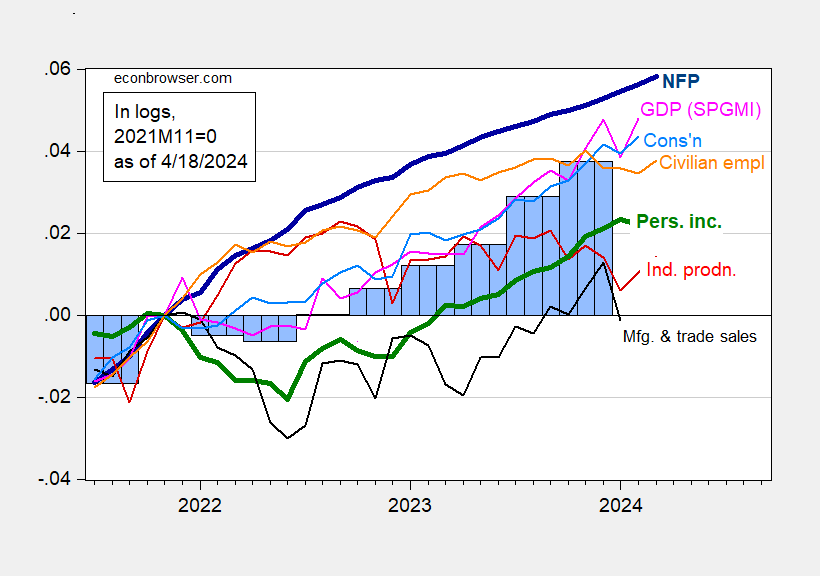
Figure 1: Nonfarm Payroll employment from CES (bold blue), civilian employment (orange), industrial production (red), personal income excluding current transfers in Ch.2017$ (bold green), manufacturing and trade sales in Ch.2017$ (black), consumption in Ch.2017$ (light blue), and monthly GDP in Ch.2017$ (pink), GDP, 3rd release (blue bars), all log normalized to 2021M11=0. Source: BLS via FRED, Federal Reserve, BEA 2023Q4 3rd release, S&P Global Market Insights (nee Macroeconomic Advisers, IHS Markit) (4/1/2024 release), and author’s calculations.
Note that GDPNow as of 4/16 is 2.9% q/q AR, while the Lewis-Mertens-Stock/NY Fed Weekly Economic Indicator stands at 2.01% for the week ending 4/13. The Baumiester, Leiva-Leon, Sims Weekly Economic Conditions Index (WECI) is at -0.39%, which — if trend growth is 2% — implies 1.61% growth.
More By This Author:
US-China GDP Growth Since 1981Different Measures Of Consumer Prices
NIIP And Primary Income: Dark Matter +20 Vs. Exorbitant Privilege +40


Comments
Log in or sign up to join the conversation.