

Image Source: Pexels
Since 2021M01, the CPI has risen 17.3% (log terms). By comparison, chained CPI and HICP have risen by approximately 16.5%. The PCE deflator has risen only 14.4% by March 2024 – but these are prices of goods and services produced, not of prices faced by consumers.
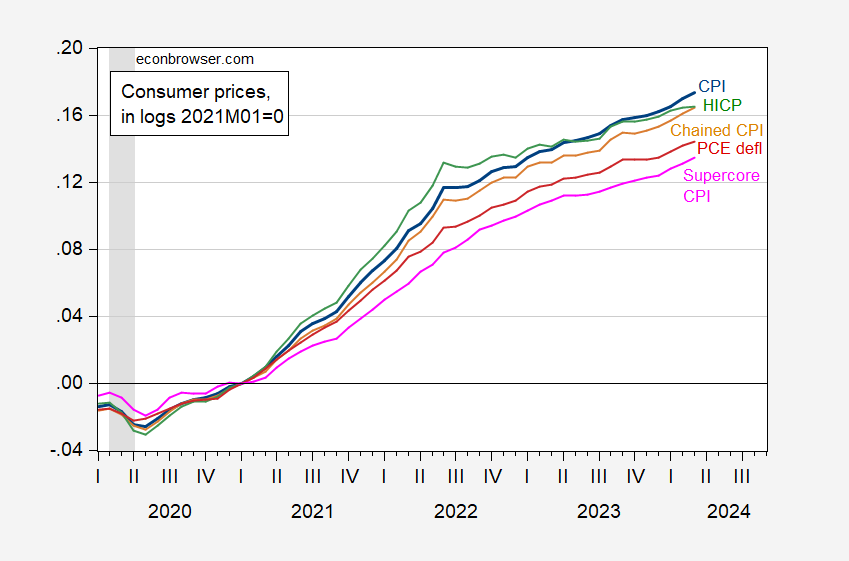
Figure 1: CPI (blue), HICP (green), chained CPI (tan), PCE deflator (red), supercore CPI (pink), all in logs 2021M01=0. HICP and chained CPI seasonally adjusted by author using Census X-13/X-11. NBER defined peak-to-trough recession dates shaded gray. Source: BLS, Eurostat, BEA via FRED, BLS, NBER, and author’s calculations.
More By This Author:
NIIP And Primary Income: Dark Matter +20 Vs. Exorbitant Privilege +40The IMF View On U.S. GDP Growth
GDP Forecasts Brighten Yet Further


Comments
Log in or sign up to join the conversation.