

Image Source: Unsplash
Plus 3rd release of 2023Q3 GDP.
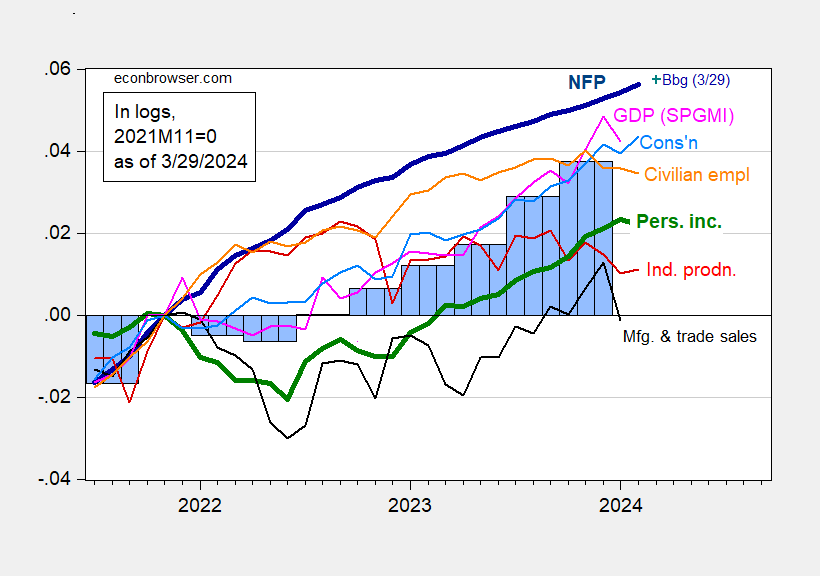
Figure 1: Nonfarm Payroll employment from CES (bold blue), from Philadelphia Fed early benchmark (teal), civilian employment (orange), industrial production (red), personal income excluding current transfers in Ch.2017$ (bold green), manufacturing and trade sales in Ch.2017$ (black), consumption in Ch.2017$ (light blue), and monthly GDP in Ch.2017$ (pink), GDP, 3rd release (blue bars), all log normalized to 2021M11=0. Source: BLS via FRED, Federal Reserve, BEA 2023Q4 2nd release, S&P Global Market Insights (nee Macroeconomic Advisers, IHS Markit) (3/1/2024 release), and author’s calculations.
Consumption showed strength exceeding consensus, while personal income ex-transfers fell. January manufacturing and trade sales fell substantially in January. Combined with lackluster industrial production for February, one could see a slowdown in growth.
That being said, the upward revision in Q4 GDP, along with measures of aggregate demand (final sales, and final sales to private domestic purchasers) suggests a lot of momentum in economic activity.
More By This Author:
Measuring Fed Inflation Credibility
Conference Board Revises 2024 Outlook Up
Are You Better Off Than You Were 4 Years Ago


Comments
Log in or sign up to join the conversation.