

Image Source: Pexels
Per capita GDP relative to 1st quarter of new administration:
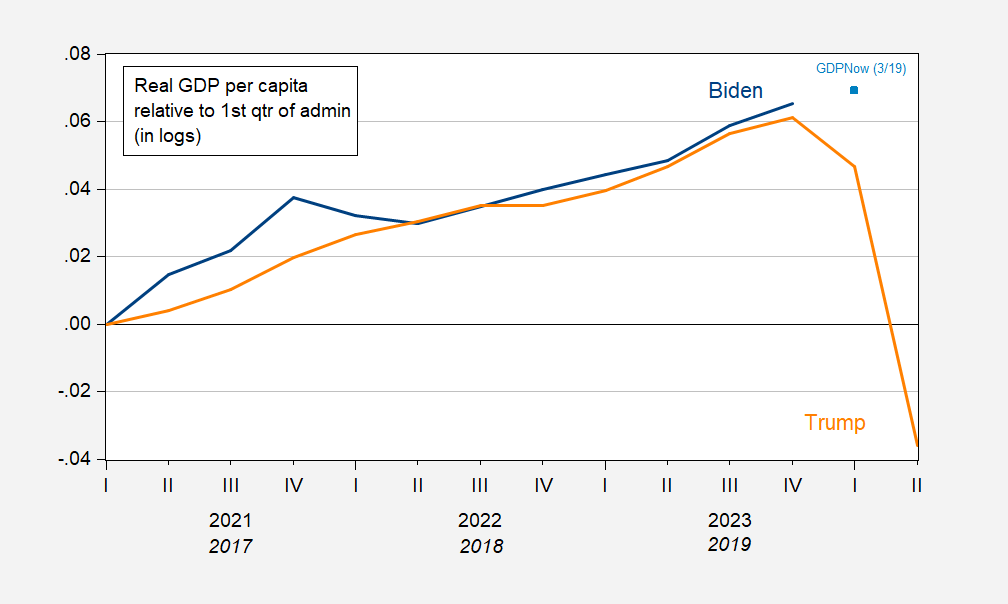
Figure 1: GDP relative to 2021Q1 (blue), and GDP four years ago relative to 2017Q1 (orange), in logs. 2024Q1 value is GDPNow implied level based on 3/19 release and GDP estimate as of 3/21. Source: BEA 2023Q4 2nd release, Atlanta Fed, and author’s calculations.
The cumulative growth is similar, although if nowcasts and forecasts hold up, they’ll soon diverge.
And in terms of growth rates, they’re pretty closely matched.
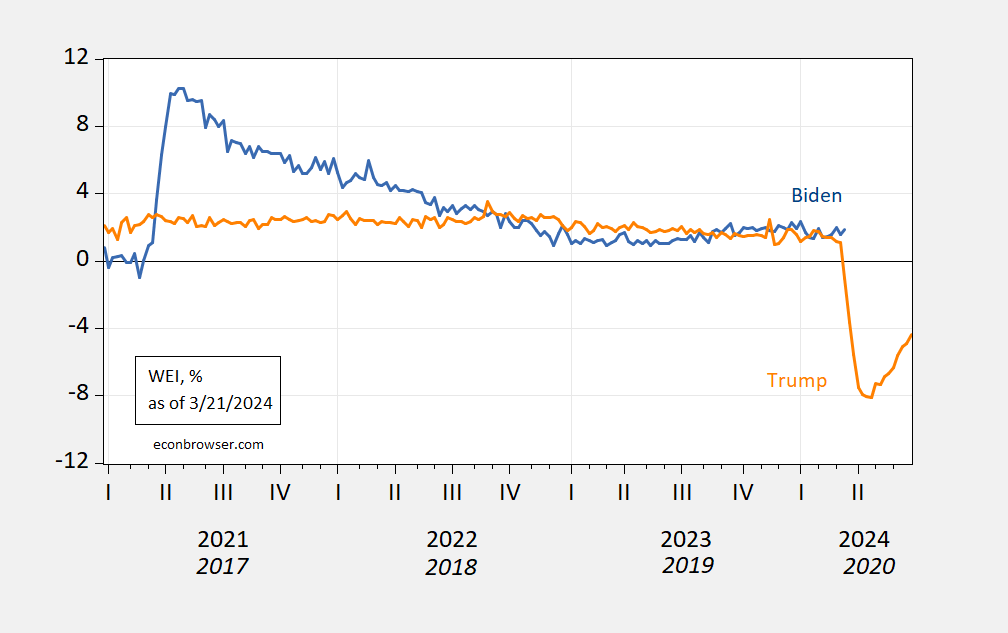
Figure 2: Lewis-Mertens-Stock Weekly Economic Index (blue), and lagged 208 weeks (orange), both in %. Source: NY Fed via FRED.
More By This Author:
FOMC March SEP On GDPIs The Fed Looking At FAIT? If So, What Would It Imply?
Immigration 2021-23: Supply And Demand Shock


Comments
Log in or sign up to join the conversation.