

Image Source: Pixabay
2024 q4/q4 growth at 2.1% matches FT-IGM survey discussed in previous post.
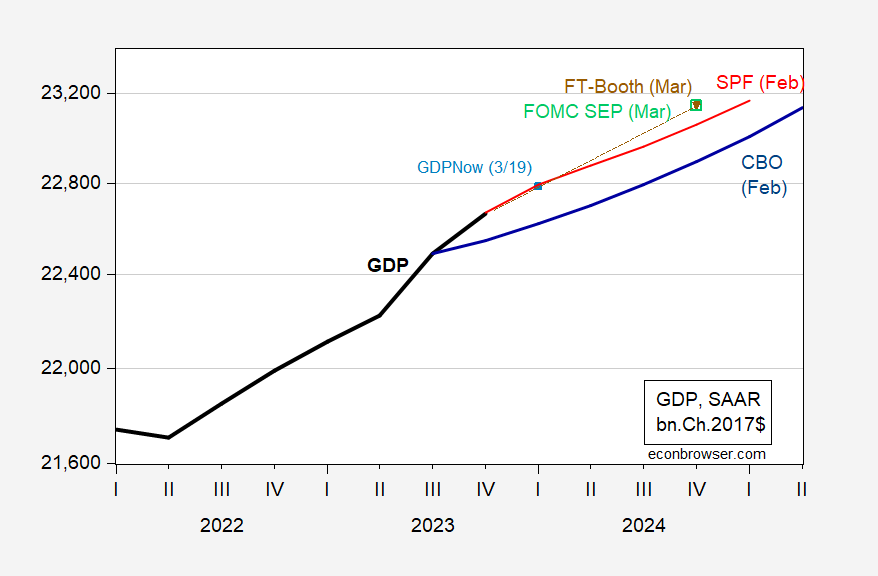
Figure 1: GDP (bold black), CBO projection (blue), Survey of Professional Forecasters (red), FT-Booth median forecast (brown inverted triangle), FOMC Summary of Economic Projections March 20 (open light green square), GDPNow of 3/19 (light blue square), all in bn.Ch.2017$. Source: BEA 2024Q4 2nd release, CBO Budget and Economic Outlook (February), Philadelphia Fed SPF, Booth School, Federal Reserve Board, Atlanta Fed (3/19), and author’s calculations.
More By This Author:
Is The Fed Looking At FAIT? If So, What Would It Imply?Immigration 2021-23: Supply And Demand Shock
March FT-Booth Macroeconomists Survey: GDP, Recession, R*


Comments
Log in or sign up to join the conversation.