
Looking At The Future Through CoT This Week
Following futures positions of non-commercials are as of September 14, 2021.
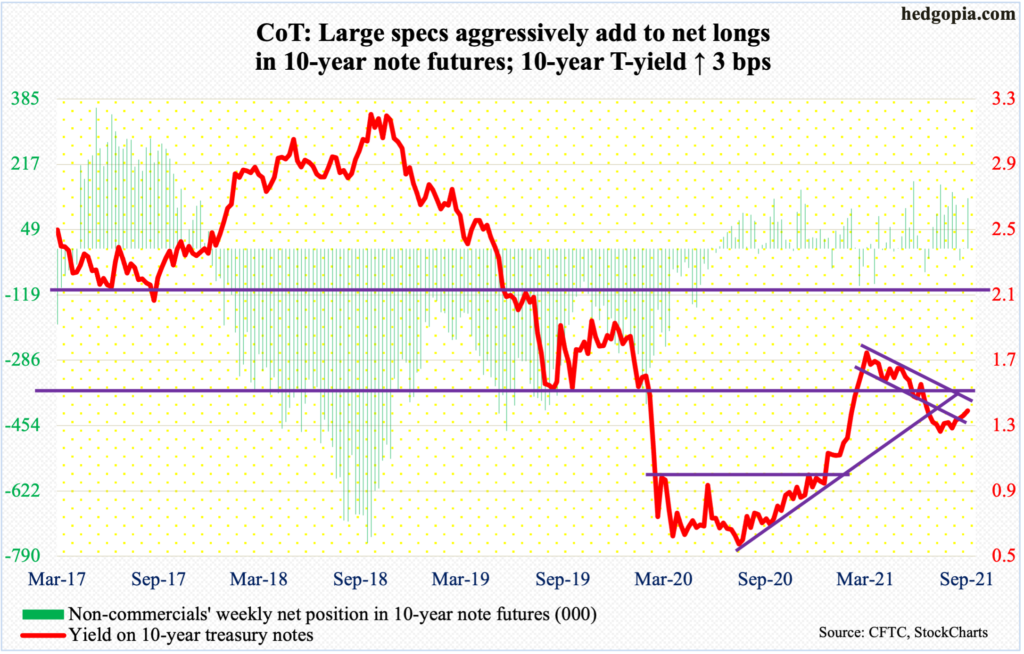
10-year note: Currently net long 129.4k, up 128.6k.
The FOMC meets next week. This will be the 6th scheduled meeting this year, and two more remain – one in November and the other in December.
Next week’s meeting will accompany a summary of economic projections. It will be interesting how they view the US economy, jobs and inflation are progressing and where they think they are headed. Even more interesting is what they will say about tapering. At the Jackson Hole symposium late last month, Chair Jerome Powell indicated that the central bank would begin to taper its bond purchases toward the end of the year.
Currently, the Fed buys up to $80 billion in treasury notes and bonds and $40 billion in mortgage-backed securities every month. It is sitting on $8.45 trillion in assets, twice what it held in early March last year. That is a lot of stimulus sloshing around in the system.
After Powell made those comments, August’s jobs report came in much weaker than expected; consumer inflation, too, rose less than expected last month. If FOMC doves are looking for a reason to delay tapering, the recent softness in data has given them one.
As things stand, the 10-year T-yield (1.37 percent) does not seem bothered by prospects of tapering. It continues to struggle to break through low-1.40s. In fact, rates have faced stiff resistance at high-1.30s since August 12, including Friday. Maybe the long end of the yield curve is focused more on how foreigners have been warming up to treasury notes and bonds in recent months (more on this here).
Non-commercials this week aggressively added to net longs in 10-year note futures.
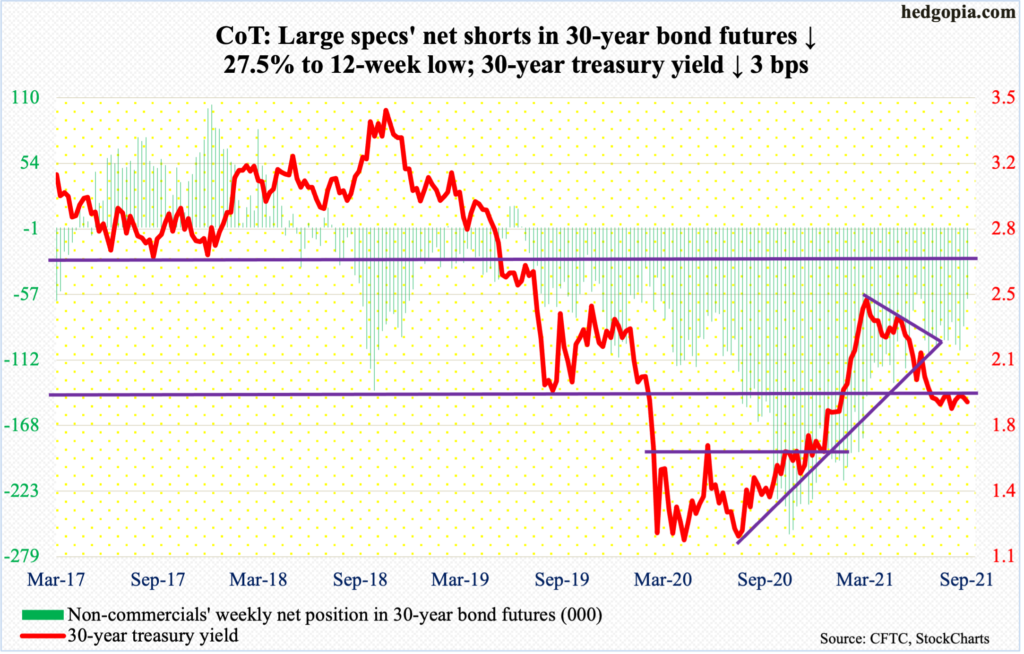
30-year bond: Currently net short 60.6k, down 23k.
Major economic releases for next week are as follows.
The NAHB Housing Market Index (September) comes out on Monday. Homebuilder sentiment dropped five points month-over-month in August to 75 – a 13-month low. The index peaked at 90 last November, tripling since hitting a post-pandemic low of 30 in April last year.
Housing starts (August) are due out on Tuesday. July starts declined seven percent m/m to a seasonally adjusted annual rate of 1.53 million units – a three-month low.
Wednesday brings existing home sales (August). Sales increased two percent m/m in July to 5.99 million units (SAAR) – a four-month high.
New home sales (August) will be published on Friday. July sales were up one percent m/m to 708,000 units (SAAR). In January, sales reached 14-year high 993,000 units.
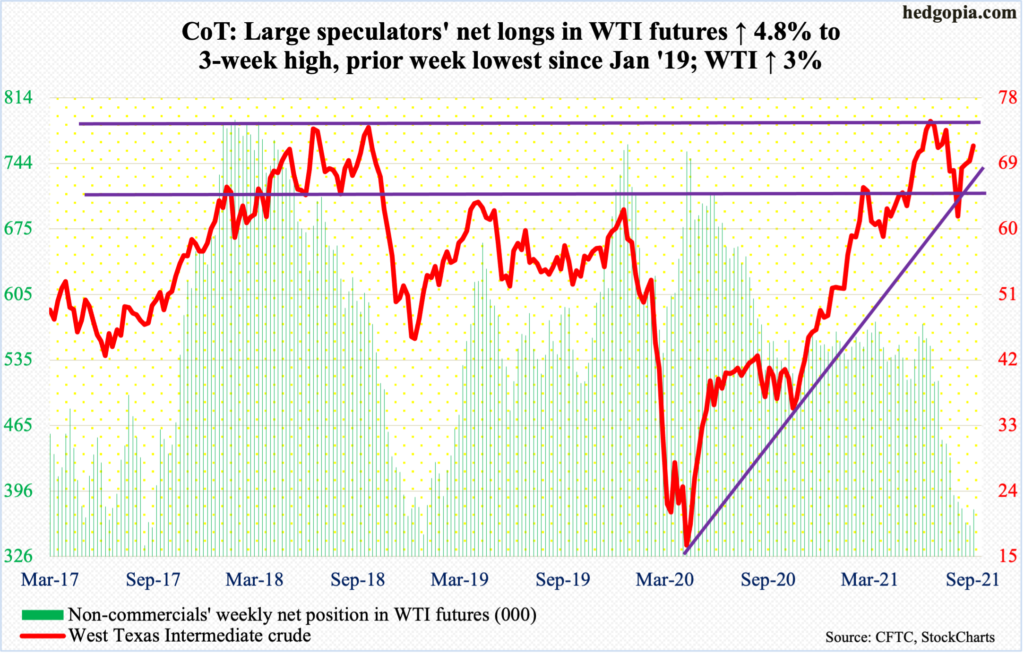
WTI crude oil: Currently net long 376.1k, up 17.1k.
Thanks to disruptions caused by Hurricane Ida, US stocks of crude, gasoline and distillates continued to drop in the week to September 10 – respectively down 6.4 million barrels, 1.9 million barrels and 1.7 million barrels to 417.4 million barrels, 218.1 million barrels and 131.9 million barrels. The EIA report also showed crude imports dropped 49,000 barrels per day to 5.8 million b/d. After dropping 1.5 mb/d in the prior week, crude production rose 100,000 b/d to 10.1 mb/d. Similarly, after falling 9.4 percentage points in the prior week, refinery utilization inched up two-tenths of a percentage point to 82.1 percent.
Oil bulls began the week by rallying West Texas Intermediate crude ($71.82/barrel) past the 50-day ($69.64) as well as trend-line resistance on Monday. The latter goes back to July 6 when the crude posted $76.98 intraday before retreating. In October 2018, WTI reversed sharply lower after ticking $76.90. So, this level has a lot of memory attached to it. Given the current dynamics, it is hard to imagine this ceiling cracking. Nevertheless, should it break, it will be a major achievement for the bulls.
Near term, the daily is extended.
E-mini S&P 500: Currently net short 35.8k, up 7.5k.
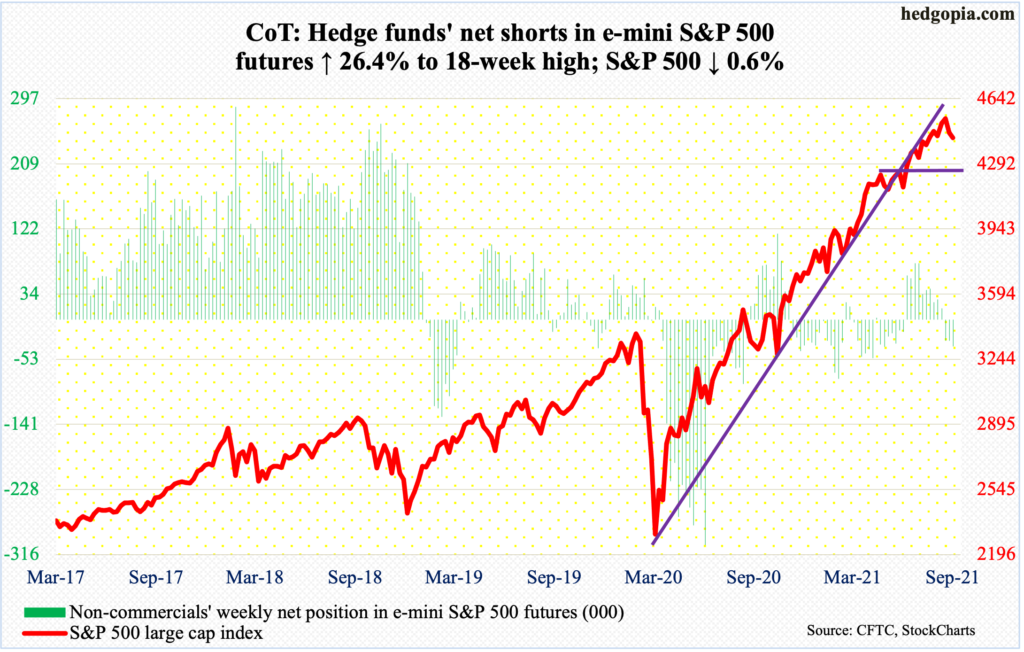
The S&P 500 remained sandwiched between its 20- and 50-day moving averages in the first four sessions before breaching the latter on Friday, albeit ever so slightly – with the index closing at 4433 and the 50-day at 4436.
As of Wednesday, longs did not seem worried the large cap index was headed for a breach of the 50-day. In the week to Wednesday, US-based equity funds took in $5.9 billion (courtesy of Lipper). In the same week, SPY (SPDR S&P 500 ETF), VOO (Vanguard S&P 500 ETF) and IVV (iShares Core S&P 500 ETF) gained $3.9 billion (courtesy of ETF.com).
These investors are probably hoping history repeats itself. From May last year, the 50-day has been defended 10 times, with the latest having taken place on August 19 (more on this here). The difference this time is that it has failed to bounce off the average right away. This is taking place at a time when the weekly and monthly are grossly overbought. A decisive breach of the average will swing near-term momentum in bears’ favor.
Nearest support lies at 4360s.
Euro: Currently net long 27.8k, up 1.5k.
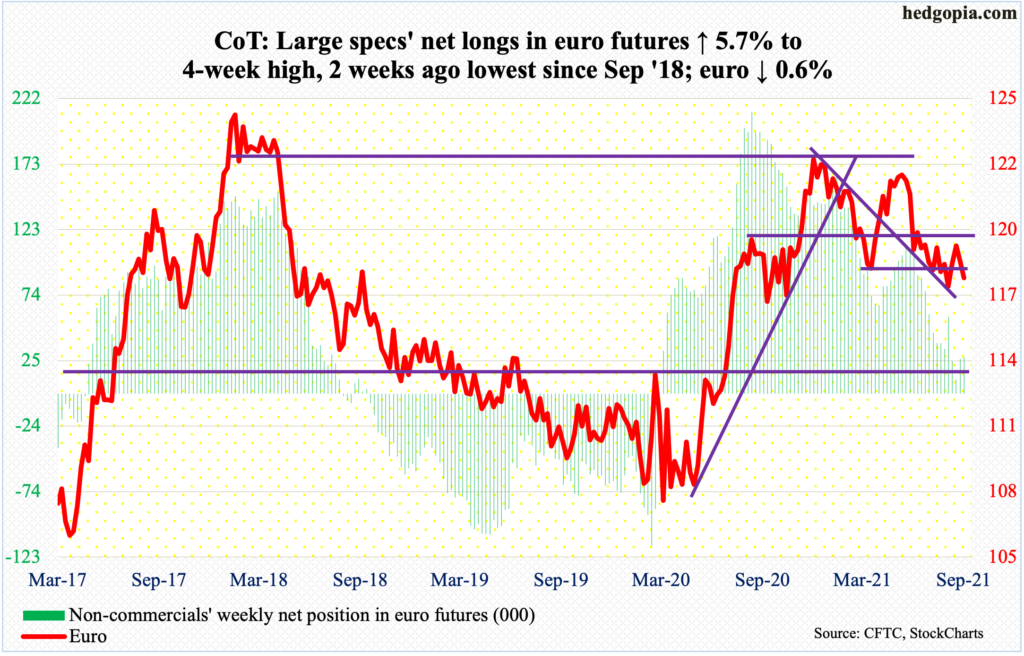
On Tuesday, the euro ($1.1729) broke past horizontal resistance at $1.18 ticking $1.1846 intraday but only to give it back to close at $1.1808. By Friday, it tagged $1.1751 intraday, having lost the 50-day in the prior session.
There is straight-line support just north of $1.17, with the daily lower Bollinger band at $1.1707. It will be an important test.
Gold: Currently net long 207.8k, up 1.7k.
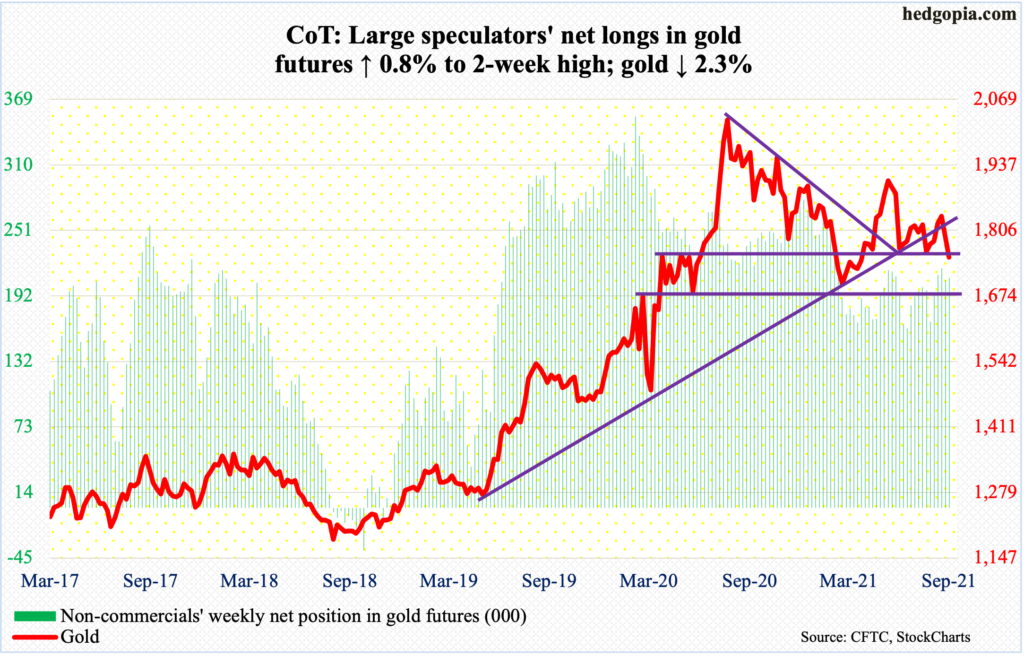
Gold bugs are at risk of losing crucial support at $1,760s-$1,770s. In fact, it has already been breached, but not decisively. It closed Friday at $1,751/ounce, with a tag of $1,746 on Thursday.
The metal struggled at the 50- and 200-day (respectively $1,797 and $1,809) for several weeks. It was also repeatedly rejected at straight-line resistance at $1,830s. Bulls have their work cut out. If bids do not show up soon, next decent support is not until $1,670s, which was defended in early August.
Nasdaq 100 index (mini): Currently net long 9.6k, up 4.6k.
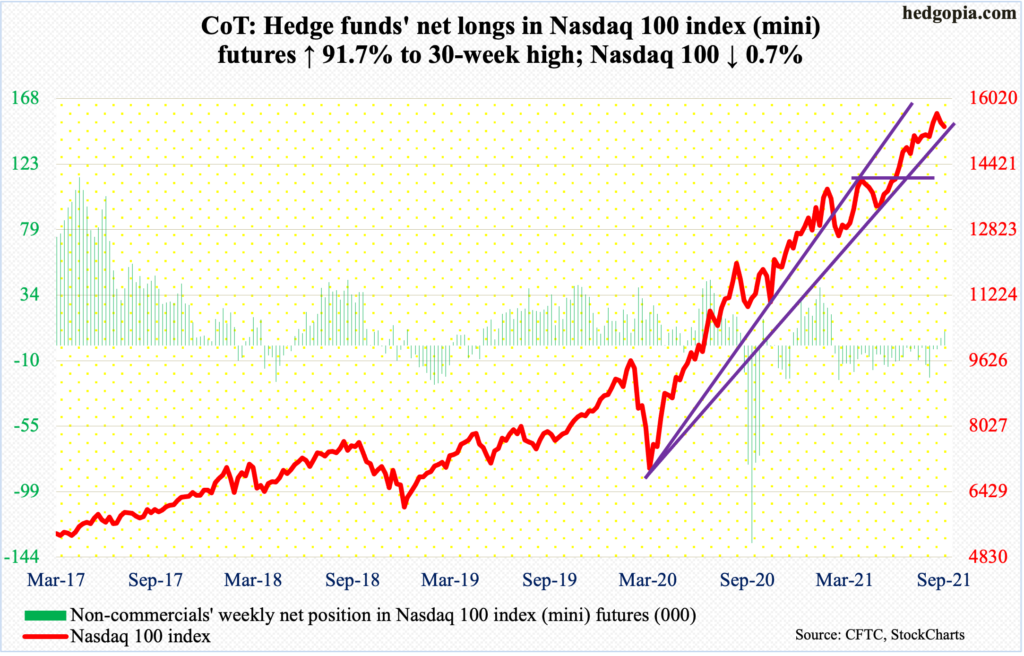
Tech bulls refused to give away the 20-day in the first four sessions but were unable to save it on Friday as selling intensified.
The Nasdaq 100 (15333) is only 1.1 percent from the 50-day, which also approximates horizontal support at 15100s. A test looks imminent next week.
This week’s 0.7-percent decline follows inability to push through 15700 for several sessions, including last week. Bears need to break 15100s to gain the upper hand.
Russell 2000 mini-index: Currently net short 63k, up 6.5k.
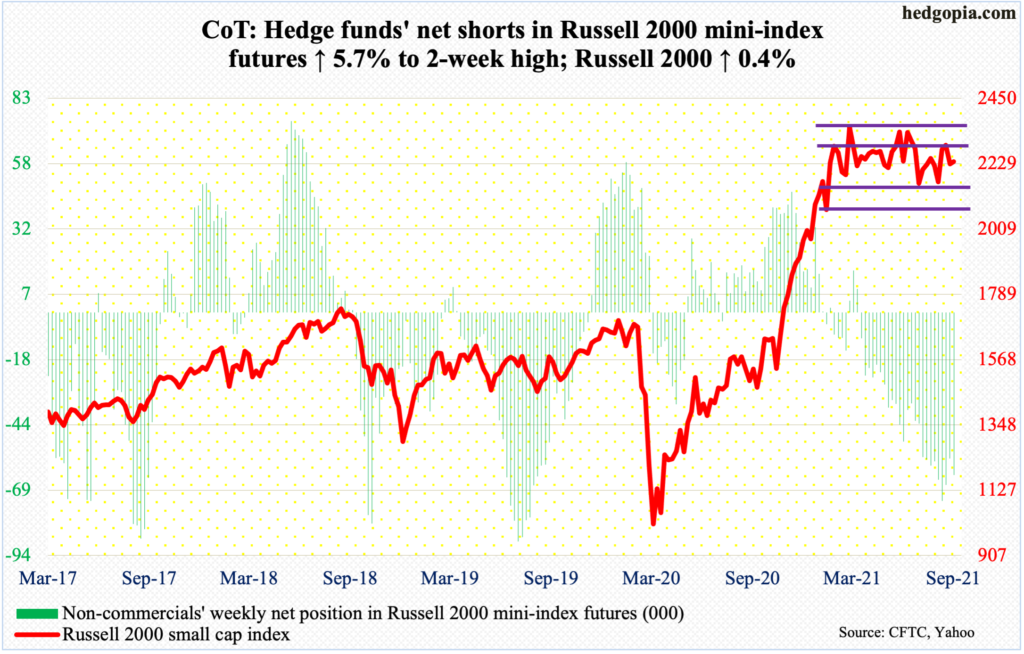
The Russell 2000 continued to trade around its 50-day (2226), which has been flattish the past six months. The average began to go sideways just as the small cap index retreated after posting a new all-time high of 2360 on March 15. This preceded a one-year, 144-percent surge.
Bulls hope the six-month rangebound action resolves to the upside. The index (2237) has bounced up and down within 2350s and 2080s. Within this rectangle lies another range between 2280s and 2150s.
Last week, there was a false breakout at 2280s. This week, rally attempts got stopped at 2250s. So, the back-and-forth action continues.
Amidst this, non-commercials have positioned themselves for a range breakdown. They probably were not too excited by how the cash traded this week. The Russell 2000 bucked the trend this week, rising 0.4 percent. The daily is itching to rally.
US Dollar Index: Currently net long 24.3k, up 2.8k.
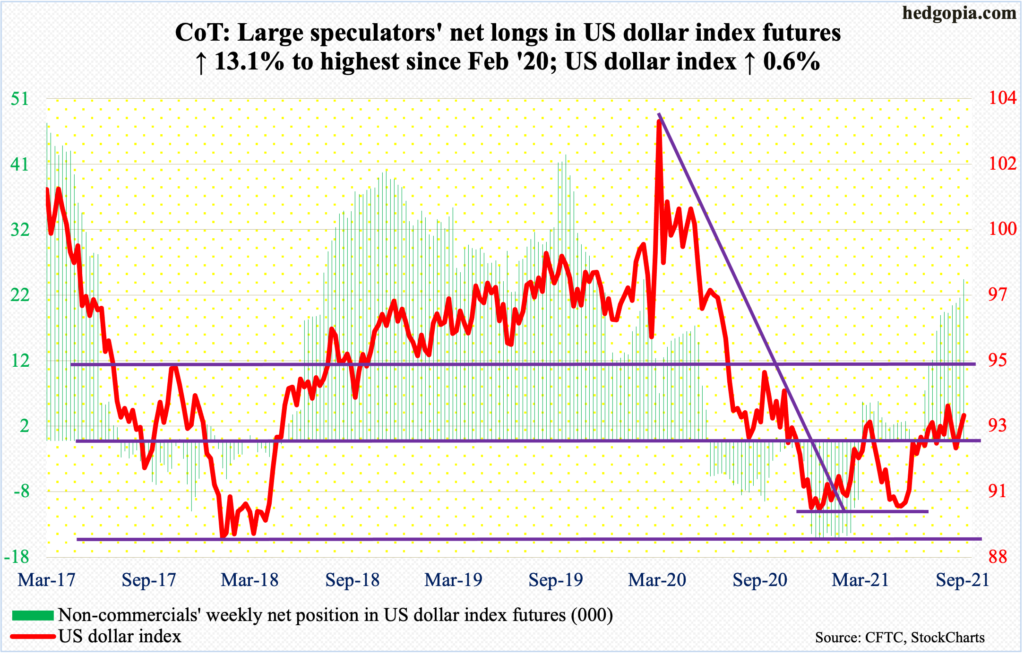
The US dollar index (93.18) straddled its 50-day in the first three sessions before it reclaimed the average on Thursday rallying 0.4 percent and then another 0.3 percent on Friday.
On the daily, a potentially bullish MACD crossover just took place; this setup developed on the monthly as well.
For the week, the index rallied 0.6 percent. This followed Tuesday’s defense of support just north of 92, which goes back to June 2003. So long as this support holds, dollar bulls deserve the benefit of the doubt.
A takeout of August 20 high of 93.75 will have established a pattern of higher highs and higher lows.
VIX: Currently net short 83.7k, down 6.4k.
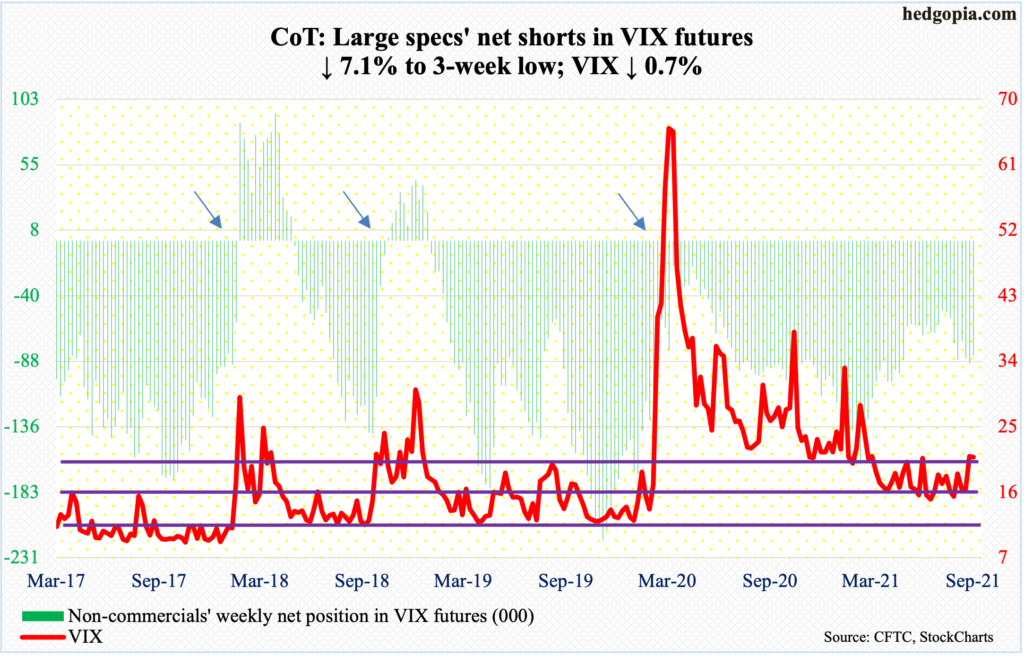
In the first four sessions, volatility bulls had difficulty saving last Friday’s 20.95 close above the 200-day. On Monday-Thursday, VIX (21.18) kept closing under the average but at the same time the 50-day at 17.86 was defended. Come Friday, the 200-day (19.98) was reclaimed, with a session high of 21.51.
Of note, VIX lost 0.7 percent for the week, as did the S&P 500. This is rare. Ordinarily, the two prefer to go the opposite ways. Despite this, the daily seems to want to rally further. In this scenario, the next resistance lies at 25.
Disclaimer: This article is not intended to be, nor shall it be construed as investment advice. Neither the information nor any opinion expressed here constitutes an offer to buy or sell any ...
more

