
In our Daily Commentary from October 9th, we alerted readers to the fact that the Fed’s Overnight Repurchase Program was warning that the financial system was running out of a reliable store of excess liquidity. While not a concern, as we share in our quote below, it was worth monitoring.
Said differently, after years of having a sizeable store of liquidity, the financial system now lacks excess liquidity. This doesn’t mean a liquidity crisis is imminent. It simply means the financial system has returned to its pre-pandemic liquidity status. However, if liquidity demands increase, there is no liquidity in the proverbial bank as we have grown accustomed to. Thus, in the future, the Fed will likely be much quicker to act on a liquidity run today than it was when the ON RRP program had large balances.
On October 16th, our Commentary told of Powell’s rather unexpected announcement that QT might be ending soon. QT removes liquidity from the financial system; thus, his abrupt comments led us to believe that he must be warning the public that liquidity is tightening.
The two Commentaries lead us to the chart below. The graph compares the difference between the Secured Overnight Financing Rate (SOFR) and the Fed’s Overnight Reverse Repurchase Rate (ON RRP) rates in blue versus the amount of dollars in the ON RRP facility – orange. The orange line indicates that there is no more excess liquidity; thus, as the blue line indicates, overnight borrowers, even with perfect collateral, are now paying an increasing premium for liquidity. In other words, the demand for liquidity is outstripping the supply.
If the SOFR rate continues to climb, the Fed will likely act via a special liquidity program, QE, and/or a lower Fed Funds rate to provide liquidity. It doesn’t want a replay of 2019, when they were late to heed the warning signs and recognize liquidity shortfalls. Given that all asset markets are being juiced by liquidity, these warning signs should be followed closely by all investors.

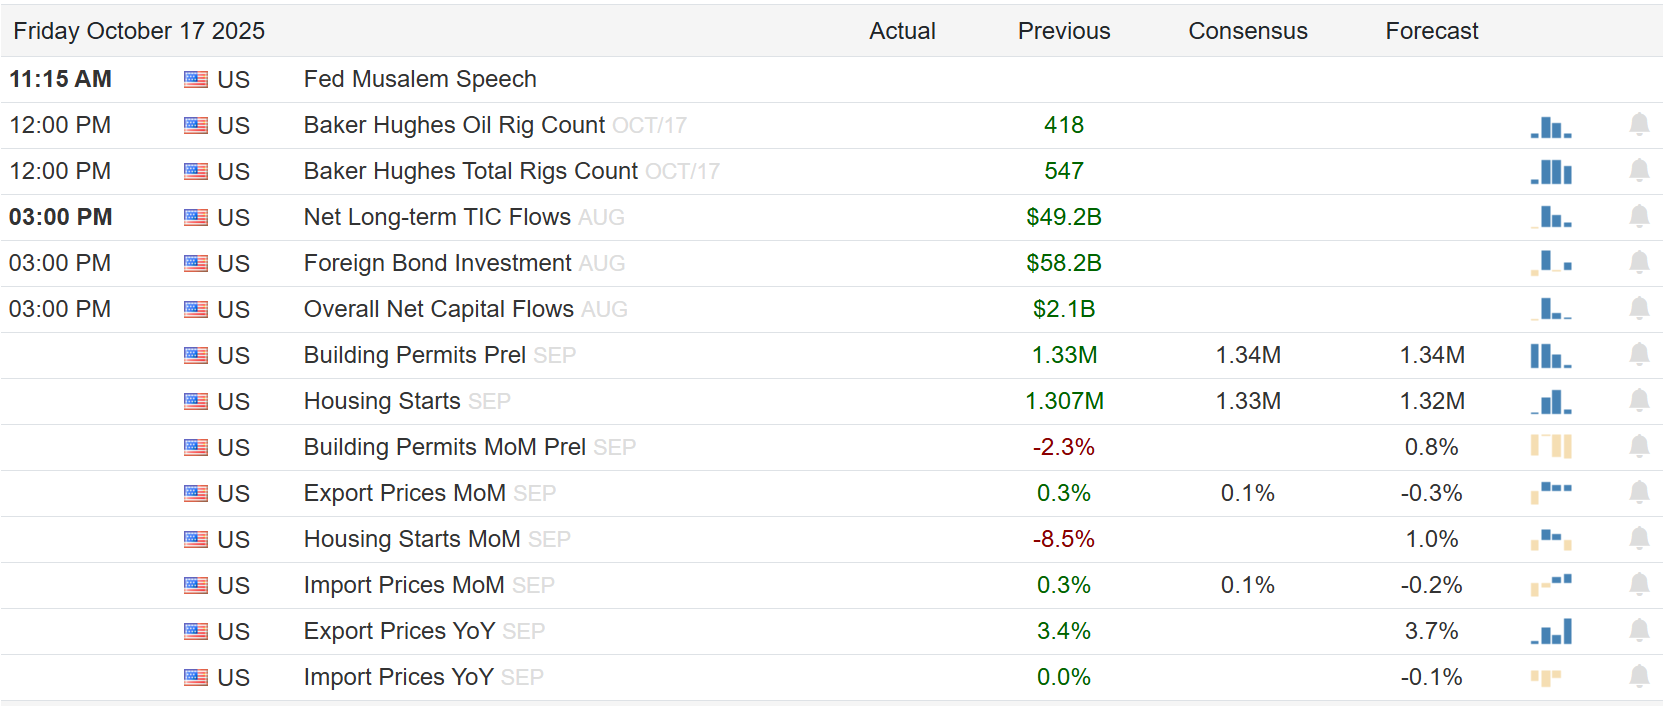
What To Watch Today
Earnings

Economy
Market Trading Update
Yesterday, we discussed how the market reclaimed the 20-DMA, keeping the bullish trend intact after a successful test of the 50-DMA. Retail investors continue to “buy dips,” and there seems to be no end in sight. Of course, that is precisely the setup that eventually leads to the end. However, that end is not today.
However, the one chart we look closely at is the long-term chart of interest rates. Interest rates have been topping since the beginning of last year and have recently broken below the wedge pattern that has been building. This has two important implications.
First, when rates start dropping after a long-term rise, the stock market did not perform well. The reason is that lower rates are a function of slower economic growth and lower inflation, which are net negatives to corporate earnings. Given the elevated expectations for earnings, the risk is more than present.
Secondly, a break lower in rates, somewhere in the upper “3’s,” and the historically large short position against bonds will have to cover, driving rates lower. With the Federal Reserve now discussing stopping QT, which will add a buyer to the bond market, hedge funds that are short bonds are starting to run into mounting headwinds.
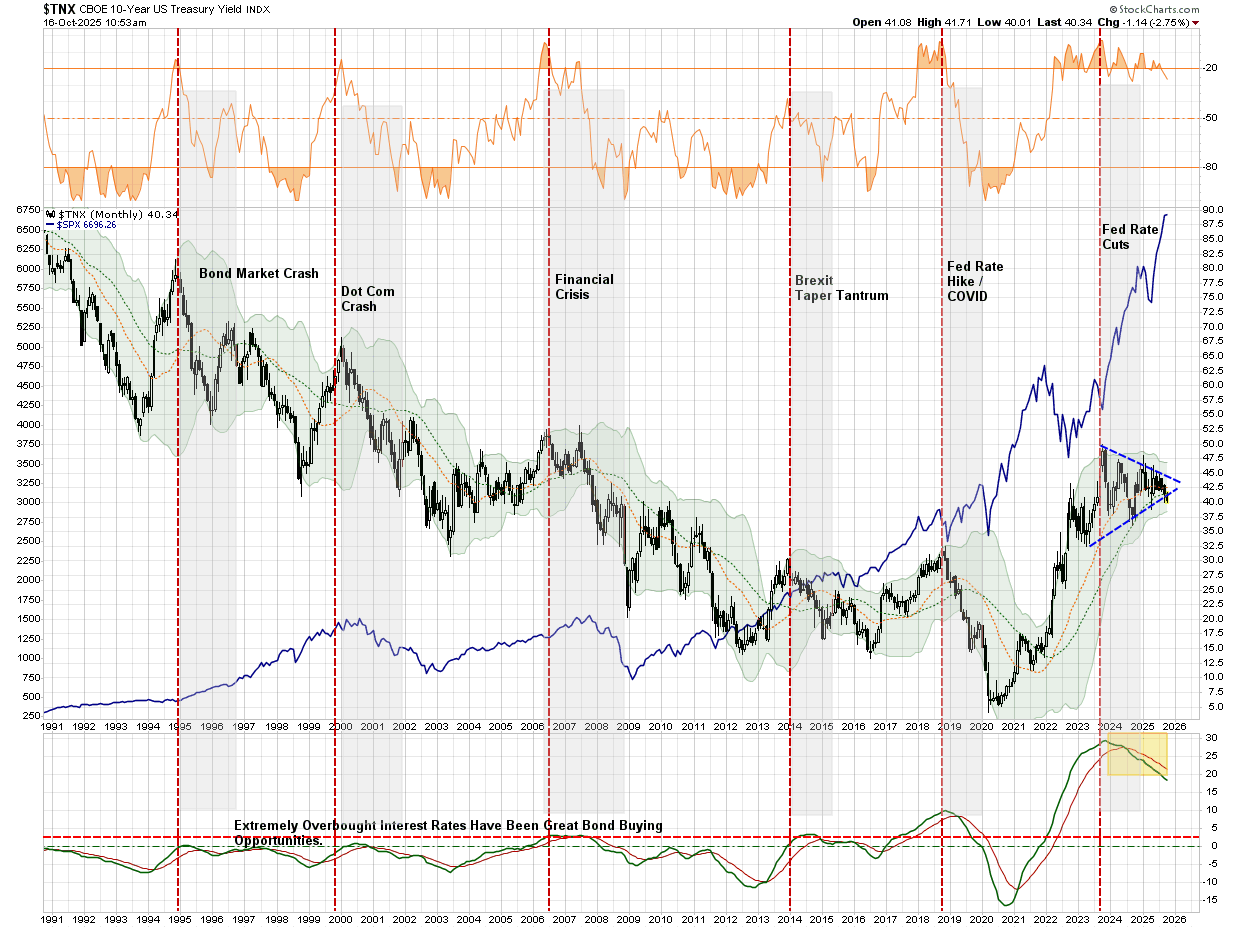
As we have noted previously, our portfolios are mostly long short-duration bonds, which are playing off the Fed rate cuts for now. However, if the technicals continue to develop, a shift in duration on our bond barbell will become much more compelling.
Is Ben Graham Bearish?
Ben Graham is best known as the father of value investing. His books, Security Analysis and The Intelligent Investor, are considered an investment bible for many fundamental-based stock analysts. For those of you who know of him, you also likely know he died almost fifty years ago; thus, our title may be a bit confusing. Obviously, Ben Graham is neither bearish nor bullish. However, we can use AI to help us decipher how he would view stocks given his investment approach.
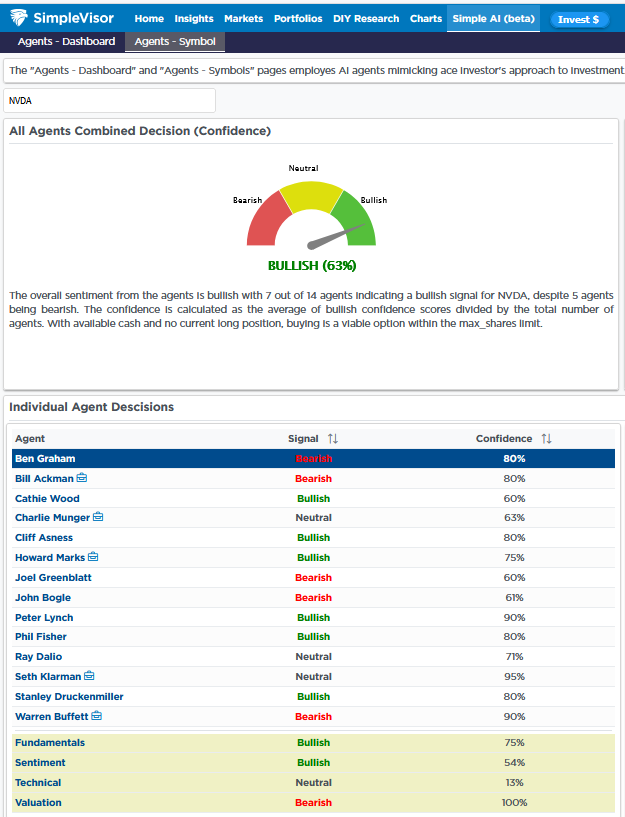
The AI Agents Dashboard in SimpleVisor assesses 14 well-known investors and analysts to gauge how they might view a stock. The page below shows that our Ben Graham AI agent is only bullish on ten of the S&P 500 stocks. Moreover, it’s neutral on 22 and outright bearish on the remaining 472. If we click on the “10” under Bullish, we can see which stocks comprise his bullish selection. Furthermore, we provide a confidence level that assesses how well the investment decision aligns with his investment ideals. We share these in the second graphic below.
If you are wondering how the other 13 agents might view a stock, we provide a decision composite by ticker. The third graphic shows that our AI agents are mixed on Nvidia, with five bearish, three neutral, and six bullish. Beneath the agents, highlighted in yellow, we also created four agents based on fundamentals, sentiment, technical analysis, and valuations.


Tweet of the Day

More By This Author:
The Psychology Of Investing In A Zero-Risk IllusionIs QT On Its Last Lap?
Dollar Correlation: Implications For Foreign Stock Indexes


Comments
Log in or sign up to join the conversation.