
The graph below, courtesy of the St. Louis Fed, charts the amount of money in the Fed’s overnight reverse repurchase agreement (ON RRP) facility. To understand why the current lack of a meaningful balance in the program could become concerning, let’s revisit the Fed’s response to the Pandemic. During the pandemic and global economic shutdown, the Fed flooded the financial system with abundant liquidity. Accordingly, the Fed needed to absorb the excess liquidity; otherwise, its Fed Funds rate and other money market rates would have fallen well below zero percent. The competitive investment rates on the ON RRP facility incentivized banks and government agencies (FHLB, FNMA, FMAC) to invest their excess liquidity in the Fed’s ON RRP. The facility provided a home for the excess liquidity and maintained overnight rates at the Fed’s target.
A further benefit to the ON RRP facility was that it gave investors a gauge of excess liquidity in the system. As the graph shows, the facility has dwindled to near zero. Said differently, after years of having a sizeable store of liquidity, the financial system now lacks excess liquidity. This doesn’t mean a liquidity crisis is imminent. It simply means the financial system has returned to its pre-pandemic liquidity status. However, if liquidity demands increase, there is no liquidity in the proverbial bank as we have grown accustomed to. Thus, in the future, the Fed will likely be much quicker to act on a liquidity run today than it was when the ON RRP program had large balances.

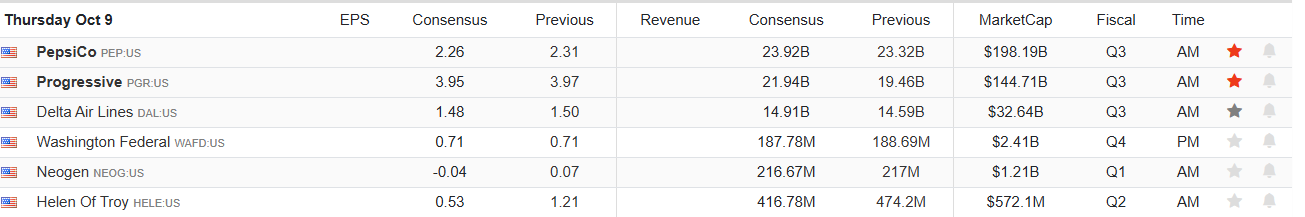
What To Watch Today
Earnings
(Click on image to enlarge)
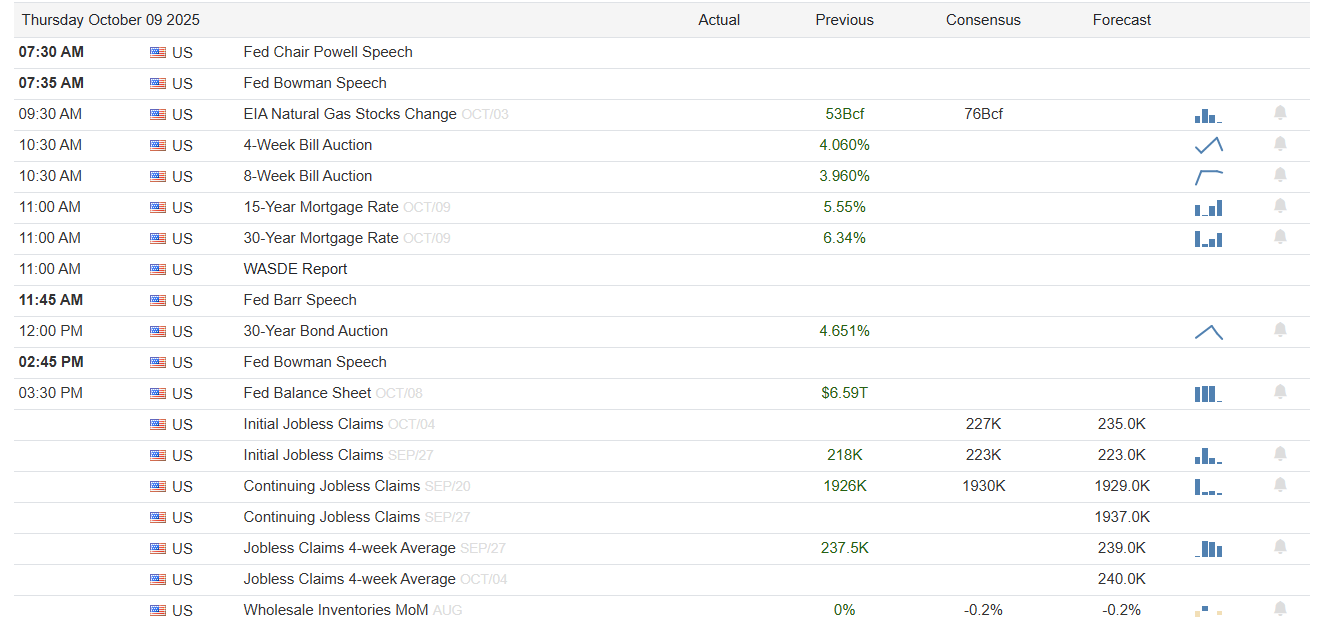
Economy
(Click on image to enlarge)
Market Trading Update
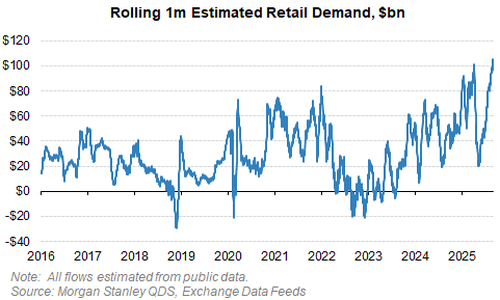
Yesterday, we discussed global liquidity and the risk to dollar-denominated assets in the event of a dollar rally, which is currently a hugely contrarian bet. Yesterday morning, the following data from Morgan Stanley jumped out at me. Simply put…retail investors are all in. Over the last month, they’ve poured more than $100 billion into equities, which is the largest one-month buying surge on record, according to Morgan Stanley. It’s not portfolio rebalancing. It’s not institutions quietly adding exposure. It’s speculation, momentum, and fear of missing out driving record flows.
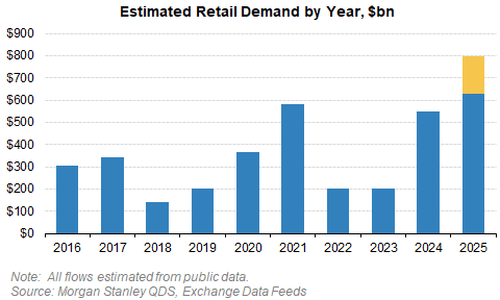
That also took the total amount of equities bought this year to $630bn and is on pace for $800bn for the full year.
That much demand doesn’t show up in a vacuum. It tells you everything about where we are in the market cycle. Momentum is running hot. Short sellers are getting squeezed, valuations are stretched, and fundamentals aren’t driving prices; it is only psychology at this juncture. The problem is that when psychology is in charge, discipline matters more than opinions.
While it is easy to develop a “bearish” mentality when viewing these factors, the market can stay irrational longer than most investors can stay solvent. So you don’t fight the tape. However, you also don’t trust it blindly. When retail flows hit extremes like this, it’s a sign you’re late in the cycle, not at the start. That doesn’t mean it’s over. But it does mean your strategy needs to adjust.
Here are four tactics to navigate this kind of environment:
- Tighten your exit rules. Late-cycle rallies often end with sharp reversals. Don’t guess when. Let price tell you. Use trend breaks, moving averages, or trailing stops. Get out fast when leadership weakens.
- Rotate into relative strength. Chase the names and sectors outperforming on a 3- to 6-month basis. Momentum works in these environments—until it doesn’t. But you don’t wait for value to catch up. Stay in what’s working.
- Limit exposure to high-beta trades. You can have some speculative exposure, but keep it small and defined. Don’t let high-beta positions dominate your portfolio. When momentum turns, these names get hit the hardest.
- Build optionality into your cash. Cash isn’t bearish. It’s strategic. In late-cycle markets, you want dry powder. If volatility returns or sentiment shifts, you’ll have the flexibility to act—without being forced to sell on the way down.
Retail buys with both fists, but that doesn’t mean you must chase. You must participate purposefully, control risk, and be ready to step back when the music stops.
Thinking like a bear doesn’t mean hiding. It means preparing.
Got Gas? If Not, SimpleVisor Can Help You
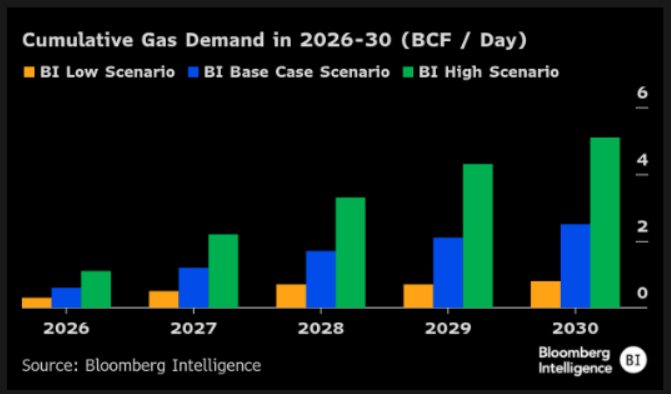
It’s not a secret that the AI boom is heavily reliant on energy. Moreover, over the next five years or longer, natural gas will remain the predominant energy source to meet increasing demand. How can we profit from this within the traditional energy sector? There are two primary ways: producers/drillers and the pipeline companies.
We like the natural gas producers, but we are cautious because their profits are heavily dependent on natural gas prices. While the chart below suggests an increase in natural gas demand, natural gas is abundant. Therefore, the increasing supplies could offset much of the growing demand, keeping prices stable. Natural gas pipeline operators profit from the volume of gas moving through their pipelines and are less dependent on the price of natural gas. Thus, we believe these companies are better positioned to profit from the increased demand for gas.
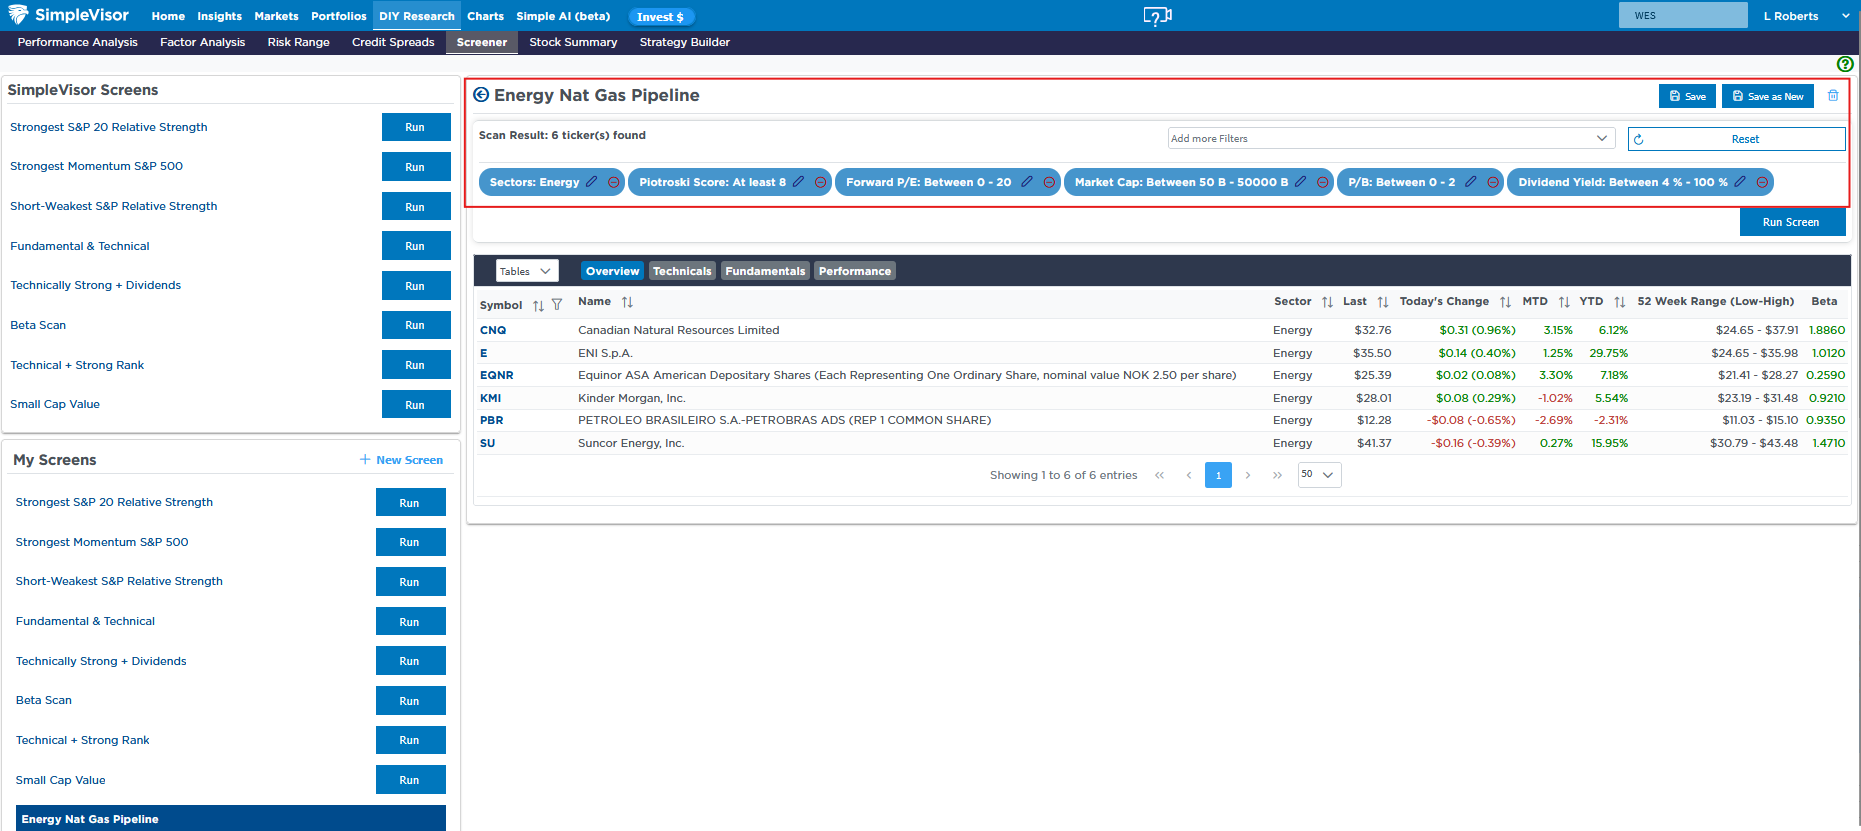
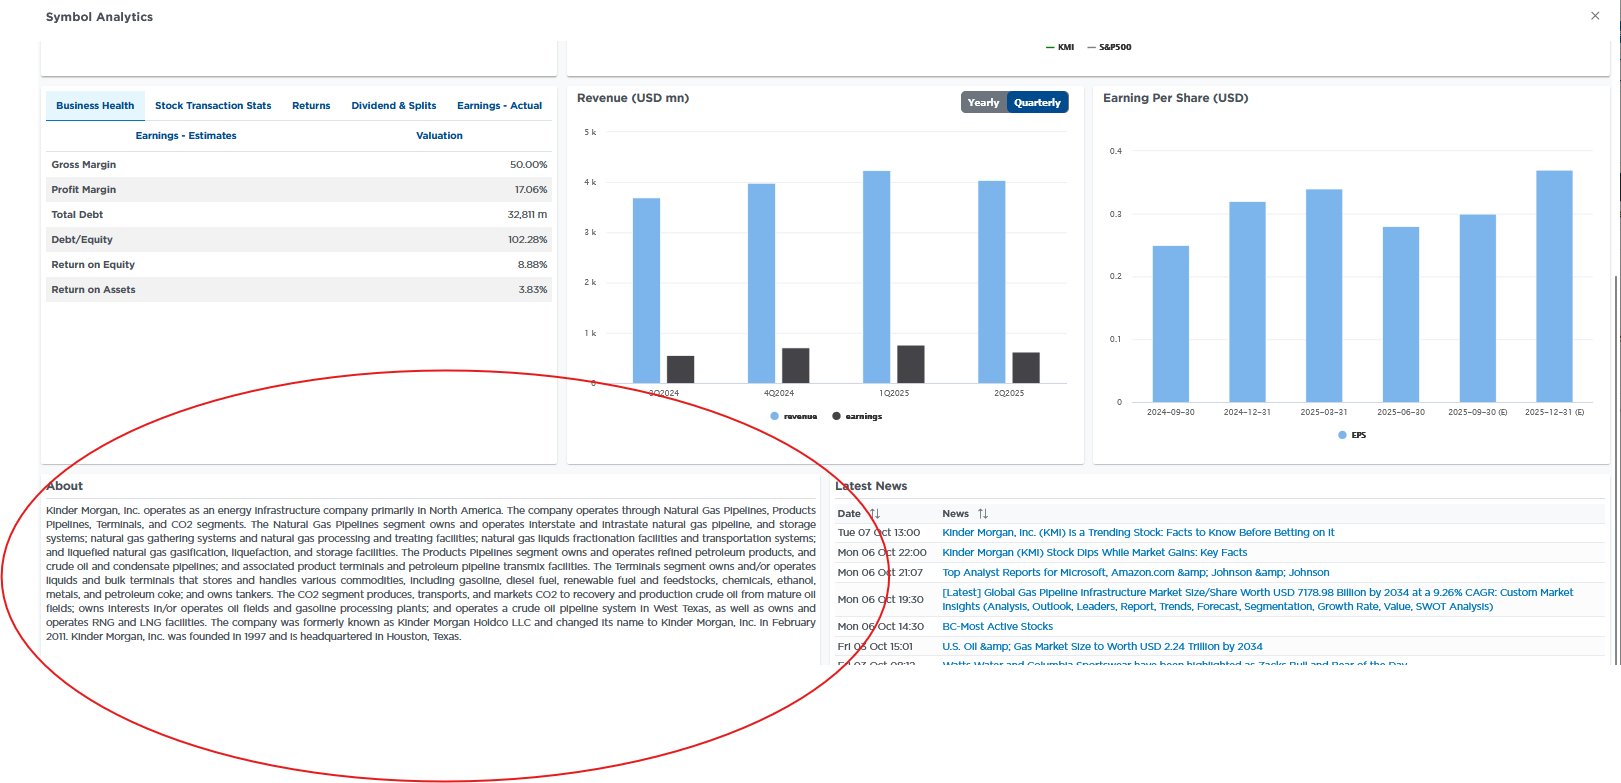
To help us identify natural gas pipeline stocks that may be of interest, we can utilize the SimpleVisor Screening Tool. The second graphic below shows the screening tool and a quick screen we made. The red rectangle highlights the six categories and their respective thresholds that we chose for our screen. Unfortunately, we can only screen the entire energy sector and not just pipeline companies. Thus, once we come upon a roster of potential stocks, we gave each company a scan to see which were primarily natural gas pipeline companies. To do this, we click on the tickers, and a summary pop-up page opens. This page provides the following: company overview, chart, fundamentals, short interest, insider statistics, option chains, technical studies, and recent news. The third graphic from the overview tab provides a summary of what Kinder Morgan (KMI) does.
As a disclaimer, we own Kinder Morgan in our Equity, All Weather, and Dividend Equity models.
Recession And Bonds: Navigating The Next Recession
It’s odd to consider, but a recession could flip our bullish outlook on bonds to bearish. It’s unusual because typically, inflation drops during a recession, leading to lower yields and higher bond prices. While we believe that if an economic downturn or recession occurs soon, the immediate effect on bonds will be favorable. However, the bigger question in our mind is how steep a decline in yields we might see.
While many factors will ultimately influence the answer, the primary constraint on a decline in yield may be the government’s response to a recession. In 2020 and again in 2021, the government issued checks to the public to stimulate economic growth. These checks, along with other large-scale fiscal spending and supply chain shutdowns, led to the highest inflation rates since the early 1980s. Although it’s unlikely that the next recession will face supply constraints like those during the pandemic, we worry that another round of fiscal stimulus, including direct payments to the public, could drive inflation higher. Moreover, grossly negligent fiscal deficits could further spur the bond vigilantes to pressure yields higher.
Some of our readers, upon hearing this concern, have asked us how Treasury Inflation-Protected Securities (TIPS) can protect them in such a situation. To answer their question, we review recent history and compare an actual TIPS to a non-inflation-adjusted Treasury bond (nominal bond) before, during, and after the 2022 inflation surge. Additionally, we provide an overview of TIPS to help you better understand their mechanics and when they might offer better returns than nominal bonds.
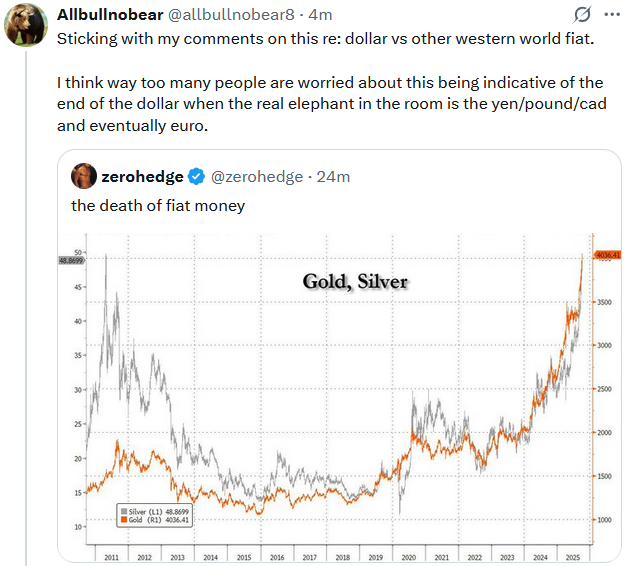
Tweet of the Day
More By This Author:
OpenAI: Fueling Massive AI Stock GainsAMD Surges: Nvidia Competition Heats Up
Corporate Prices Lead Consumer Prices


Comments
Log in or sign up to join the conversation.