
Corporate bond issuance was strong in the first half. High-yield, in particular, is on course for yet another record year. The Fed essentially provided a backstop to corporate bonds in March last year, setting ablaze risk-on sentiment. Corporate profits are at a new high, but they are not being used to pay down debt, which is at a record itself. The longer this imbalance goes on, the more painful the eventual unwinding.
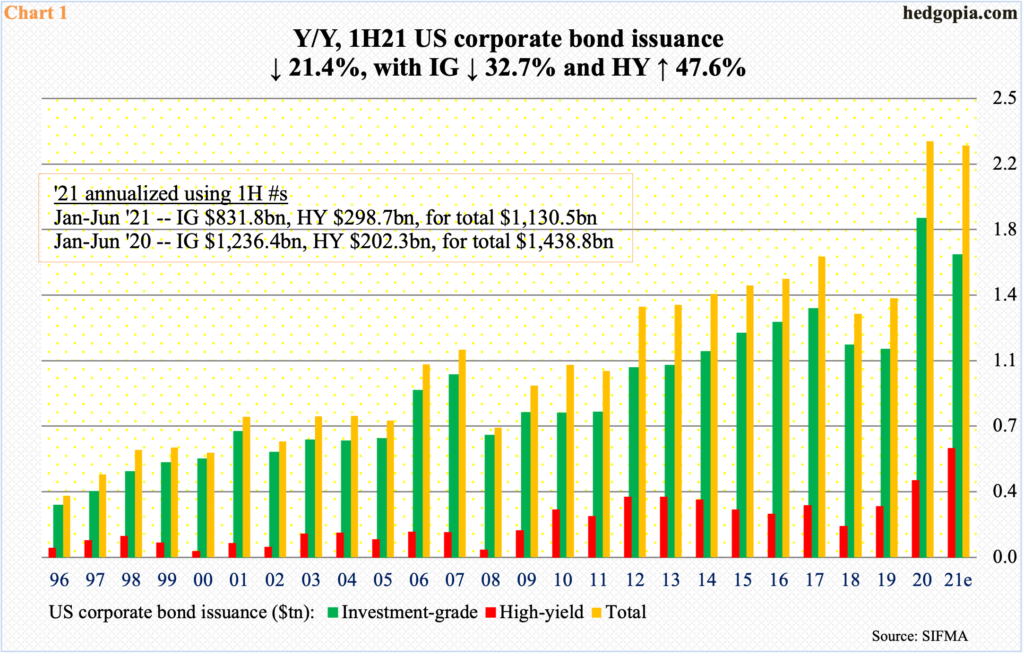
US corporate bond issuance is tracking strong. With six months in, corporations are on pace to issue $2.26 trillion this year, just slightly below last year’s record $2.28 trillion.
A lot can change in the next six months for sure. But going by the first six, the issuance dynamics have changed this year.
Investment-grade, too, is tracking a down year this year – $1.66 trillion versus $1.86 trillion. But high yield is very strong, with the issuance on course for $597.4 billion versus last year’s $421.6 billion (Chart 1).
High-yield ETFs such as HYG (iShares iBoxx High Yield Corporate Bond ETF) and JNK (SPDR Barclays High Yield Bond ETF) are trading near their highs. This is in sharp contrast to March last year when corporate bonds took a nasty hit – both investment-grade and high-yield. The bond market froze in fear of the then-unfolding pandemic. That was when the Federal Reserve announced that it would begin buying corporate debt. Investors got the message and bid up these bonds, trying to front-run the Fed, which never really had to aggressively get involved. As of last Wednesday, the central bank’s corporate credit portfolio held less than $14 billion. But the goal was achieved, which was to stabilize the market. Stabilize it did, and then some. Investors heavily went risk-on. Early last month, the Fed announced that it would sell off its ETF and direct bond holdings. Investors did not bat an eyelid.
Similar to margin debt, high-yield helps measure investor sentiment toward risk-on.
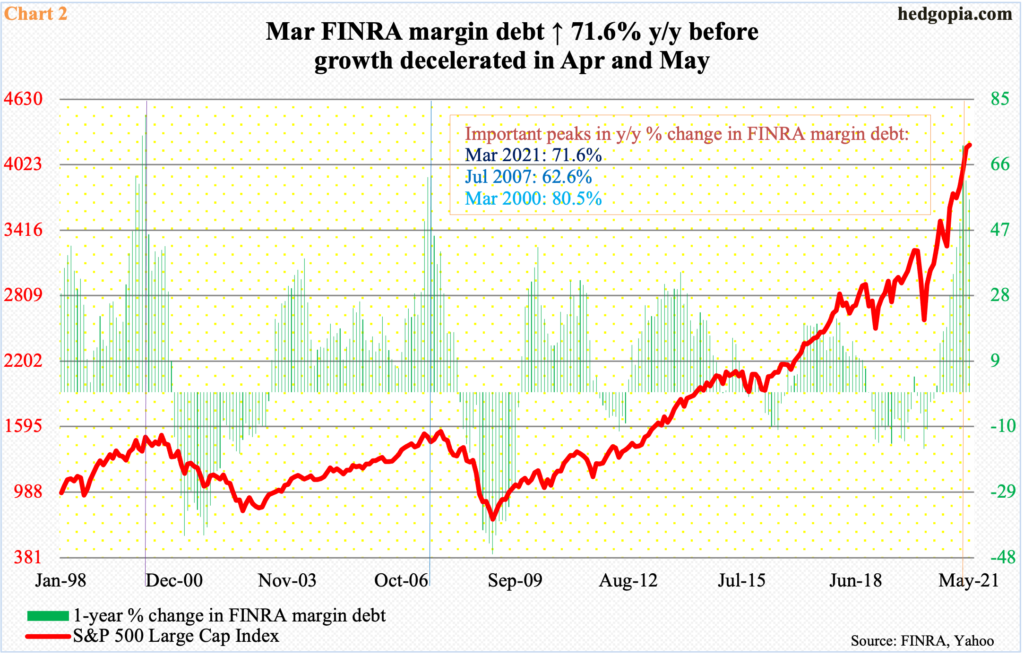
Speaking of which, margin debt stood at $861.6 billion in May, a new record and up 80 percent from March last year. That said, it surged nearly 72 percent year-over-year in March, before decelerating in April and May. This is worth watching as March’s growth rate is right in line with the prior major two peaks from March 2000 and July 2007 (Chart 2).
Once risk-off begins in these metrics, repercussions will be felt far and wide.
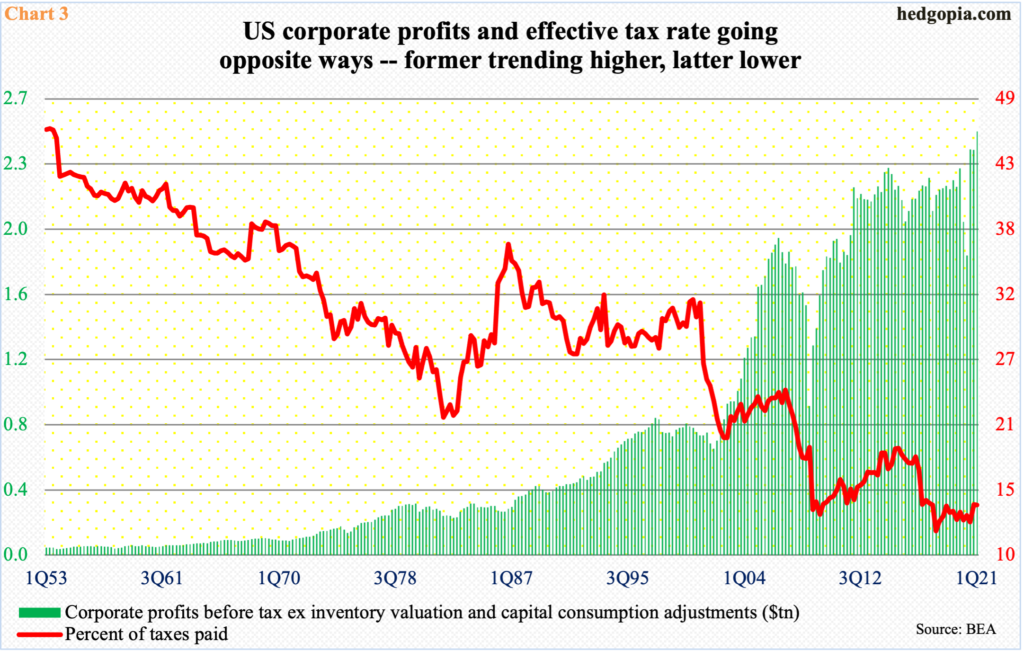
Corporations are making record profit but that is not being used to pay down debt. US corporate profits before tax and before adjusting for inventory valuation and capital consumption were $2.54 trillion (seasonally adjusted annual rate) in the first quarter – a fresh record. This stood at $2.31 trillion pre-pandemic in 4Q19, before collapsing to $1.79 trillion in 2Q20.
Ironically, the share of profits going toward taxes has been under constant pressure. In 1Q20, $358 billion were paid in taxes. This makes up 14.1 percent of profits. The red line and the green bars in Chart 3 are going the opposite ways, meaning more and more is dropping to the bottom line.
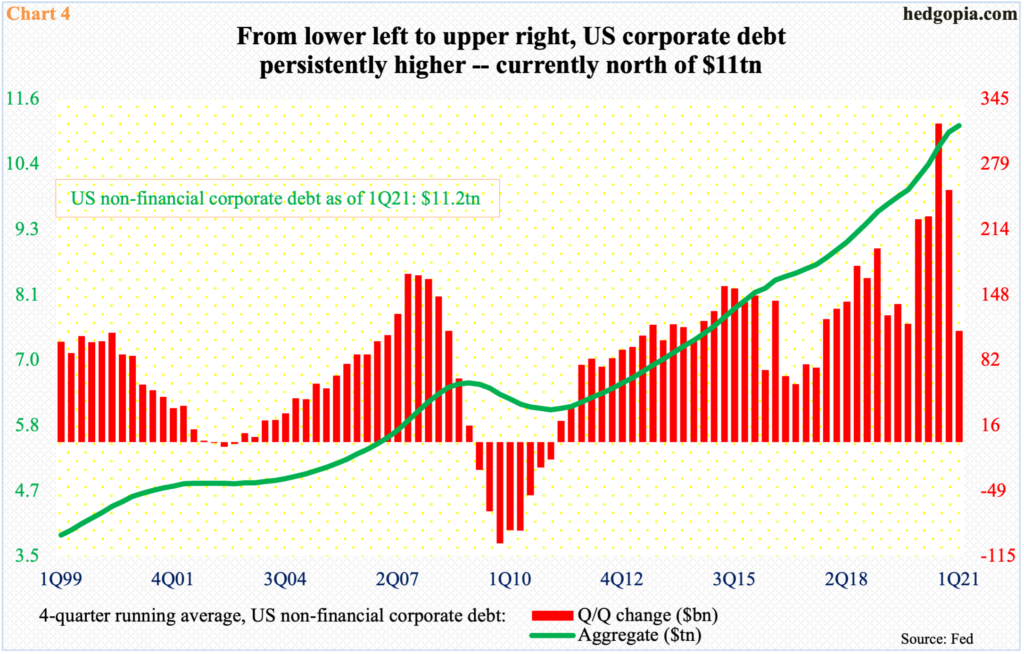
Corporate debt in the meantime is at a record. In 1Q20, it hit $11.2 trillion – a new high. When the Great Recession ended in June 2009, corporations owed $6.5 trillion.
Chart 4 uses a four-quarter running average to detect the underlying trend and it has been nothing but up. The quarter-over-quarter rate of change has decelerated but from a very high level.
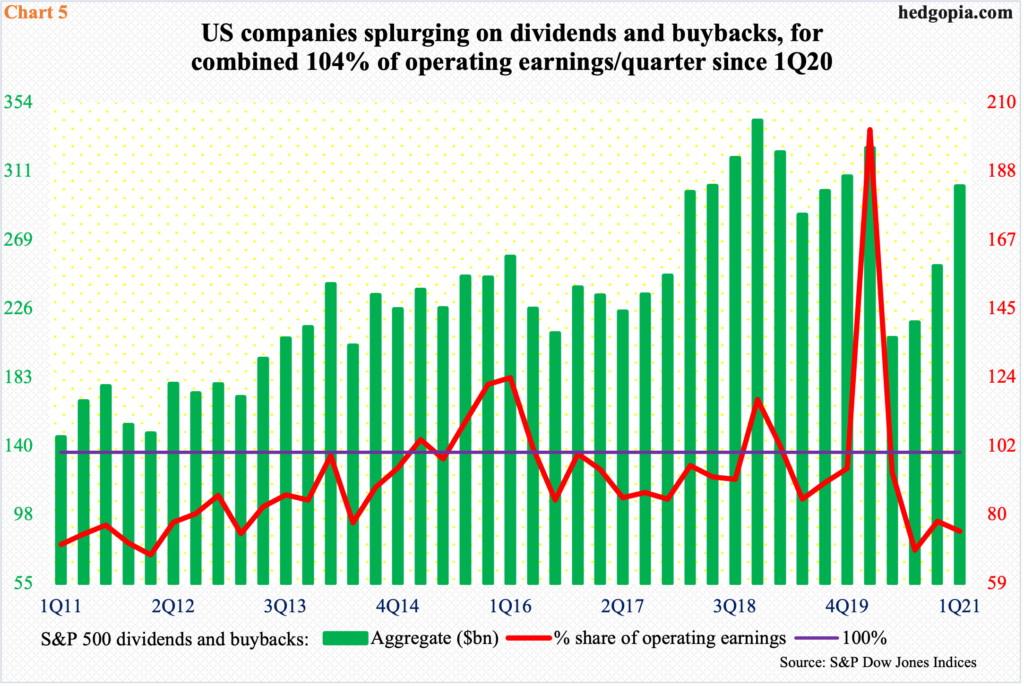
Amidst this, the amount going toward shareholders in the form of dividends and buybacks is growing at a healthy clip.
In 1Q21, S&P 500 companies spent $123.9 billion in dividend payments and $178.1 billion in share buybacks. Combined, the two accounted for 75.2 percent of $401.7 billion in operating earnings. In 1Q20, their share was as high as 201.5 percent, but this was more of an anomaly. Nonetheless, they have consistently accounted for 70 to 80 percent, which is not chump change. This is coming at a time when the debt load continues higher.
The math just does not add up. Profits are not being used to reduce the debt load and are not being retained. The imbalance has continued to grow. The prevailing monetary policy is adding fuel to the fire. The longer this goes on, the more the buildup of excesses. The only question is how long before it snaps – in all probability in a bad way.


Comments
Log in or sign up to join the conversation.