
Bitcoin To 52-Week Lows

Image Source: Pexels
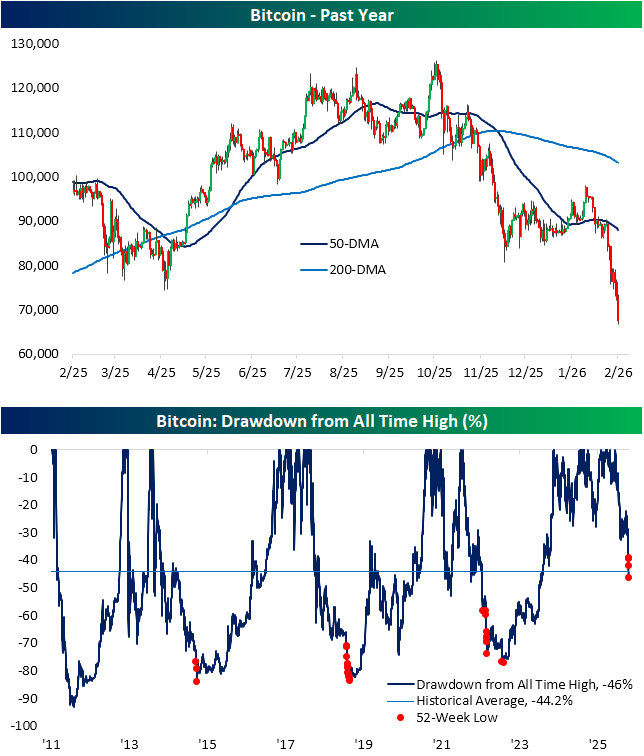
As we discussed in today's Chart of the Day, the recent wave of selling hitting the market has been thematic. The AI trade has taken its lumps, and crypto stocks have sold off sharply in tow. For the latter group, that comes as crypto itself is plummeting. As shown below, Bitcoin rose to records in the $120K range throughout the summer and into this past fall. However, in the past several days, it has reached 52-week lows, collapsing into the $67K range today. For as volatile an instrument as Bitcoin is, 52-week lows have been relatively hard to come by. In the past decade, the only other examples of 52-week lows occurred in the fall of 2018, the spring of 2022, and November 2022.
As shown in the second chart below, those forays into 52-week lows have usually occurred closer to the end of major drawdowns rather than at the start of longer-term sell-offs. Further, this current sell-off is now right near the size of the historical average drawdown from all-time highs (46% today versus an average of 44.2% since 2011). Finally, we would note that although it's an average-sized drawdown as of now, these latest 52-week lows have arrived when Bitcoin was in much less of a severe decline than previous examples.
More By This Author:
Average Software Stock Now Down Since Tariff Tantrum Lows
Walmart: The First Trillion Dollar Big Box
Precious Search Interest
Disclaimer: Bespoke Investment Group, LLC believes all information contained in this report to be accurate, but we do not guarantee its accuracy. None of the information in this report or any ...
more

