


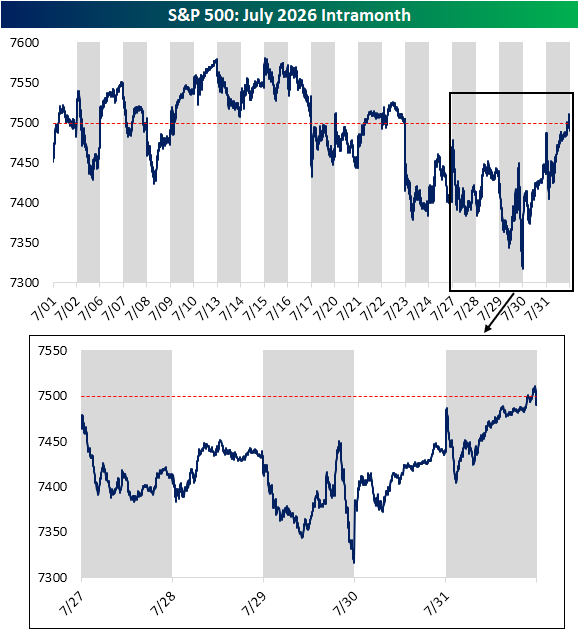
The calendar has turned the page, and if only for a moment, it was looking like the S&P 500 was going to finish the month of July in the green. In the charts below, we show the S&P 500's intraday path in July including a zoom-in on the last week of trading. As shown, the index was firmly in the red throughout the back-half of the month, but there was steady buying in the final few sessions. In fact, the index briefly moved above its level from the end of June (red dashed line) on Friday late in the session, but that monthly gain was erased in the final minutes of the day.
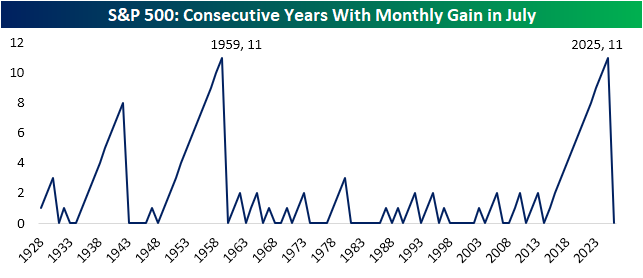
While you had to squint to see it, the decline in July was the first since 2014. As shown below, that streak of 11 straight years with a monthly gain in July now is tied with the 11 year streak through 1959 for the longest on record.
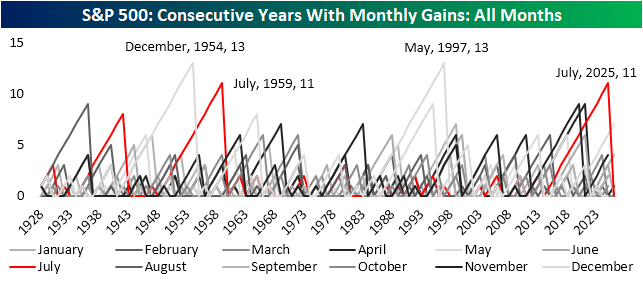
Comparing to all months, there have only been two other times that there have been a monthly gain in the same month for 10+ years. The first of those was December gains in the 13 years ending 1954. The other was a 13 year-long May winning streak ending in 1997.
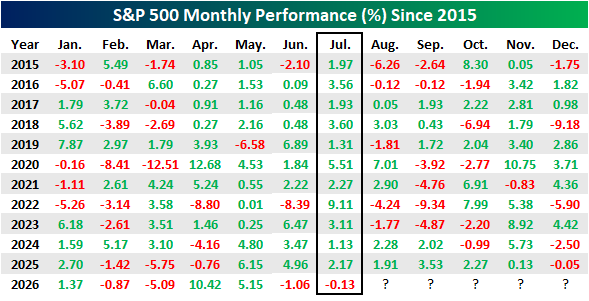
For further detail, in the table below we show the S&P 500's monthly performance for all months of the year since 2015. Apart from July, other surrounding months of April, May, and June have also consistently seen positive performance in recent years. However, looking ahead, August September, and October have seen more mixed performance with positive performance only about half the time. Not until November do monthly returns turn more positive.
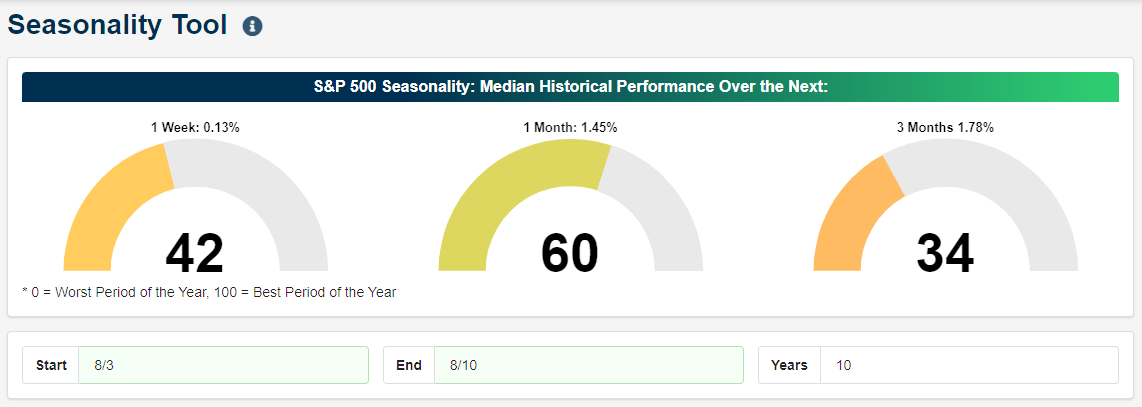
Below is a snapshot of our Seasonality Tool. Similar to the results above, our stock market seasonality gauges are showing an average to below-average time of year over the next few months.



Comments
Log in or sign up to join the conversation.