

Alternative perspective on PCE Deflator inflation:
PCE deflator below 2%:
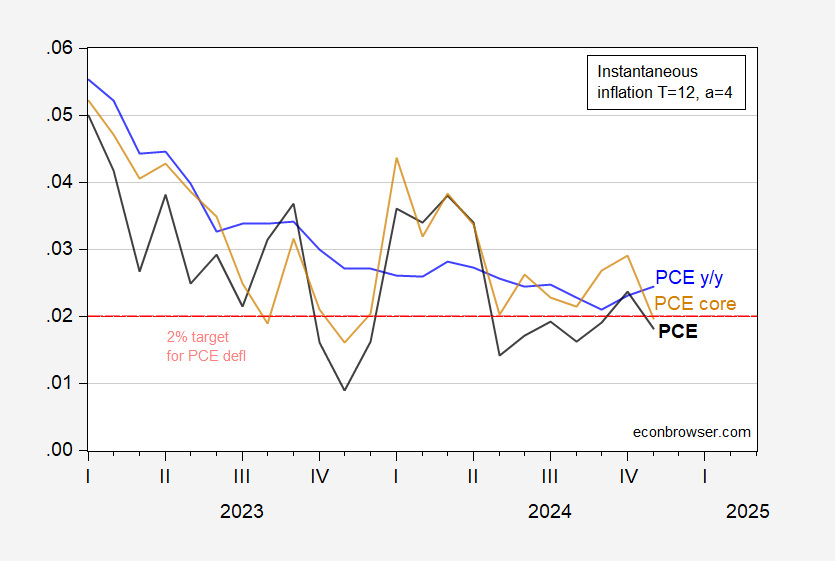
Figure 1: Instantaneous inflation (T=12, a=4) for PCE deflator (black), for core PCE deflator (pink), CPI (tan), and year-on-year PCE deflator (blue). Red dashed line at PCE inflation target. Calculations per Eeckhout (2023). Source: BEA via FRED, and author’s calculations.
How does the PCE deflator compare against the market prices based PCE deflator, CPI and HICP? Here’re all the series through November.
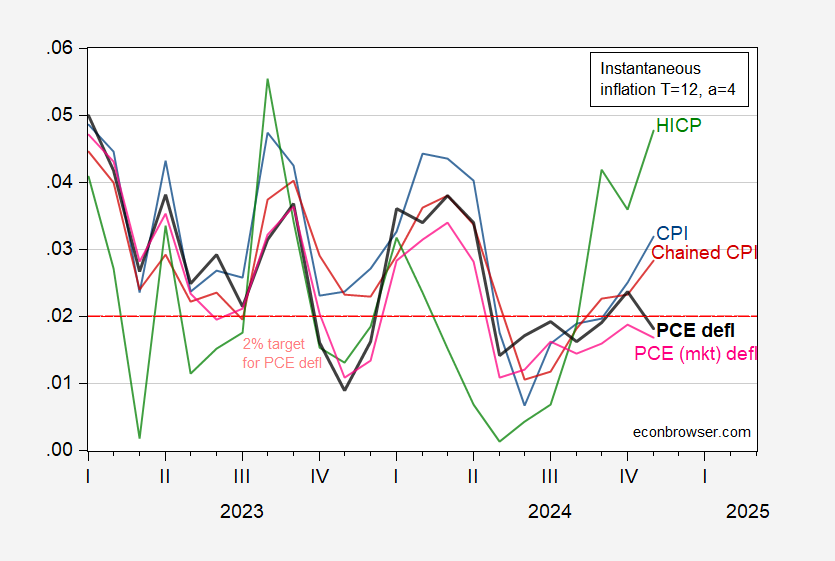
Figure 2: Instantaneous inflation (T=12, a=4) for PCE deflator (black), for PCE deflator market prices (pink), CPI (blue) chained CPI (red), HICP (green). Red dashed line at PCE inflation target; implied CPI target is 2.45 ppts. HICP and chained CPI seasonally adjusted by author using X-13. Calculations per Eeckhout (2023). Source: BLS, BEA, European Commission via FRED, and author’s calculations.
More By This Author:
More And More Market Participants Don’t Believe The Fed Anymore
Business Cycle Indicators For November 2024
Canada And Recession


Comments
Log in or sign up to join the conversation.