A Decomposition Of Per Unit Price Inflation In Nonfinancial Corporate Sector, Through 2023Q3
For nonfinancial corporate business sector, using price per unit real gross value added.
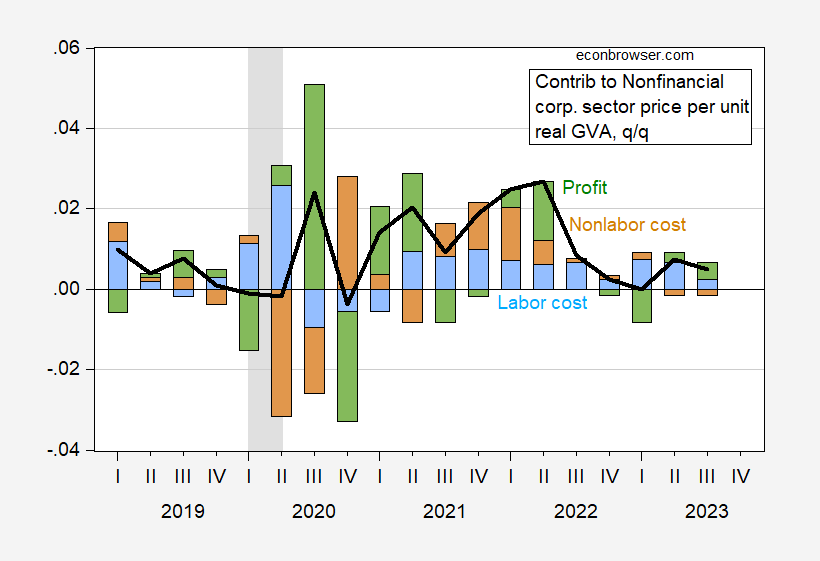
Figure 1: Quarter-on-quarter inflation of price of gross value added (black line), contribution of unit labor costs (blue bar), of non-labor unit costs (brown), and of profits (green). NBER defined recession dates shaded gray. Source: BEA 2023Q3 2nd release, Table 1.15, NBER, and author’s calculations.
Note that profits have added substantially, an accounting sense, to the price level of gross value added, in certain quarters (e.g., 2020Q3, 2021Q1-Q2), and deducted in others (e.g., 2020Q4).
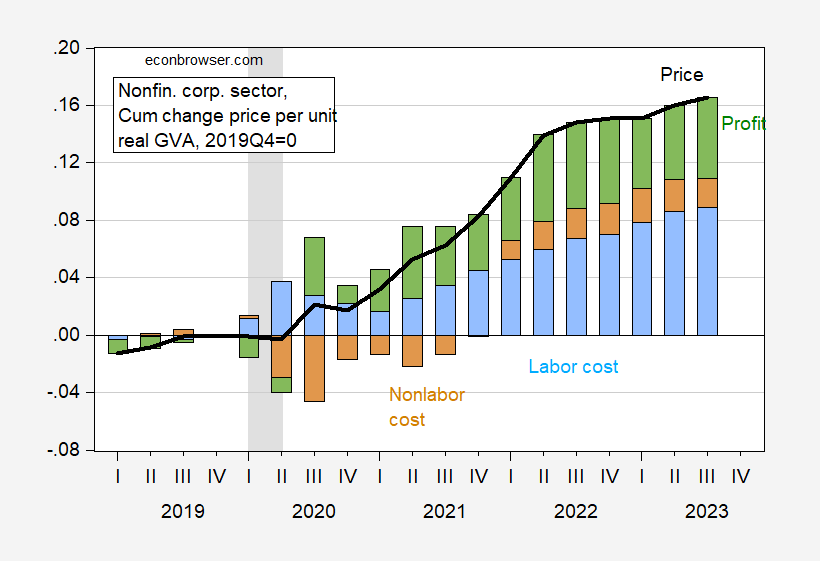
What’s the cumulative impact since the last NBER defined peak? This is shown in Figure 2.
Figure 2: Cumulative increase in price of gross value added (black line), cumulative contribution of unit labor costs (blue bar), of non-labor unit costs (brown), and of profits (green), all relative to 2019Q4. NBER defined recession dates shaded gray. Source: BEA 2023Q3 2nd release, Table 1.15, NBER, and author’s calculations.
Note that labor costs are specifically unit labor costs; hence they incorporate changes in productivity.
The picture shows that while corporate profits are not inconsequential to price level increase, they are actually smaller — in proportion — than labor costs.
Andy Glover noted in this FRBKC analysis that the profit share contribution to the price level is similar to what occurred in previous recoveries, at least through Q1.
More By This Author:
Business Cycle Indicators As Of End-November
Sentiment Down 46%, Confidence Down 25% Relative To Pandemic Eve
Soft Landing?


