

Today I’m launching a series of reports in which I aim to prove that the long-term secular bull market in precious metals—gold, silver, platinum, palladium, and mining stocks—is still alive and well despite the correction the industry has experienced since January.
My view all along has been that this pullback is simply a healthy and normal cooling-off period following two very strong years, 2024 and 2025, and not the start of a new secular bear market in precious metals like those seen in the 1980s and 2010s.
Unfortunately, a large portion of the precious metals community has sunk into deep pessimism, believing the party is over after just two years and that it’s all downhill from here, so I’m writing these reports to push back against that foolish, fallacious, and short-sighted thinking.
I decided to start this series with a report on silver, but I’ll be covering the other precious metals and the mining industry next, so stay tuned for those as well.
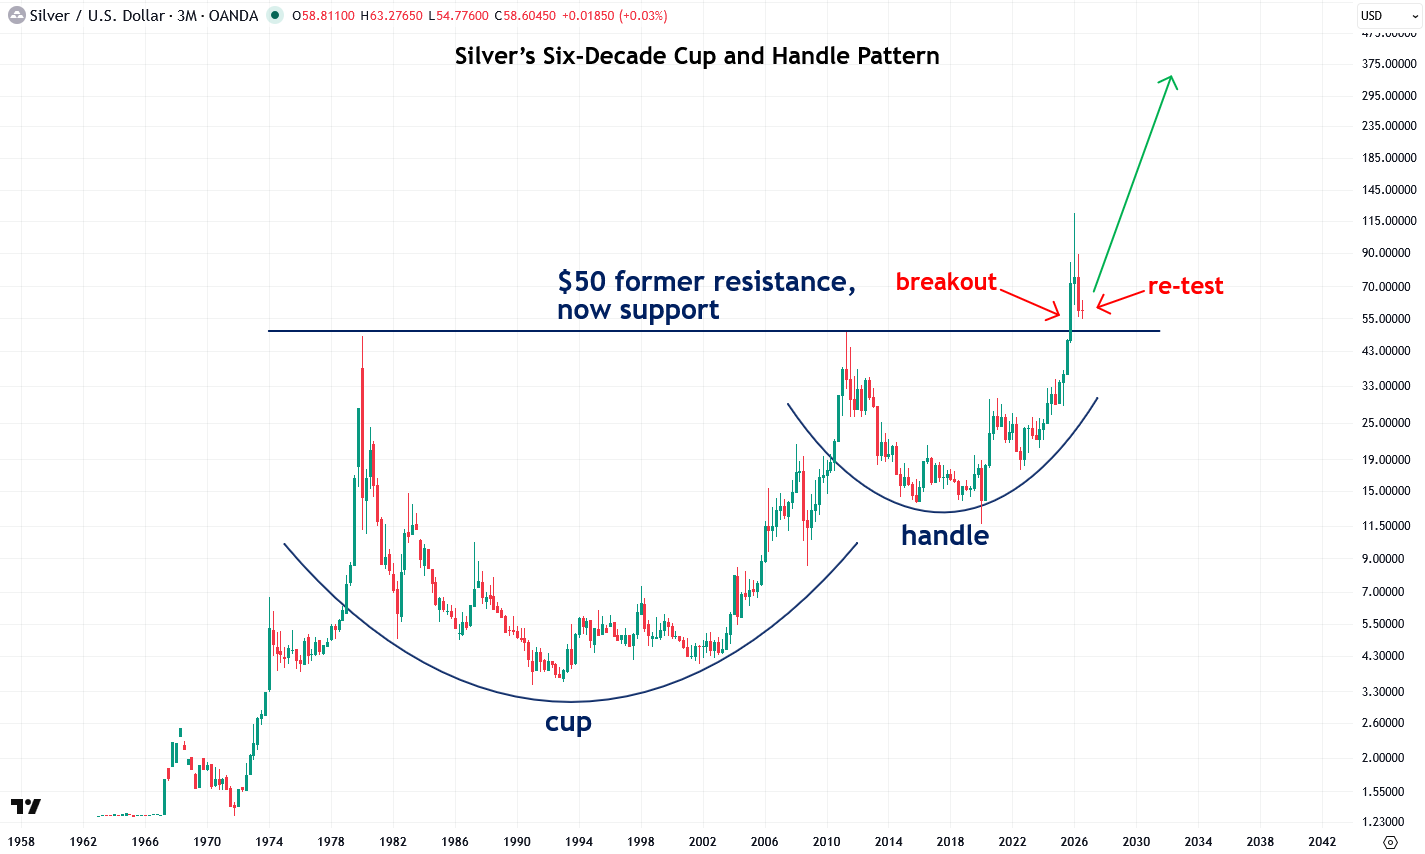
For the past couple of years, a key part of my bullish thesis on silver, though just one of many components, has been the breakout from its massive six-decade cup and handle pattern that began forming back in the 1960s. I started highlighting this pattern even before the breakout occurred in November 2025, and I reiterated how bullish it was once that breakout took place.
Due to the sheer size and magnitude of that pattern, both in terms of price and time, it projects silver reaching at least several hundred dollars per ounce over the next 5 to 10 years. I believe that is fully justified by how cheap it still is relative to multiple yardsticks (as I’ll show later in this report), as well as the global economic bombs that are set to explode in the coming years.
The breakout from silver’s cup and handle pattern occurred when it surpassed the key $50 resistance level in the fall of 2025, a level that has now become support, and that breakout remains completely valid even though silver has pulled back from its $121 peak in January. As you may recall, $50 marked the peaks of the silver bull markets in both 1980 and 2011, after which silver fell into bear markets, but not this time.
That is a sign that something very big is unfolding and that silver’s bull market is much closer to its beginning than its end. In other words, the party is just getting started, so it’s not time to be thinking about it winding down anytime soon.
And yes, silver got a bit ahead of itself in the short term in January, which I warned about at that time, and it has since pulled back, but it’s important to remember that it remains above that key $50 support level, which means that the overall bull market is still completely alive and well.
The pullback since January was simply a re-test of the breakout from its cup and handle pattern, and I expect silver to soon resume its upward trajectory now that the speculative excesses have been flushed out.
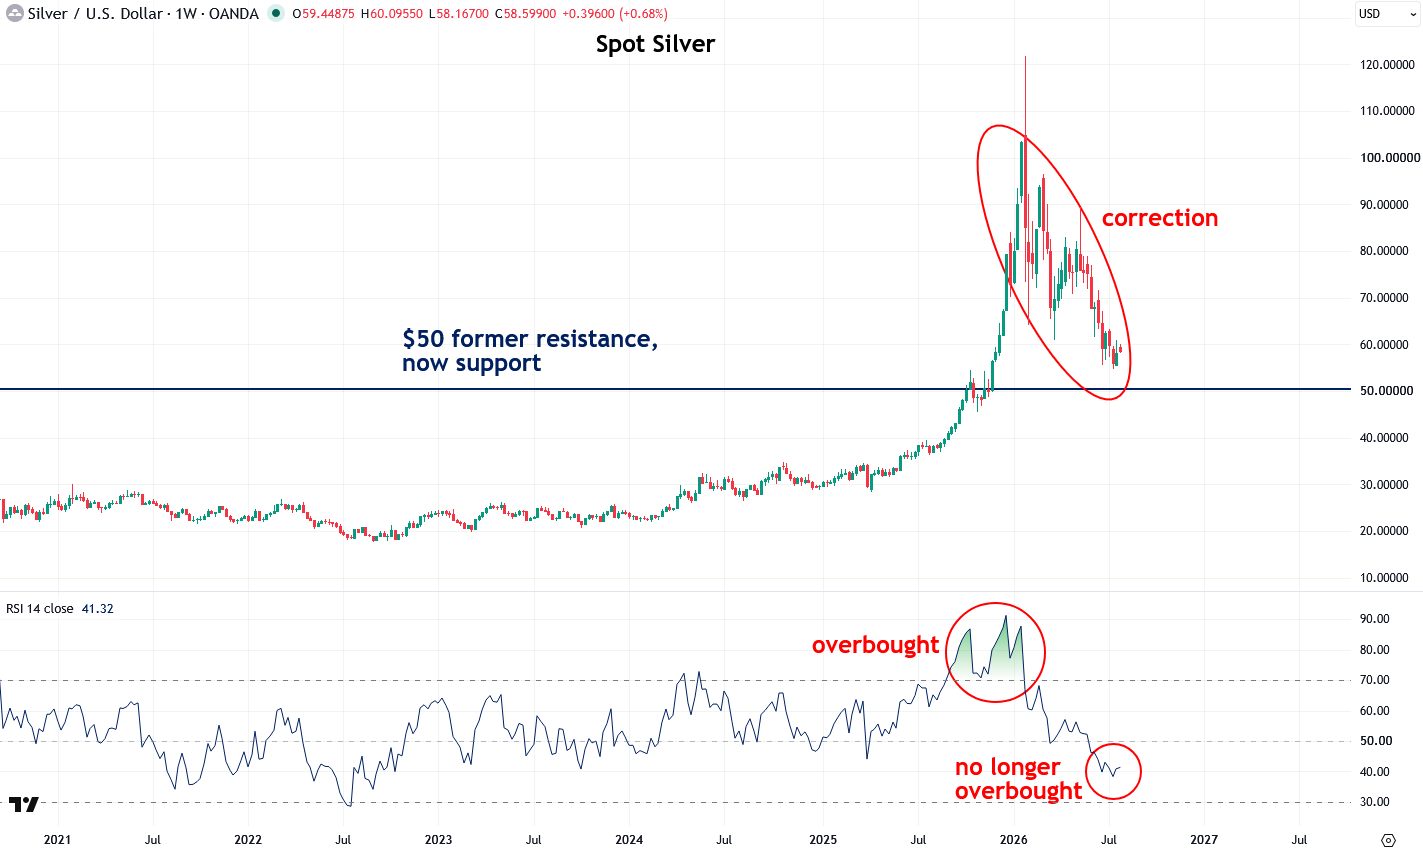
There is a way to measure short-term speculative excesses using an indicator known as the Relative Strength Index (RSI), which I’ve applied to silver’s weekly chart below. As you can see, silver became extremely overbought in January after roughly tripling in six months, which signaled a cooling-off period to follow.
It’s important to understand that this is completely normal market behavior. I’ve previously shown that every powerful bull market in history features this pattern of surges followed by pullbacks or consolidation, and there is no reason to expect this bull market in silver to be any different.
After six months of correction, silver is no longer overbought and is sitting just above its $50 support level, which was the former resistance of the long-term cup and handle pattern. That tells us this re-test of the breakout was successful and did exactly what it was supposed to do, which is flush out the speculative excesses, namely the fast-money traders who rushed in when things got hot in December and January and likely had little to no interest in silver when I first identified the early signs of a new bull market in the spring of 2024.
Now I know you’re probably thinking silver must touch that $50 support level for this re-test to be complete, but that’s not a given and there’s no ironclad rule that says it has to happen. That’s exactly why I publish my regular tactical analysis (click here for my most recent one), where I’m focused on determining when the correction is truly over and when the next leg of the bull market has begun.
Now I want to address the other reasons why silver has much further to rise, why January 2026 was not the end of the bull market, and why the several hundred dollar per ounce projection from the cup and handle pattern is quite realistic, by showing just how cheap silver still is across several reliable yardsticks.
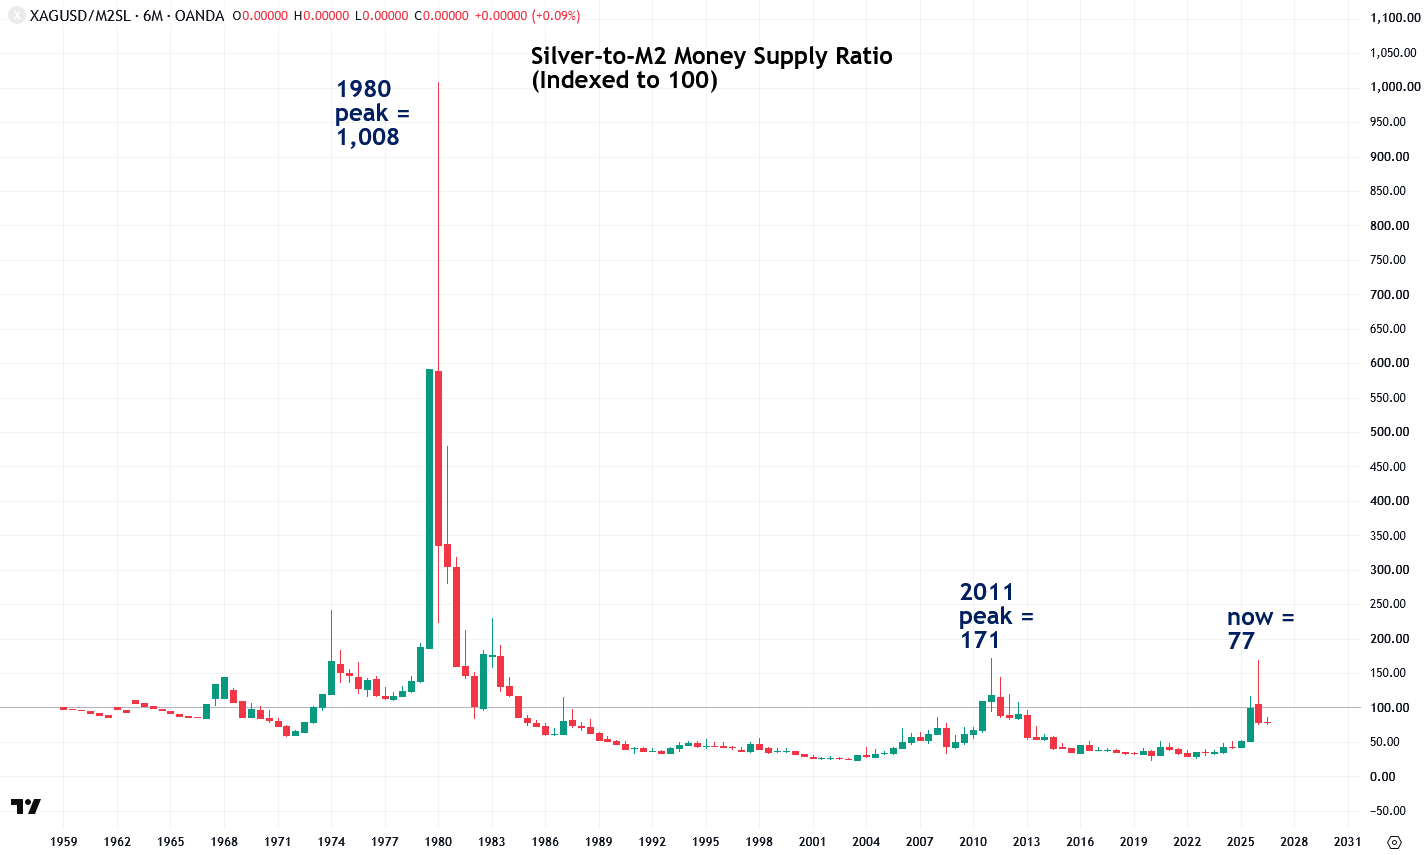
The first yardstick I will use is the silver-to-U.S. M2 money supply ratio, indexed to 100, which is essentially a way of adjusting for inflation, and in my view a far more accurate one than the Consumer Price Index (CPI), which is well known for understating inflation.
Regarding the use of the M2 money supply as a form of inflation adjustment, as Nobel Prize–winning economist Milton Friedman famously stated, “Inflation is always and everywhere a monetary phenomenon, in the sense that it is and can be produced only by a more rapid increase in the quantity of money than in output.”
According to the chart below, the silver-to-M2 money supply ratio reached as high as 1,008 in 1980 and 171 in 2011, but is now just 77, which shows that silver still has tremendous upside potential if it is to match its prior peaks.
And as I’ll explain later in this report, I believe this bull market in silver will not only match but blow past its 1980 peak for multiple reasons, most importantly because our debt burden is far larger today than it was back then.
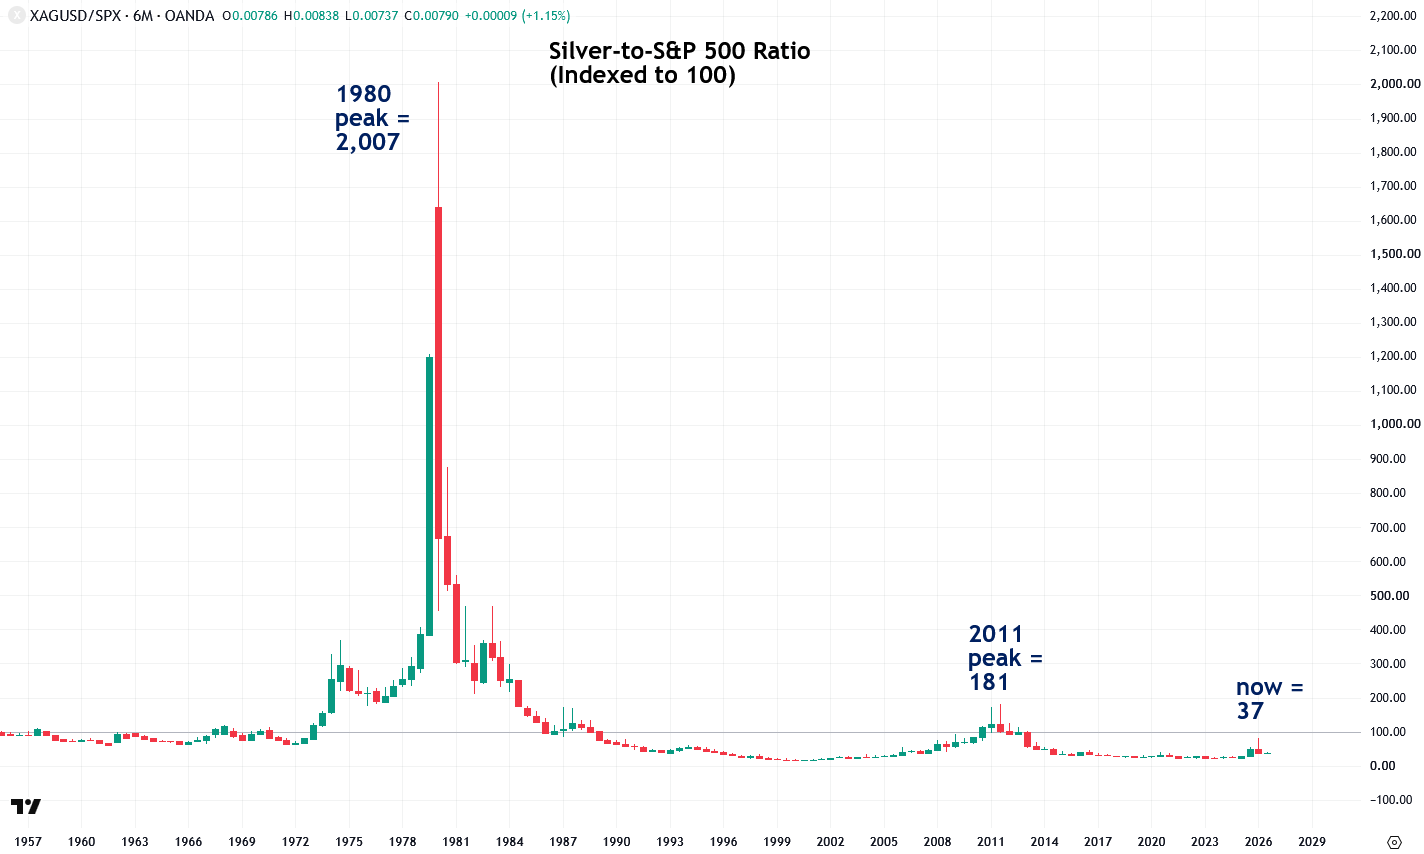
The next chart shows the silver-to-S&P 500 ratio, which is highly relevant because precious metals and stocks have historically acted as counterweights to each other, with capital rotating between them in recurring cycles that typically last over a decade, as I explained in this report.
The silver-to-S&P 500 ratio, indexed to 100, peaked at 2,007 in 1980 and 181 in 2011, but is now just 37, which further confirms that silver has much further to run in this bull market.
This is especially true given that the S&P 500 and the broader U.S. stock market are in the largest bubble in history, as evidenced by virtually every valuation metric, including the Buffett Indicator and the Shiller P/E ratio.
When the stock market bubble inevitably bursts, I see precious metals as the primary beneficiary, not Treasury bonds, the U.S. dollar, or real estate, as enormous amounts of capital flows out of the bloated stock market and into precious metals, sending them to the stratosphere. I am projecting at least $300 to $500 per ounce for silver and $15,000 per ounce for gold.
The silver-to-gold ratio, indexed to 100, also confirms that silver is quite cheap relative to its history. It reached 262 in both 1968 and 1980, and 129 in 2011, but is just 56 today, which shows that silver has significant room to rise and is not richly valued by any measure.

Comments
Log in or sign up to join the conversation.