

It’s time for another weekend precious metals and miners update, which I deliberately waited a couple of days to publish to give the markets time to digest the Fed’s widely expected rate hike. The initial market reaction to a Fed decision often proves misleading, while the price action that follows tends to provide a more reliable indication of how the market is ultimately interpreting the decision. That is why I wanted to let the dust settle a bit before publishing this latest technical update.
The Fed raised the federal funds rate by 25 basis points, or 0.25%, to a range of 3.75%–4.00% on Wednesday. The move was widely expected, with markets pricing in nearly a 90% probability beforehand, so it did not come as a surprise. This marked the Fed’s first rate hike in three years and was a unanimous decision by the FOMC. Fed Chair Kevin Warsh repeatedly emphasized the need to bring inflation under control, while also stressing that doing so should not require unnecessarily harming the labor market or economic growth.
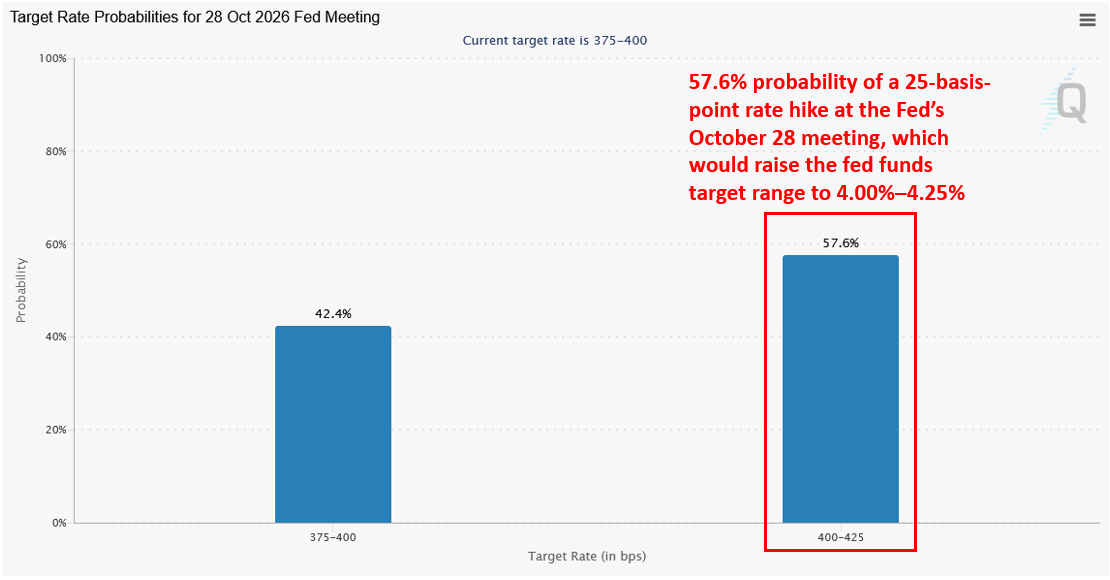
In their updated summary of economic projections, Fed officials indicated that they expect one more rate hike this year. At the moment, the CME FedWatch tool currently shows a 57.6% probability of an additional 25-basis-point hike at the Fed’s October 28 meeting, which would raise the federal funds target range to 4.00%–4.25%:
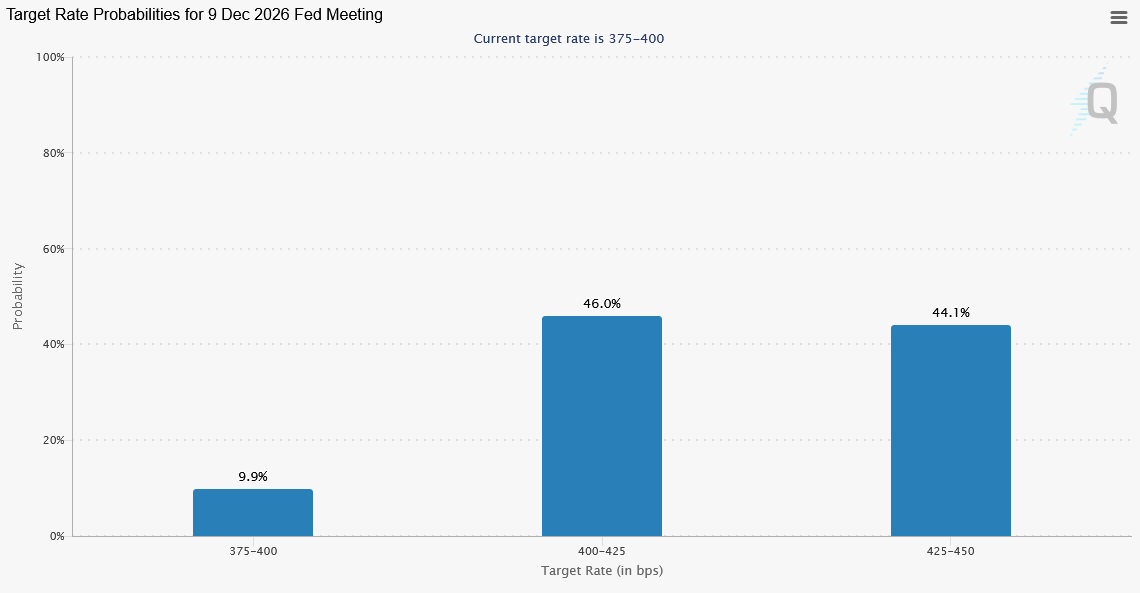
FedWatch also shows a 46% probability that rates will be in the 4.00%–4.25% range at the December 9 FOMC meeting, along with a 44.1% probability of reaching 4.25%–4.50%, which would represent an additional 50 basis points, or 0.50%, of rate hikes from the current level:
While the financial markets, including precious metals, initially fell on Wednesday in response to Fed Chair Kevin Warsh’s reiteration of his hawkish, or “tough on inflation,” stance, the rate hike itself was widely expected. Markets rebounded by the end of the week on optimism that the Fed is taking the inflationary threat seriously, contrasting with the July Fed meeting, when the Fed stood pat and triggered a sharp bond market selloff as investors grew concerned that it was not taking inflation risks seriously enough.
As an investor, I am personally relieved to finally have this heavily anticipated Fed meeting behind us, as the financial markets, including precious metals, had been stuck in a holding pattern ahead of it and unable to make much progress. Now that the meeting is over and the low-volume summer trading period has also come to an end, I believe the markets are in a much better position to make their next move.
Now let’s take a look at where precious metals stand, starting with gold, which leads the overall complex.
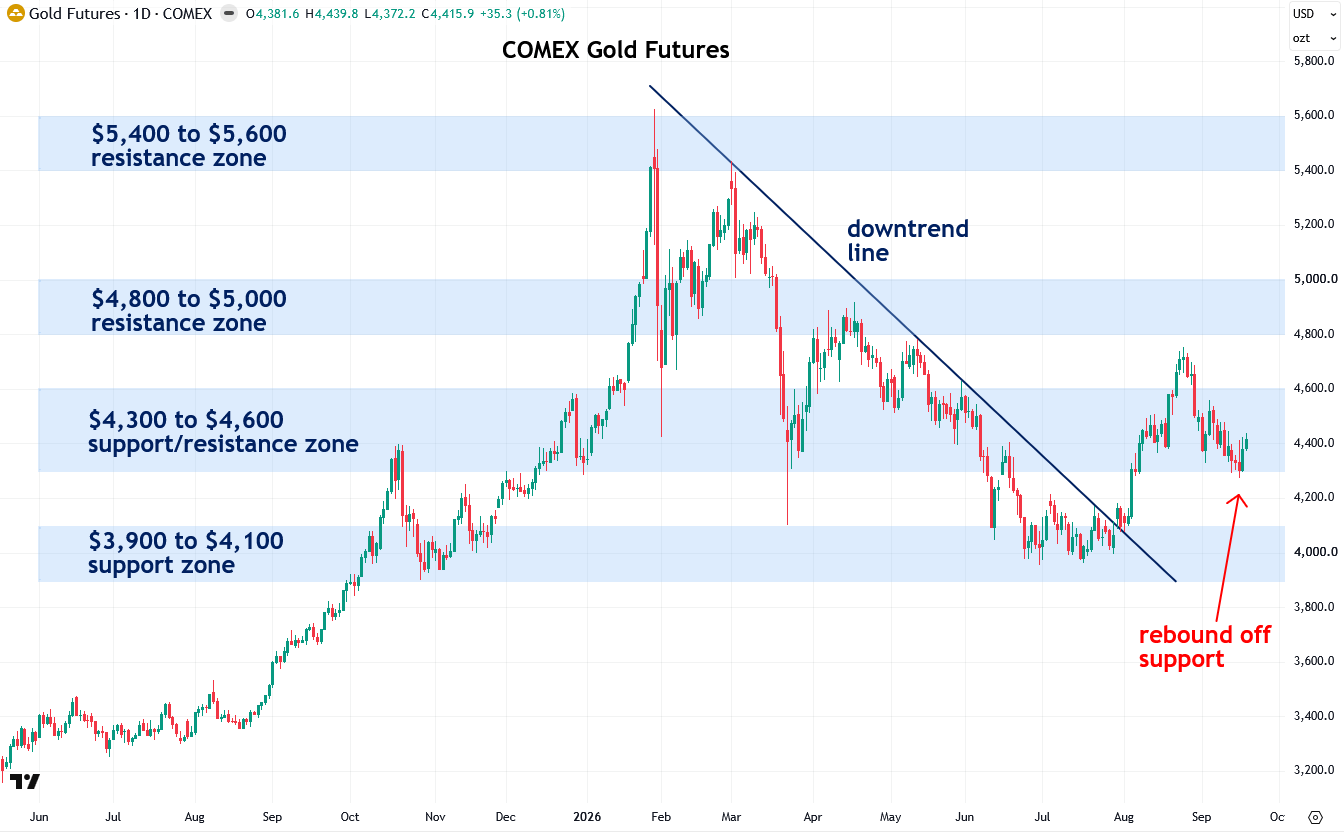
Gold initially sold off following Wednesday’s Fed meeting, testing the lower bound of its $4,300 to $4,600 support/resistance zone, but has since rebounded by approximately $100 per ounce.
To learn more about support and resistance zones, I recommend reading my two-part tutorial (Part 1 and Part 2).
The pullback that began in late August following the hawkish Fed meeting at Jackson Hole has successfully reset the overbought conditions that developed after gold rallied roughly $800, or 20%, in just three weeks in August.
It is important to remember that gold is not a hot tech stock or a cryptocurrency, and when an asset experiences such a sharp move over such a short period of time, it is common and healthy for it to undergo a cooling-off period before embarking on its next leg higher.
Following the pullback, precious metals investor sentiment is awful once again, as I can clearly tell from running this newsletter and maintaining my social media presence. From a contrarian perspective, however, I view that as an encouraging sign, as bull markets have a remarkable tendency to take as few investors along for the ride as possible.
Right now, I am looking for gold to continue holding its $4,300 to $4,600 support zone, rebound from its recent lows, and ultimately break out above this zone. I believe the odds of a successful breakout are greater now than they were in late August because gold is no longer overbought as it was at the time.
Assuming that breakout occurs, I next want to see gold surpass its $4,800 to $5,000 resistance zone, followed by its most important resistance zone at $5,400 to $5,600, which formed at the January and February peaks.
I want to see gold clear each of the resistance zones overhead, which would provide additional confirmation that the rebound remains on course. To learn more about the logic behind this approach, please refer to my recent two-part tutorial (Part 1, Part 2) on the importance of clearing overhead resistance.
As a reminder, I firmly believe that precious metals and miners are in a long-term bull market that began only in April 2024 and has at least another eight years to run based on historical cycles. I believe the January-to-August correction was merely a healthy pause within that bull market rather than the beginning of a new bear market. Read my recent report, where I explained this thesis in detail.
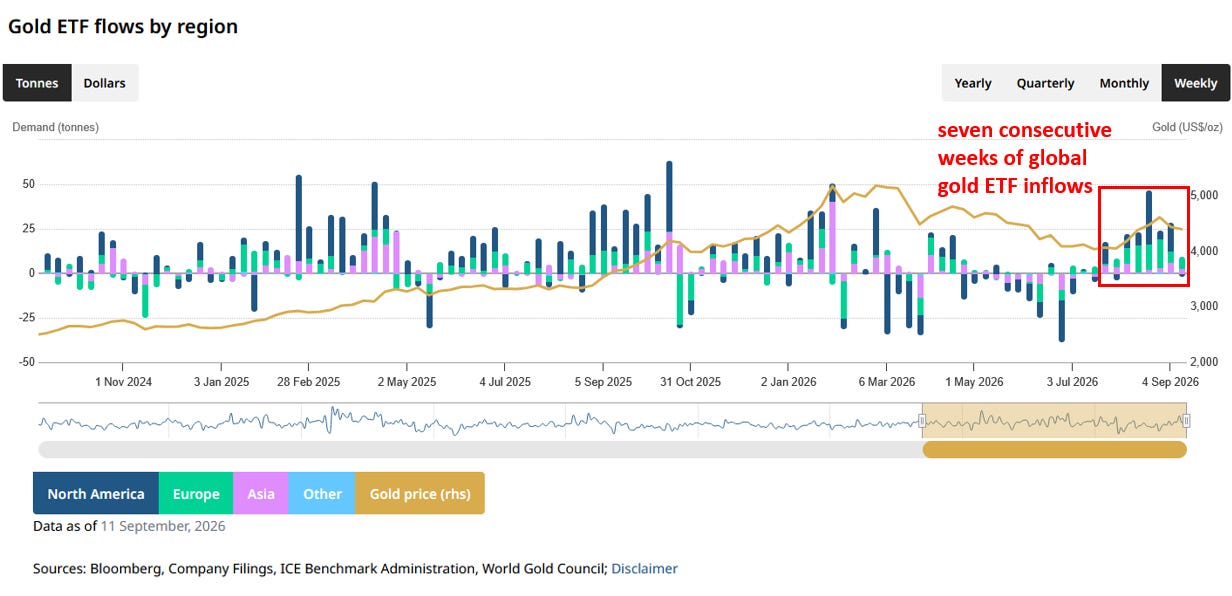
The latest data from the World Gold Council shows that gold exchange-traded funds (ETFs) have seen seven consecutive weeks of net global inflows, the longest streak since the correction began in January, totaling the equivalent of 150.44 metric tonnes, or $21.7 billion, of gold:
Moving on to silver, we can see that it continues to hold its critical $60 to $70 support/resistance zone and has climbed back toward the upper end of this zone following the Fed meeting, in a sign of relief.
Silver has now successfully reset the overbought conditions that developed following its $15 per ounce, or 27%, rally in August, which is healthy and normal behavior. While that rally may not look particularly dramatic on this chart, a 27% gain in such a short period of time is a very sharp move, so it is not surprising to see silver pause as it digests those gains and shakes out speculative investors who lack patience and conviction.
Read the full article here.


Comments
Log in or sign up to join the conversation.