


Two weeks ago, U.S. Treasury Secretary Scott Bessent shocked the world by announcing that the Treasury would aggressively ramp up its purchases of long-dated government bonds in an effort to stem their recent sharp price decline, which had pushed yields to their highest level since 2007. This poses a major threat to the U.S. government’s fiscal situation at the same time that the national debt has hit the shameful $40 trillion milestone.
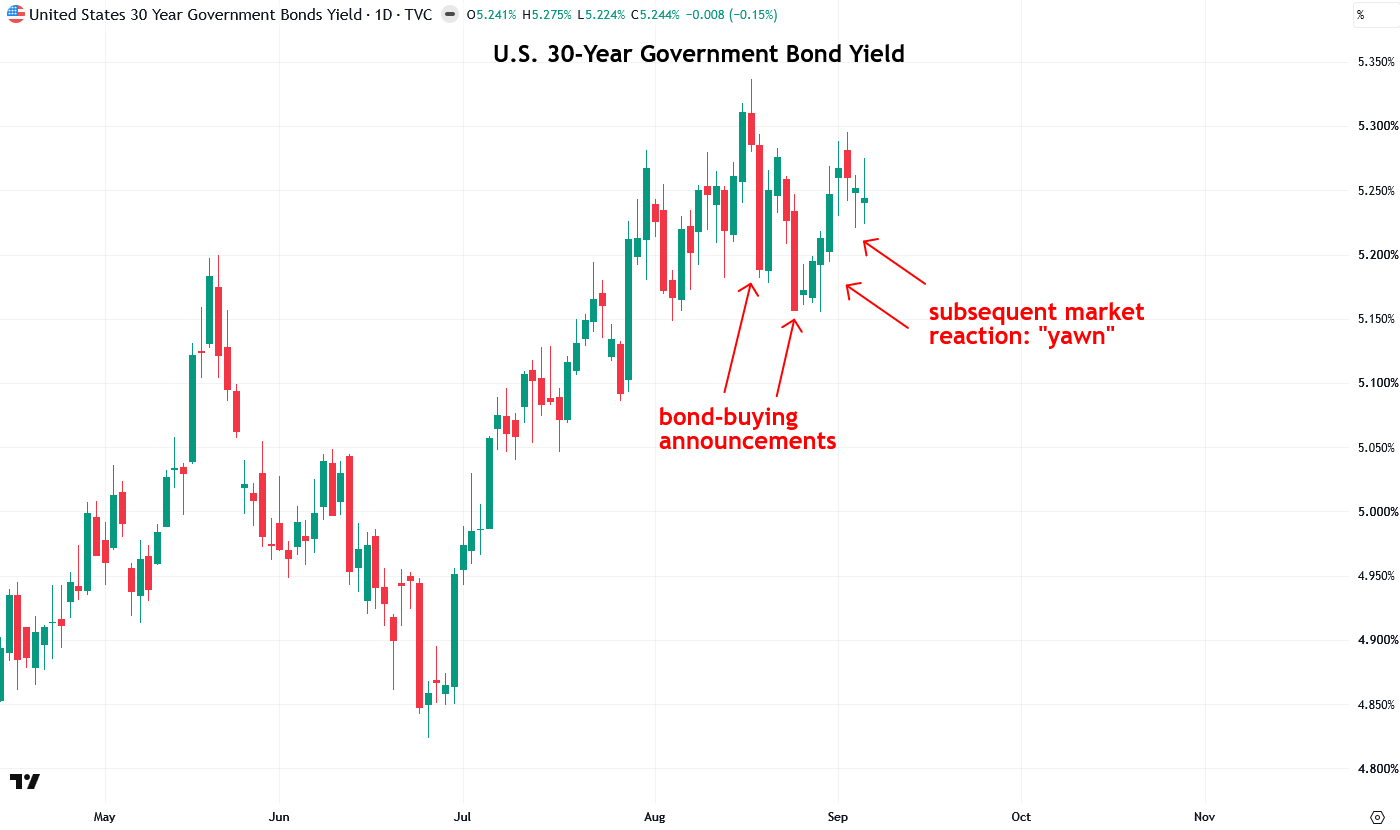
While Treasury bonds initially breathed a sigh of relief and rose sharply in price, causing their yields to fall, the move was largely reversed within just a matter of days. This alarmed Bessent, who then upped the ante by saying that government debt buybacks could be even larger than the originally announced $4 billion per operation.
As a result of the announcement, precious metals and commodities immediately surged due to concerns that this new bond-buying program would essentially be a form of yield curve control (YCC), involving outright debt monetization, or, in simpler terms, using the digital printing presses to create new money to buy bonds. This would result in further debasement of the dollar and even worse inflation ahead.
While the details of how the bond purchases would be funded were not initially known, creating a flurry of speculation over whether they would involve debt monetization, Bessent allayed those concerns by clarifying that the purchases would be made using funds already in the Treasury General Account (TGA), which currently holds roughly $950 billion. The TGA is essentially the government’s checking account, a rainy-day fund of sorts that is already funded with existing tax collections.
As a result of the clarification that the new bond-buying initiative would not amount to outright debt monetization, precious metals and commodities pulled back after their initial surge. Despite that, I strongly believe this new initiative is just a warm-up phase for a much more aggressive bond buying in the future, culminating in true yield curve control, not just in the U.S. but around the world.
I believe governments will ultimately be forced down this path by their heavy and increasingly onerous debt burdens, compounded by the alarming rise in bond yields since 2021/2022, when the inflation genie was let out of the bottle following the massive COVID pandemic-related stimulus programs, which entailed over $16 trillion in fiscal support globally. This brought an abrupt end to the multidecade period of disinflation and falling bond yields that began in the early 1980s.
In this report, I am going to make the case that genuine yield curve control is inevitable in the not-too-distant future as the global bond market continues to sink. Under this scenario, governments and central banks, including the U.S. Treasury and Federal Reserve, will target specific bond yields and buy as many bonds as necessary to prop up their prices and prevent yields from rising further. This will be massively inflationary, sending precious metals and commodities soaring and providing a major source of fuel for the commodities supercycle I have been frequently discussing.
To start, let’s take a look at the long-term chart of the 30-year U.S. Treasury bond yield to put its recent rise into perspective. Keep in mind, however, that yields have been climbing across the entire yield curve, including shorter maturities such as the 10-, 5-, and 2-year Treasury notes, as well as throughout the broader credit markets, including corporate and municipal bonds. And this is not just a U.S. phenomenon, as bond yields have been rising around the world.
From the early 1980s until 2022, bond yields were in a secular bear market, while bond prices were in a secular bull market, thanks to the much-welcomed disinflation that followed the taming of the high inflation of the 1970s. This period, known as the Great Moderation, was also tremendously supportive of asset prices, including stocks and housing.
As a reminder, bonds are highly sensitive to inflation because it erodes the value of their fixed coupon payments. As inflation rises, bond prices fall and yields rise, while falling inflation has the opposite effect. The bond market is particularly adept at sniffing out inflationary pressures early, as sophisticated investors quickly reprice bonds at the first signs of rising inflation.
Such a large-scale repricing occurred in early 2022 as inflation surged following the trillions of dollars in COVID-19 pandemic stimulus programs. Both the 30-year and 10-year Treasury yields broke above their long-term downtrend lines (breakout #1 on the chart below), signaling the beginning of a new long-term regime of higher inflation and bond yields and bringing an abrupt end to the disinflationary era that had begun four decades earlier.
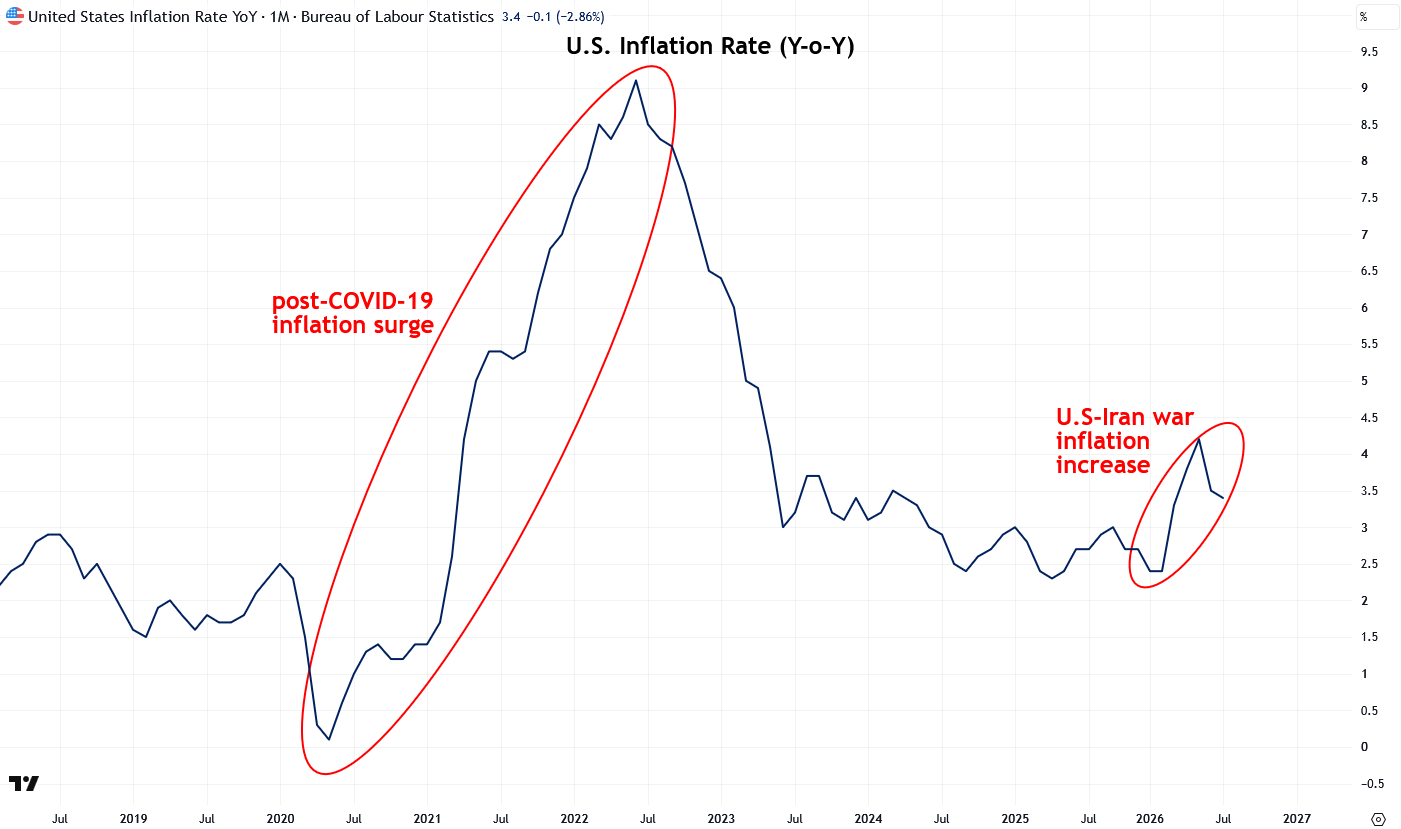
After surging from 2020 through late 2023, Treasury yields largely treaded water for the next couple of years as pandemic-related inflation cooled from its peak. Inflation nevertheless remained stubbornly high, running at a rate roughly 50% above its pre-pandemic level, though there was still optimism that both inflation and bond yields would steadily trend lower over time.
Unfortunately, that optimism was dashed in March 2026 when the U.S. and Israel declared war on Iran, which subsequently closed the Strait of Hormuz, through which 20% of global petroleum liquids flowed. This sent crude oil soaring from $67 to $120 a barrel in a matter of days and also disrupted the flow of other critical materials, including fertilizer, causing agricultural commodity prices to spike and triggering a food inflation crisis.
The resulting surge in inflation from higher energy and food prices and other supply chain disruptions, compounded by the inflationary effects of the debt-fueled artificial intelligence boom/bubble and the massive issuance of bonds by AI hyperscalers competing with the U.S. government for investor capital, has caused Treasury yields to rise sharply once again. The 30-year Treasury bond now yields 5.244%, its highest level since the spring of 2007.
From a technical perspective, the 30-year Treasury bond yield is now in the process of breaking out from the triangle consolidation pattern it has formed over the past few years, with other Treasury yields showing similar patterns. Assuming the breakout is fully confirmed, it signals another sharp rise in yields in the years ahead, potentially comparable in magnitude to the powerful upward move from 2020 through late 2023, according to the measured move principle.
President Trump, a real estate magnate with a strong preference for low interest rates, and Treasury Secretary Scott Bessent are undoubtedly keeping a concerned eye on this breakout, hence the launch of the new bond-buying initiative two weeks ago in an effort to stem the rise in yields.
So far, however, the initiative has had little effect, with yields largely shrugging it off, which I believe is a harbinger of what lies ahead: much higher yields and inflation, followed by genuine yield curve control through outright debt monetization, or essentially digital money printing. This, in turn, will exacerbate the situation and ultimately result in even higher bond yields.
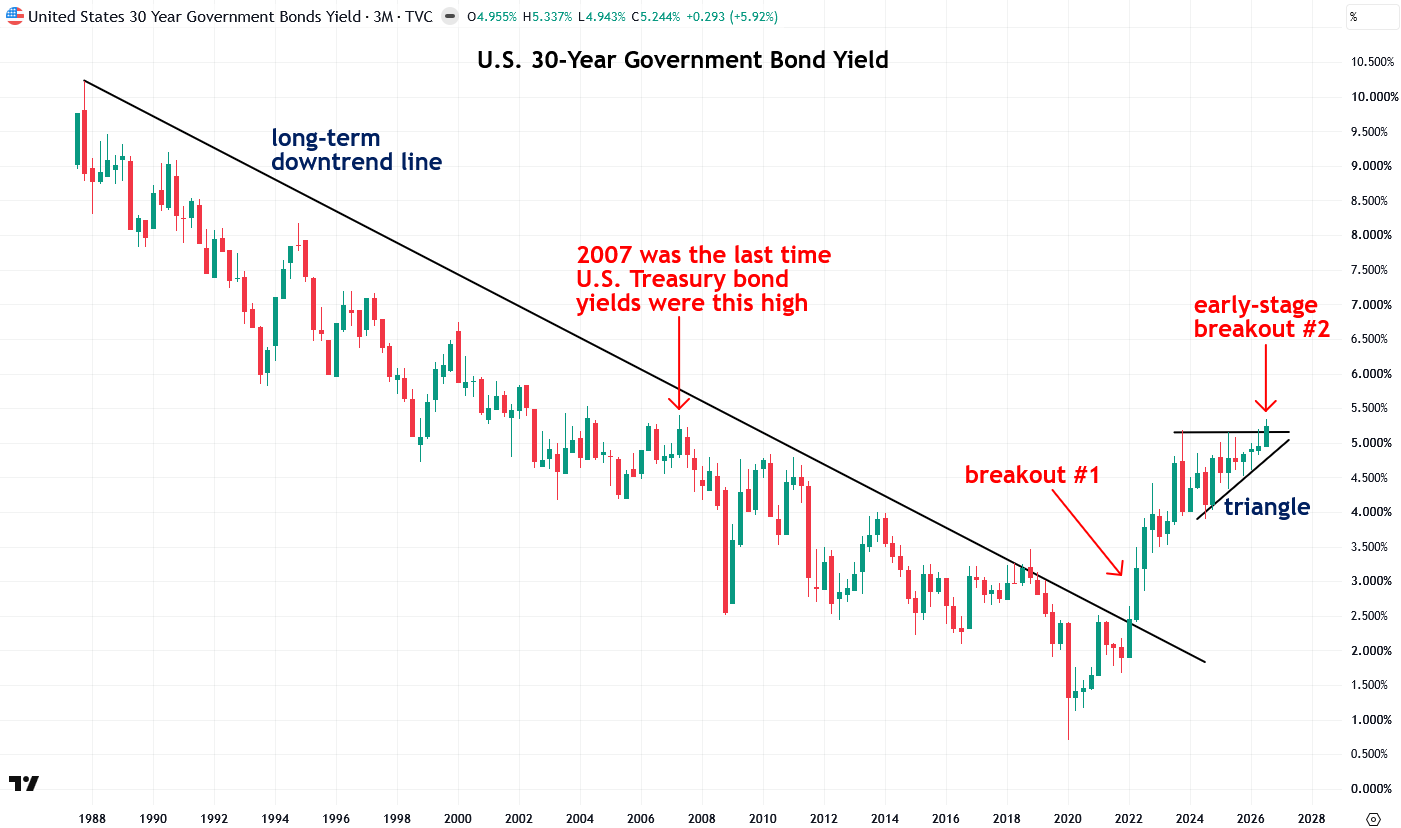
A look at the annualized U.S. inflation rate, as measured by the Consumer Price Index (CPI), shows the post-COVID-19 inflation surge that was the primary catalyst for the initial breakout in Treasury yields in 2022. It also shows the renewed rise in inflation beginning in March 2026, which is now threatening to trigger a second breakout in yields from the triangle pattern I showed in the previous chart.
And while I showed the standard CPI chart, I am well aware that it is notorious for understating inflation and that the real-world inflation rate, including when measured using older versions of the CPI, is much higher than the current official CPI indicates (click here to learn more).
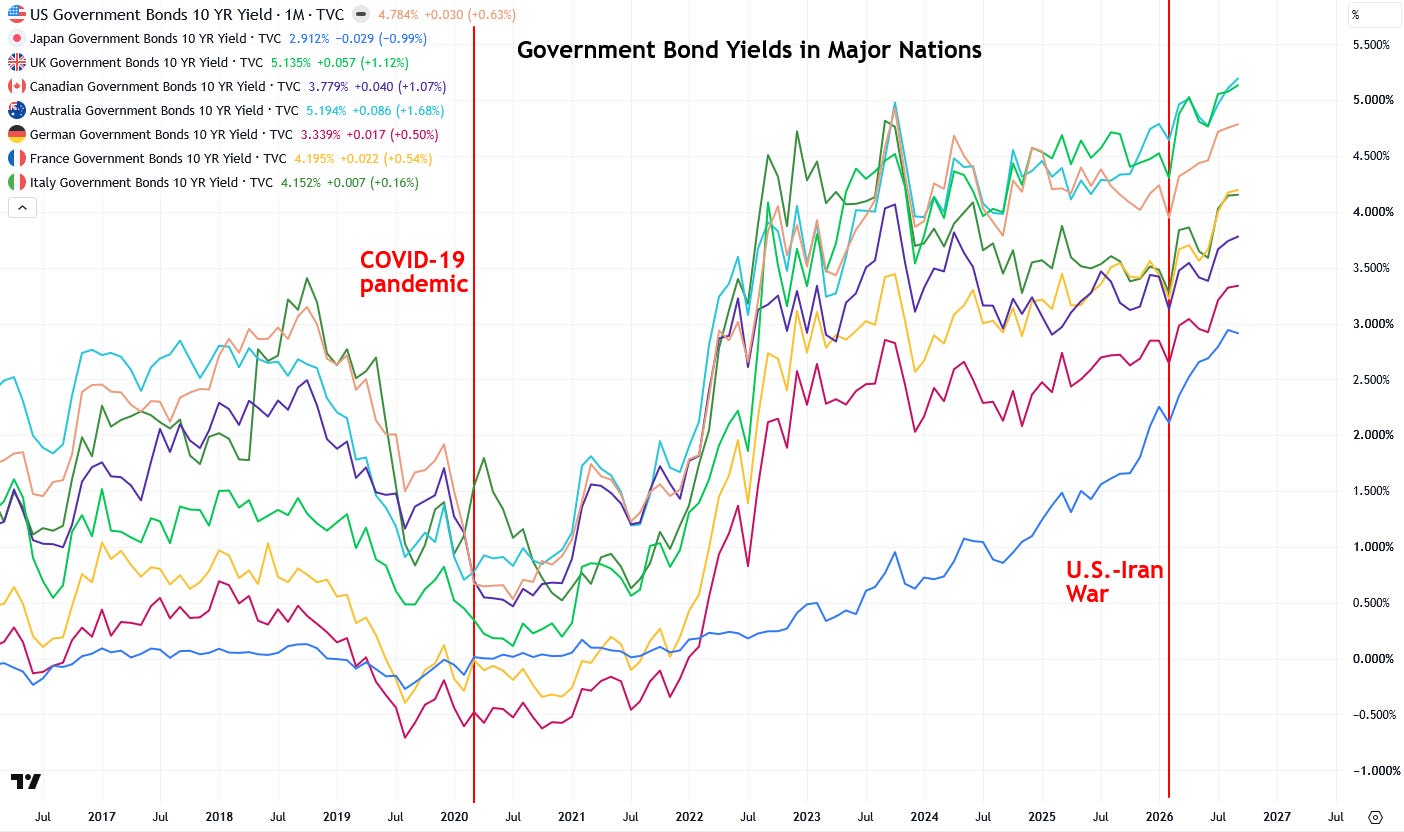
In the first chart, I showed the soaring 30-year U.S. Treasury bond yield, but I want to emphasize that this is not just a U.S. problem. It is happening in most countries around the world, all of which are struggling with higher energy and food costs that are causing their bond markets to sink.
I believe this will ultimately lead many governments to resort to yield curve control in the years ahead, further exacerbating the inflation crisis and creating an extremely bullish environment for precious metals and commodities.
Also note the two distinct waves of rising bond yields, the first following the COVID-19 pandemic and the second resulting from the U.S.-Iran war. I view these successive waves as evidence that the disinflationary Great Moderation era that began in the early 1980s has officially ended and that we have entered another inflationary era that will increasingly resemble the 1970s, characterized by sinking stock and bond prices alongside soaring commodity prices and natural resource stocks.
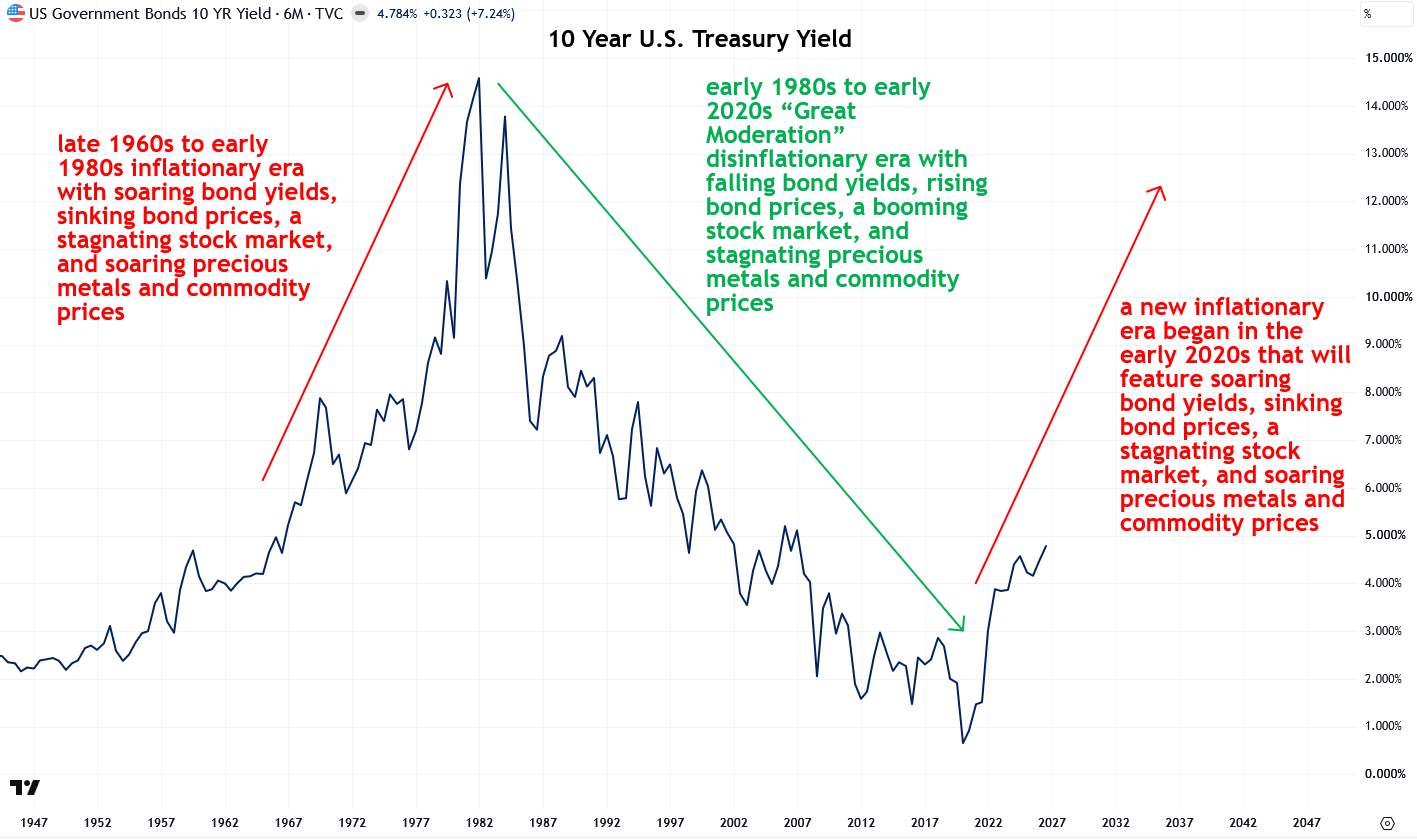
The next chart shows the 10-year U.S. Treasury note yield and its dramatic rise from the late 1960s through the early 1980s amid persistently high inflation. The surge in yields coincided with a sharp decline in the bond market, a stagnating stock market (which was actually in a bear market when adjusted for inflation), and soaring commodity and precious metals prices.
Next, we can see how the “Great Moderation” disinflationary era, which lasted from the early 1980s to the early 2020s, featured falling bond yields, rising bond prices, a booming stock market, and stagnating precious metals and commodity prices.
Finally, I strongly believe that a new inflationary era began in the early 2020s, marking the end of the Great Moderation and ushering in a redux of the inflationary era from the late 1960s through the early 1980s. I believe it will once again feature soaring bond yields, sinking bond prices, a stagnating stock market (especially in real terms), and soaring precious metals and commodity prices.
Further confirmation that we are heading into a long period of stock market stagnation comes from today’s extremely high valuations and leverage, which, not coincidentally, were also present in the late 1960s. The stock market subsequently went nowhere until 1982 in nominal terms and actually experienced a severe secular bear market when adjusted for inflation (after all, real returns are the only thing that matters).
Unfortunately, I believe the U.S. stock market will fare much worse in the decades ahead than it did in the 1970s, both in nominal and real terms, because the current market bubble blows the late 1960s “Nifty Fifty” bubble out of the water in terms of overvaluation and leverage.
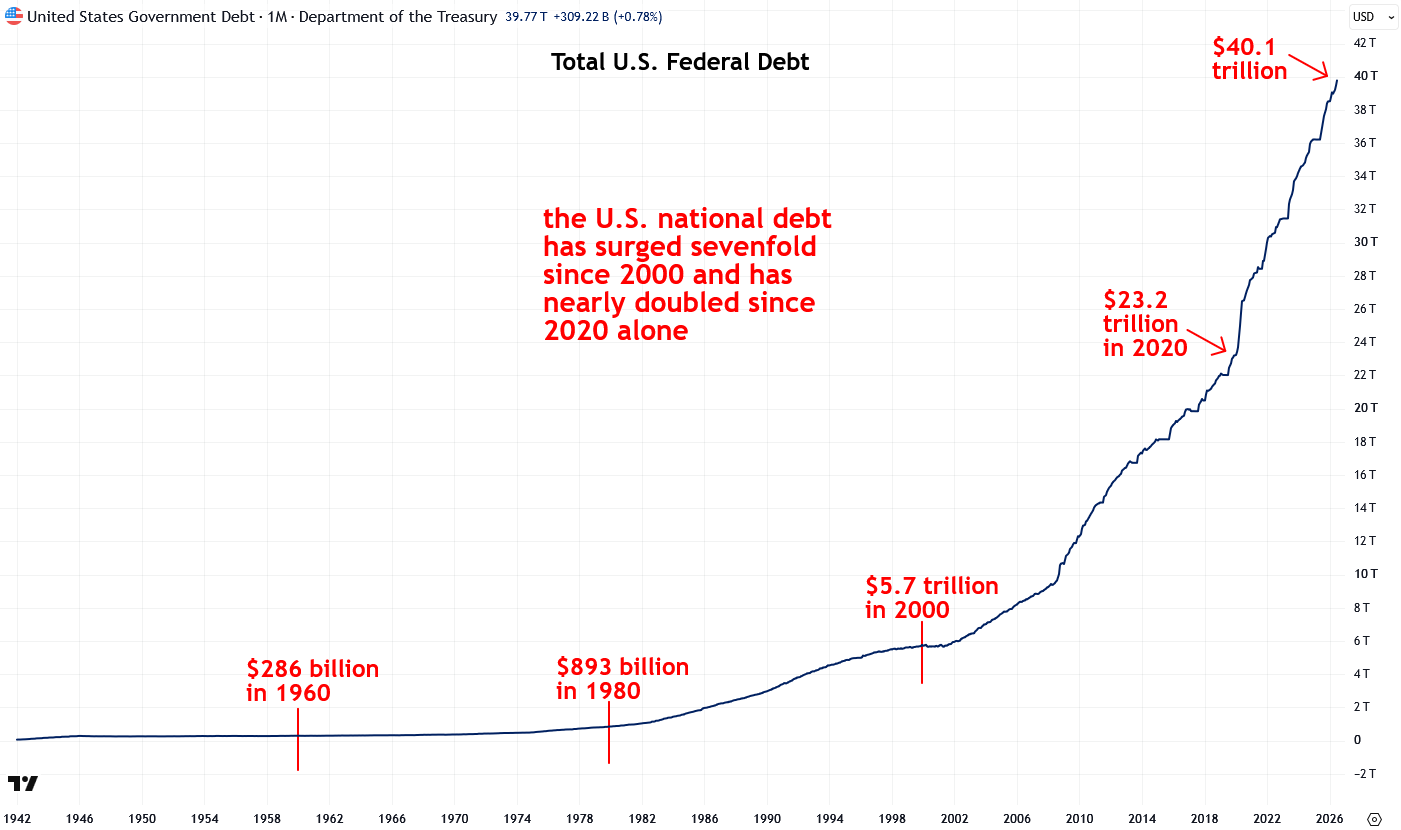
Now I want to discuss another major reason why U.S. Treasury bonds are sinking and their yields are spiking aside from inflation: the alarming explosion in the federal debt, which hit $40 trillion just a few weeks ago.
That represents a sevenfold surge since 2000 and nearly a doubling since 2020. We are talking about a roughly $17 trillion increase in just six years! If that isn’t a reason to be ultra-bullish on precious metals and buy them hand over fist, then I don’t know what is.
Conversely, I don’t know why any investor would choose to lend money to the heavily indebted U.S. government, which is essentially what buying or owning Treasuries amounts to. That is what the bond market is slowly waking up to, hence why Treasury prices are heading lower and yields higher.
I only see this trend accelerating in the years ahead as the government invariably continues to pile on debt and soon resorts to yield curve control to prevent the Treasury market from sinking even further. But that will only exacerbate the problem while providing an even greater tailwind for precious metals and commodities.
I must also point out that the official national debt doesn’t even include the additional $88 trillion in unfunded liabilities, which represent the shortfall between promised future benefits and projected future revenues. These liabilities can also be viewed as a form of debt, even though they are not owed to bond investors.
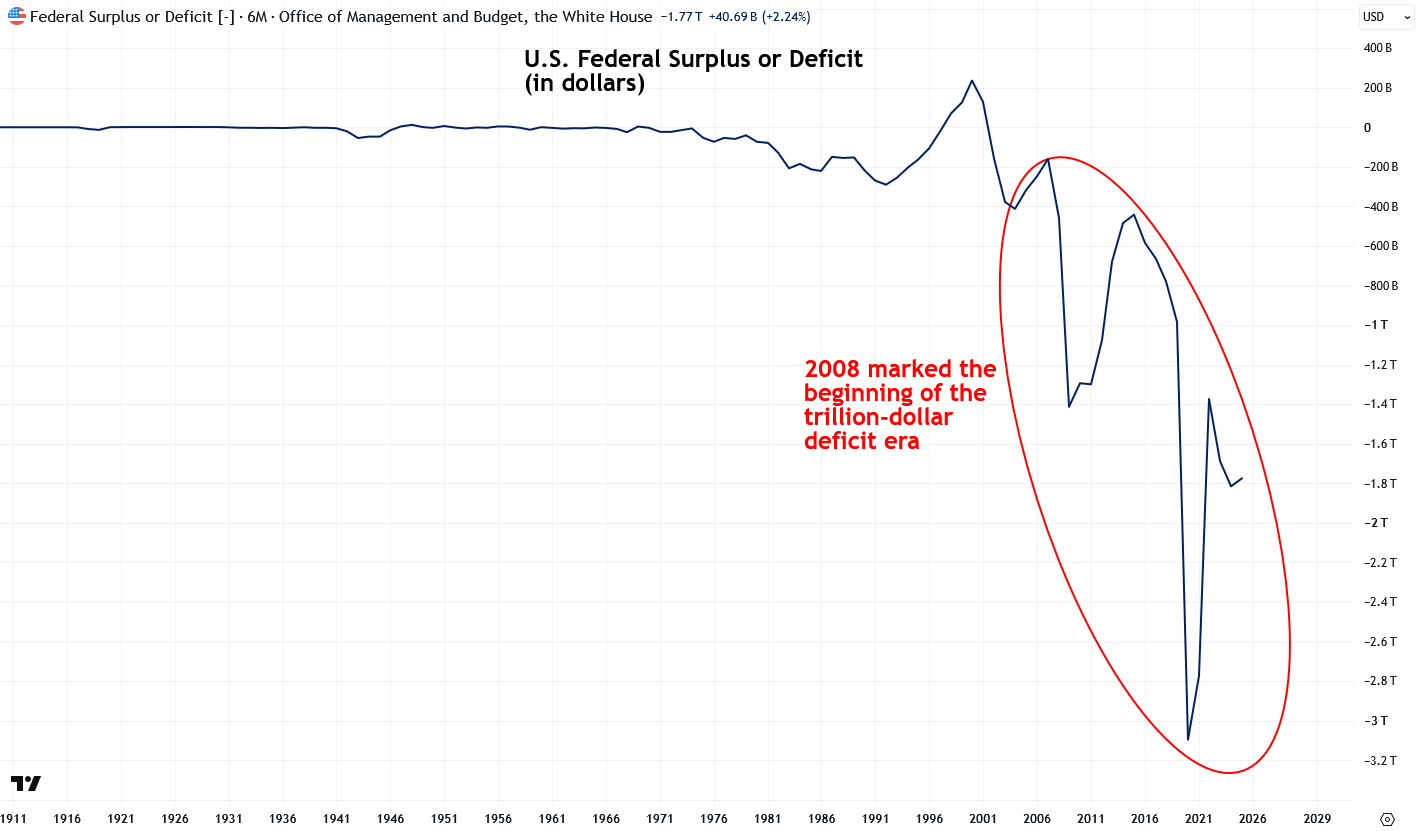
The cause of the surge in the U.S. federal, or national, debt is simple: the government is spending more than it takes in, and it is currently doing so at a rate of $1.77 trillion a year, as the chart of the federal surplus or deficit shows.
Unfortunately, it’s clear that the trillions of dollars in budget cuts Elon Musk and the Department of Government Efficiency (DOGE) promised during the early stages of the Trump 2.0 presidency never materialized.
The trillion-dollar deficit era began in 2008 during the Great Recession, and although the economy has since recovered, largely due to massive debt-driven stimulus and money printing, the U.S. government is still running multitrillion-dollar deficits.
By the way, that is a major reason why there hasn’t been a meaningful recession since 2008: debt-driven government spending is propping up the economy. But the government is simply borrowing from the future, which will ultimately cause a far greater crisis down the road, one that will not be able to be fixed with even more debt-funded spending and money printing.
The key takeaway from all of this should be to buy gold, silver, and commodities and hold tight because we are heading toward the mother of all fiscal and monetary crises.
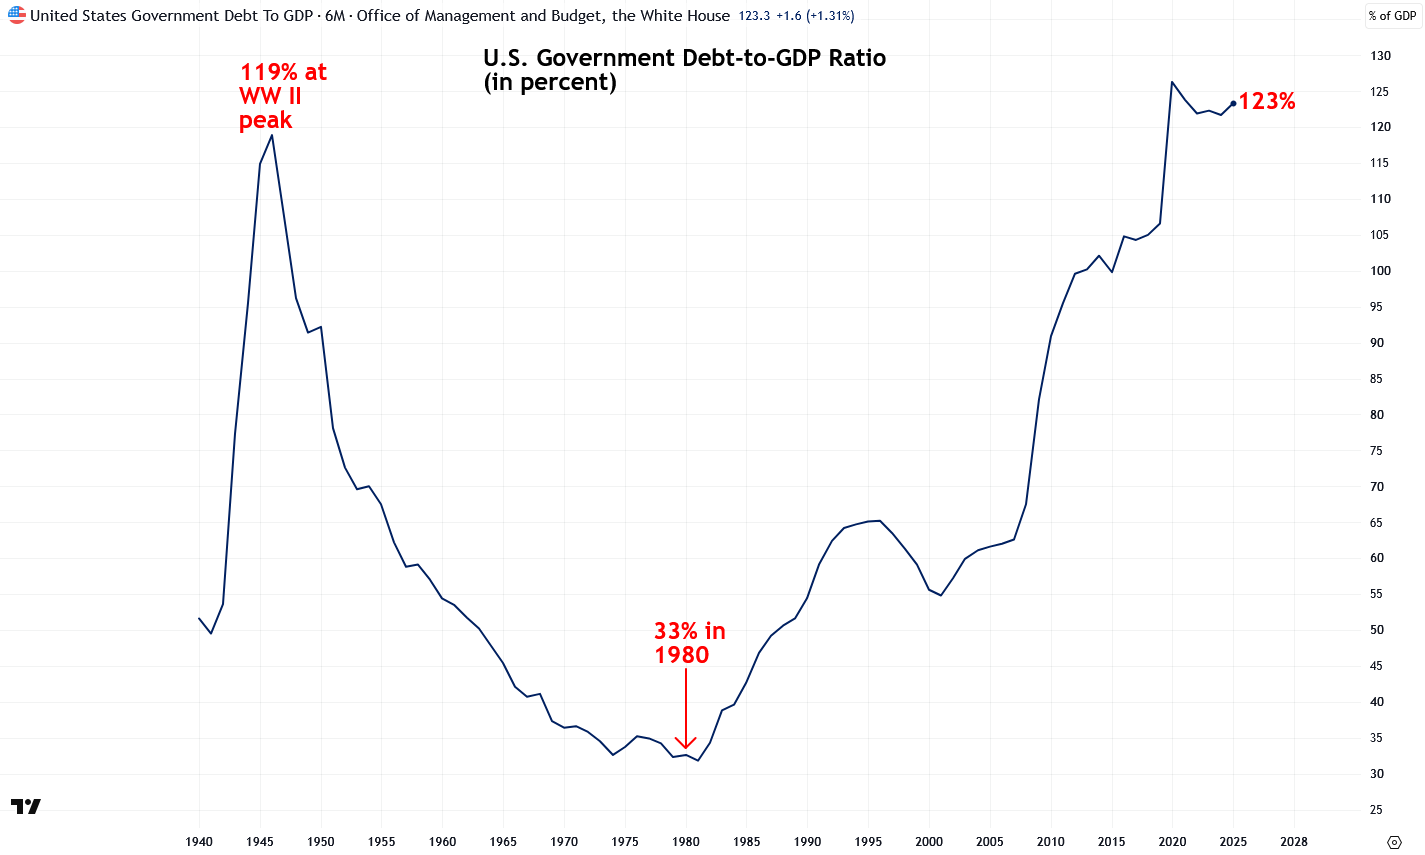
Now I’ll show the U.S. federal debt-to-GDP ratio, which is far more relevant than the raw debt chart because it reflects the true burden of that debt on the economy and society. And as you can see, not only has debt exploded, it has grown much faster than the economy itself, soaring from just 33% in 1980 to roughly 123% today.
Our current 123% federal debt-to-GDP ratio even exceeds the prior all-time high of 119% at the end of World War II, when war-related spending temporarily pushed debt to extreme levels. But I do not expect us to grow out of or pay down that debt the way we did back then.
At that time, a unprecedented baby boom drove tremendous demand for housing and goods, while Europe and Japan’s manufacturing capacity had been devastated by the war, allowing the U.S. to capture significant global market share. That combination fueled a powerful postwar economic boom that is highly unlikely to be repeated today, especially given our mature, slower-growing, heavily indebted economy and extremely low birth rate.
With our crushing debt load, our society has very little room to absorb another 2008-like financial crisis, even a garden-variety recession, or another national emergency. Our hands are increasingly tied, with far less fiscal wiggle room to launch new stimulus programs while simultaneously paying for unemployment benefits, welfare, food stamps, and other social safety nets for those financially devastated by an economic crisis.
Unfortunately, I strongly believe that we are heading for another 2008-like financial crisis, only worse, in the not-too-distant future as the massive bubbles in the U.S. stock and housing markets burst, along with the coming collapse of the debt-funded AI bubble.
Even more alarming is that the U.S. Congressional Budget Office (CBO) projects federal debt held by the public to continue soaring relative to the size of the economy over the next few decades, rising from 101% of GDP this year to 120% in 2036 and a staggering 175% by 2056.



Comments
Log in or sign up to join the conversation.