

- SPX Monitoring purposes; Sold SPX on 2/12/19 at 2744.73 gain 1.36%; long 2707.89 on 2-8-19.
- Monitoring purposes GOLD: Long GDX on 1/29/19 at 21.96.
- Long Term Trend SPX monitor purposes; Long SPX on 10-19-18 at 2767.78
(Click on image to enlarge)
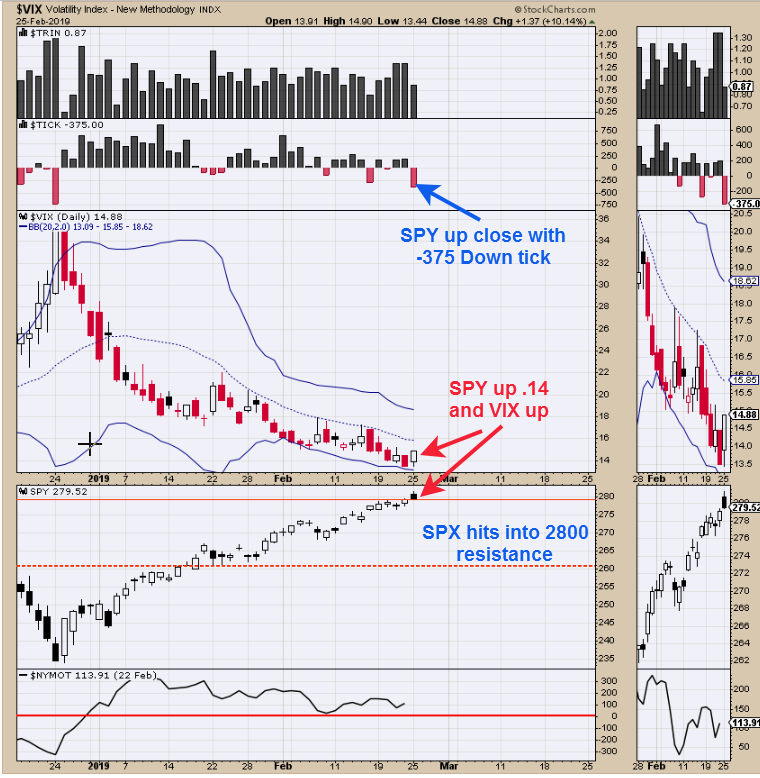
Today’s SPX high 2813.49, the previous weekly high came in December and its high was 2800.18. Last Thursday’s report said, “In most cases, the December high will be touched it not broken before a pullback or consolidation will begin. The 3 period weekly RSI sets at 89.34 and market highs usually don’t form near 90 and above suggesting this week high will be at least tested in the weeks to come.” Today the SPX ended higher by .12% and the VIX closed higher which is a short term divergence. Also the SPY up for the day with tick closing at -375 which is another divergence. Below, this report shows what the Tick is doing and right it's not showing weakness. Upside the 2800 SPX resistance and not see weakness in ticks suggesting weakness in SPX is limited. The market could flip sideways. We will wait for a clearer setup.
(Click on image to enlarge)
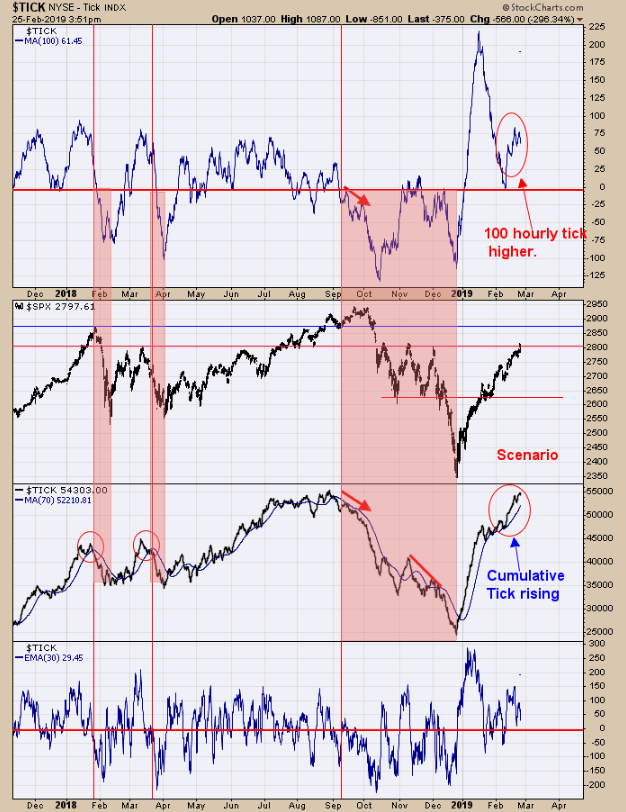
Above are several tick configurations. The top window is the 100-hour moving average of the tick. When 100 tick is above “0” than generally the SPX is moving higher and below “0” market may be moving lower. The 100 tick turned negative in early September (market topped on September 20) about two weeks before the market turned down and in general stayed below “0” until January 1 (market bottomed on December 24). Right now the 100-hour tick is setting at +61.45 and remains short term bullish. The bottom window is the 50-hour moving average and the same rules apply. This shorter term moving average also remains above “0”, though is closer to “0” and is quicker moving than the 100 hourly Tick. Next window up is the hourly Cumulative tick. The cumulative tick rises and falls as the SPX rises and falls. Over the last couple of weeks, the cumulative tick increased its angle of rising, showing strength. The SPX has reached its November, December higher near 2800 range and a resistance area. So far the different configurations of the tick are not showing weakness, this could change before the week is out.
(Click on image to enlarge)
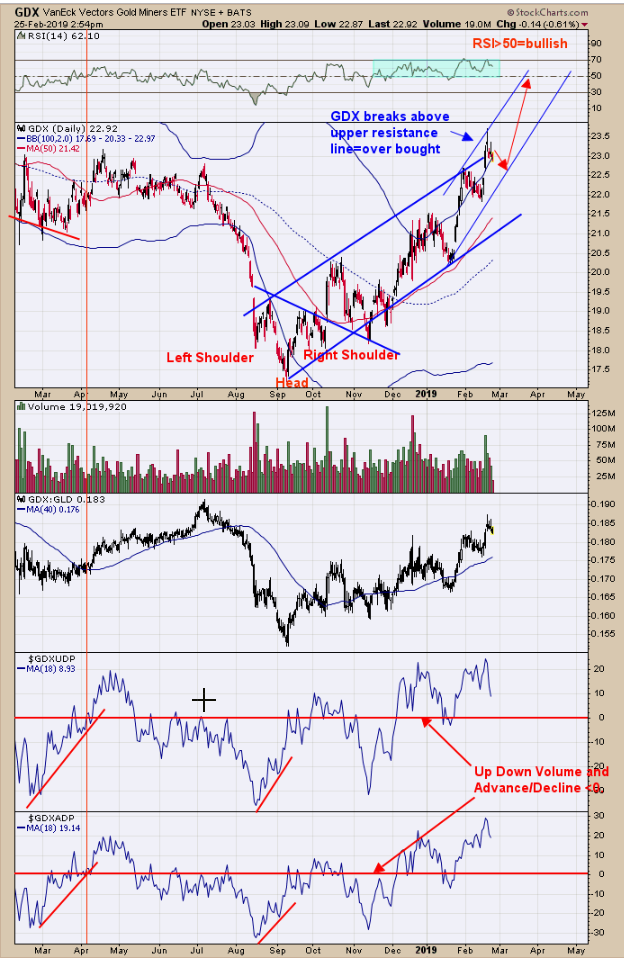
Last week GDX broke above its channel line showing market become exuberant which usually leads to consolidation. Depending on how deep the market consolidates will depend on what the market will do next. If the market holds around 22.50 range and then starts to move higher than the channel lines will shift to a steeper rise and in turn accelerate the move up. There is a resistance zone starting near 21 and running to 24 range (the 2017 consolidation zone) and that GDX needs to eat through this area with a “Sign of Strength” to confirm the major uptrend has started. Our thought is that a consolidation is starting but may be shallow and could last a month or less. Don’t think much of a pullback is in the cards here. The bottom window is the 18 periodAdvance/Decline indicator which is holding above “0” which is in bullish levels. Next window up is the 18 period Up Down volume indicator which is also above “0” and in bullish levels. If both indicators where near “0” or below, then a worthwhile pullback could materialize. The top window is the RSI and readings hitting near 70 and above are actually bullish suggesting the rally will continue after a pullback. Long GDX on 1/29/19 at 21.97.



Comments
Log in or sign up to join the conversation.