

Construction spending details are a real eye-opener.
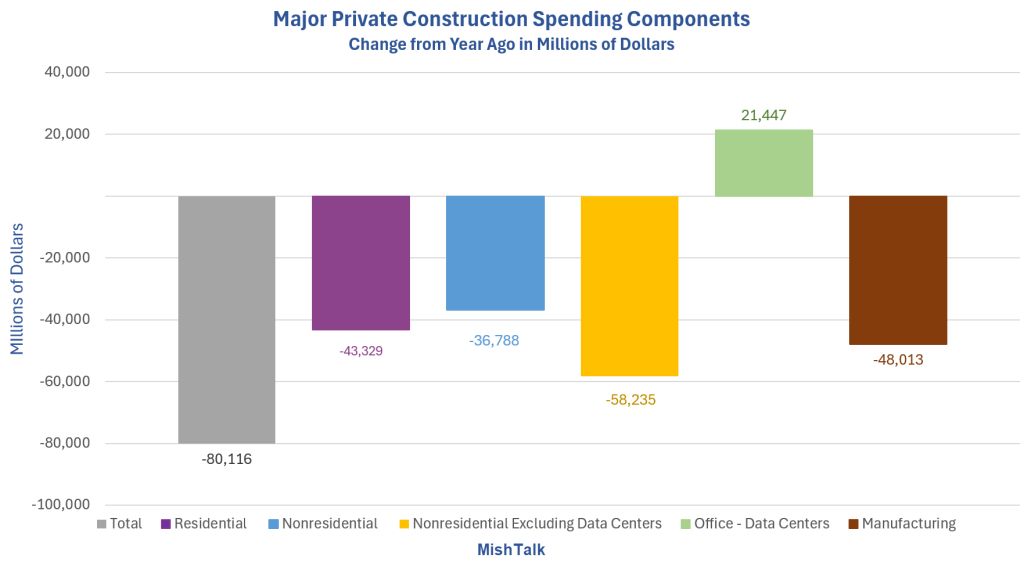
Major Construction Spending Components Year-Over-Year: Residential, Nonresidential, Manufacturing, Data Centers
Please consider the Monthly Construction Spending report from the Commerce Department for June 2026.
Total Construction
Construction spending during June 2026 was estimated at a seasonally adjusted annual rate of $2,166.5 billion, 0.1 percent (±0.8 percent) below the revised May estimate of $2,168.5 billion.
The June figure is 3.2 percent (±1.5 percent) below the June 2025 estimate of $2,237.7 billion.
During the first six months of this year, construction spending amounted to $1,046.9 billion, 3.5 percent (±1.0 percent) below the $1,084.5 billion for the same period in 2025.
Private Construction
Spending on private construction was at a seasonally adjusted annual rate of $1,622.5 billion, 0.1 percent (±0.5 percent) below the revised May estimate of $1,624.5 billion.
Residential construction was at a seasonally adjusted annual rate of $877.1 billion in June, 0.3 percent (±1.3 percent) below the revised May estimate of $879.9 billion.
Nonresidential construction was at a seasonally adjusted annual rate of $745.3 billion in June, 0.1 percent (±0.5 percent)above the revised May estimate of $744.6 billion.
Public Construction
In June, the estimated seasonally adjusted annual rate of public construction spending was $544.1 billion, virtually unchanged from (±1.6 percent) the revised May estimate of $544.0 billion.
Educational construction was at a seasonally adjusted annual rate of $113.1 billion, virtually unchanged from (±2.5 percent) the revised May estimate of $113.0 billion.
Highway construction was at a seasonally adjusted annual rate of $150.9 billion, 0.1 percent (±4.4 percent) below the revised May estimate of $151.1 billion.
The published report provides scant details on what going on. Here’s a better breakdown.
Nonresidential Private Construction Spending Change from Month Ago
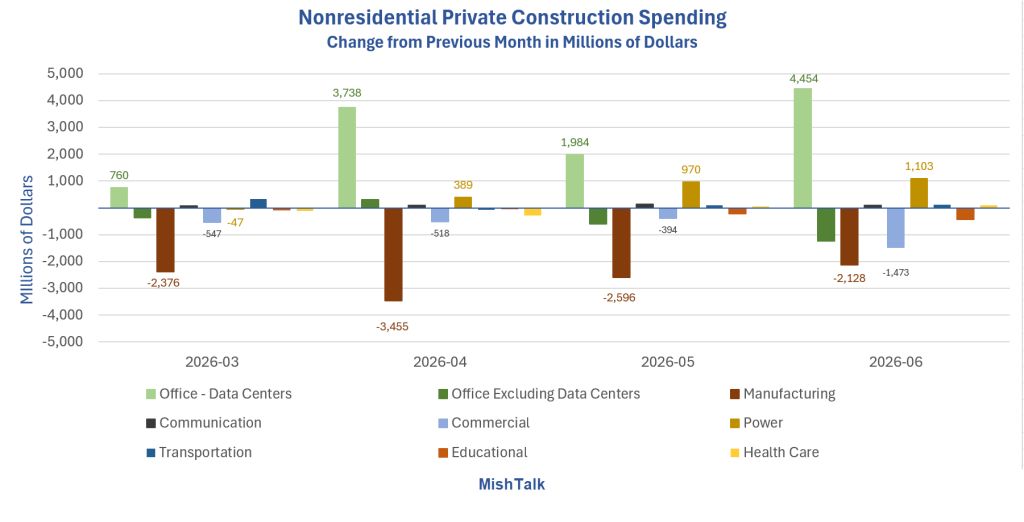
Key Nonresidential Construction Points Month-Over-Month
Construction spending has crashed except for data centers and power.
The power is needed for the data centers.
Trump’s manufacturing revival is in reverse along with commercial.
Nonresidential Private Construction Spending Change from Year Ago
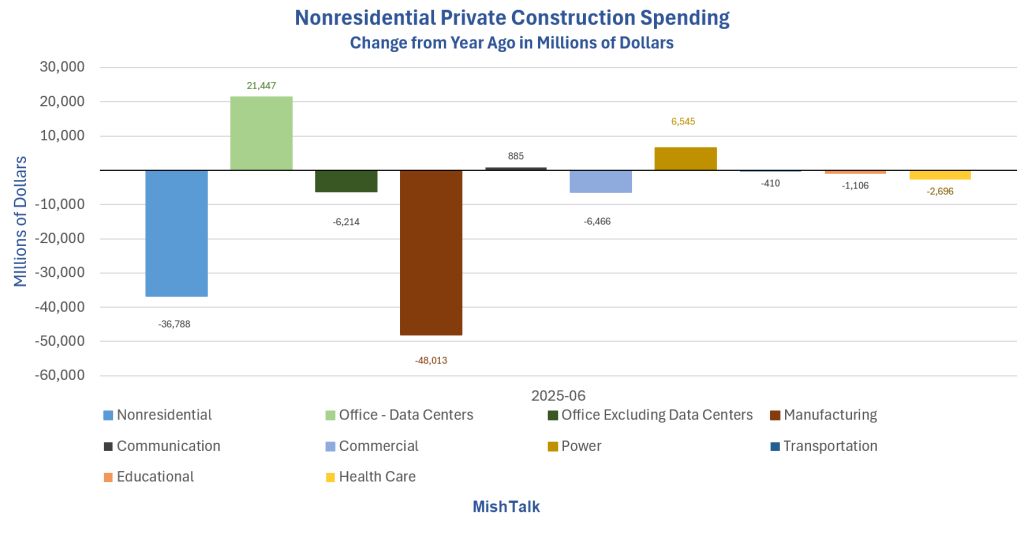
Key Nonresidential Construction Points Year-Over-Year
Nonresidential Total: -36.8 billion
Data Centers: +21.4 billion
Office Excluding Data Centers: -6.2 billion
Manufacturing: -48.0 billion
Commercial: -6.5 billion
Power: +6.5 billion
Communication: +0.9 billion
Transportation: -0.4 billion
Education -1.1 billion
Health Care -2.7 billion
Major Private Construction Spending Components change from Year Ago in Millions (lead chart details)
Key Private Construction Points Year-Over-Year
Total: -80.1 billion
Residential: -43.3 billion
Nonresidential: -38.8 billion
Manufacturing: -48.0 billion
Data Centers: +21.4 billion
Related Posts
July 31, 2026: How Much Did AI Spending Contribute to Second-Quarter 2026 GDP?
Five charts show the AI impact for every quarter starting 2025 Q1.
August 3, 2026: Copper Imports Surge the Most in 12 Years in Tariff Front-Running Move
The US copper stockpile is the biggest in history.
August 3, 2026: ISM Manufacturing Rebound Continues. Price Index is 71.1 Percent.
Employment expands for the first time in 34 months. Export orders Expand.

Comments
Log in or sign up to join the conversation.