
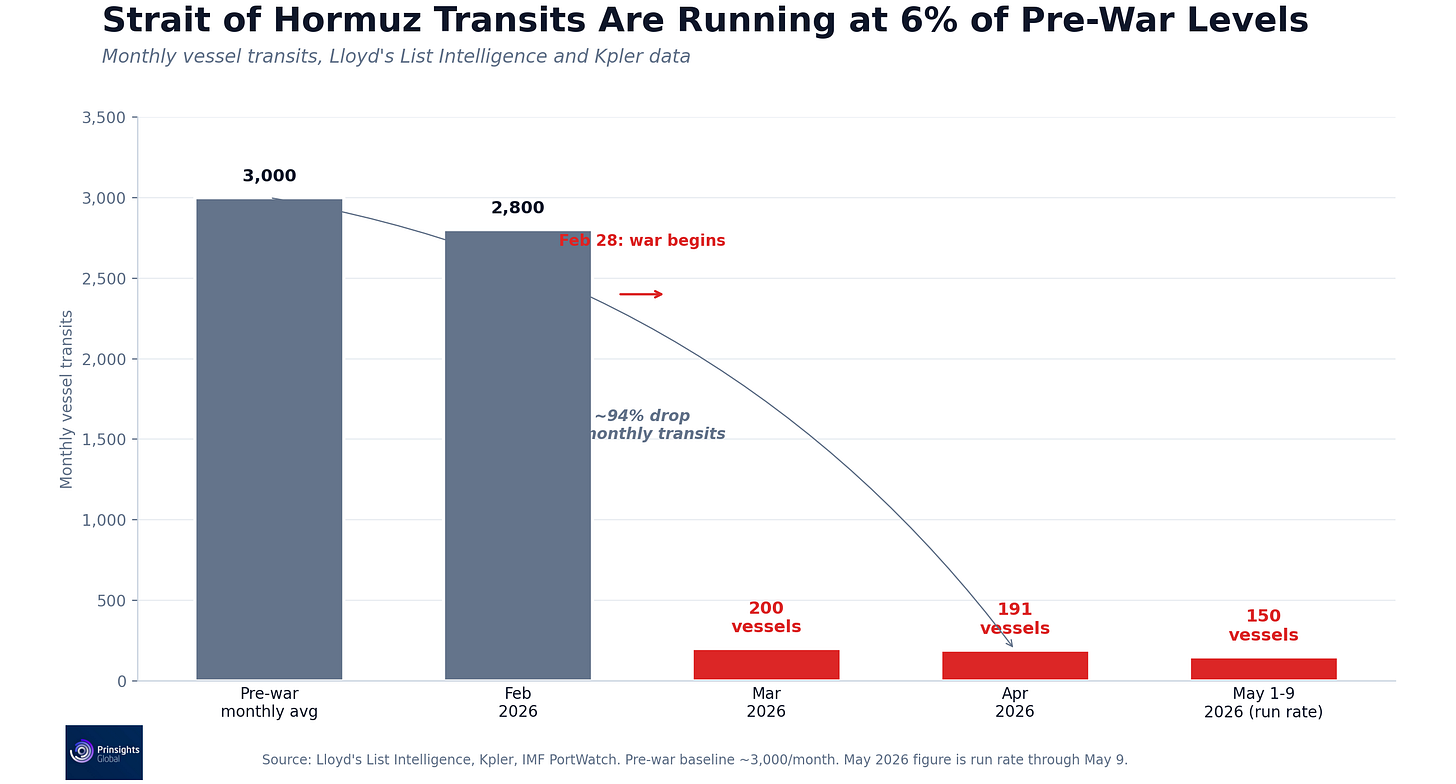
Before the war, about 130 vessels per day passed through the 21-mile wide (34 kilometers) Strait of Hormuz, with roughly 3,000 monthly. In April, only 191 vessels transited for the entire month. That’s important because, before the war, a fifth of the world’s traded oil flowed through it every single day.
Despite negotiations and ceasefire agreements, May has been running at a similar pace so far. That strait is running at roughly 6% of pre-war traffic on alternate routing through Iranian territorial waters past Larak Island, with a so-called danger zone marked over what was previously the official International Maritime Organization shipping lane.
Who Has Been Getting Through and Who Has Not
Iran’s Islamic Revolutionary Guard Corps (IRGC) has issued “passes” on the basis of a national flag and its geo-political alignment. By late March, ships owned by China, Russia, India, Iraq, and Pakistan had been approved, with Malaysia and Thailand added later.
On May 5, Iran created the Persian Gulf Strait Authority, which now requires every transiting vessel to file a 40-question information declaration before entry, with payments assessed up to $2 million per ship and offered in Chinese yuan.
Ships flying U.S., UK, Israeli, or other Western-allied flags are still denied passage outside of escorted military operations. Lloyd’s List, a marquee maritime research firm, tracked just 40 ships crossing the strait in the entire week ending May 3, in contrast to pre-war traffic of 120 to 140 daily transits.
The German-based, Hapag-Lloyd, one of the world’s largest container shipping companies, said its risk assessment remains unchanged and transit through the strait remains largely impossible for its ships.
Where the Squeeze Is Hitting Hardest
That’s the public math. Yet, under the surface, China has been hit even harder than its public posture suggests. Chinese imports through the strait fell from 4.45 million barrels of oil per day before the war to about 222,000 barrels per day in April, a drop of 95%. India fell from 2.8 million to 247,000.
Both Asian superpowers are now competing intensely for Russian crude as a potential alternative to make up the difference. ZPC, the largest single-site refinery in China, has had to move up its scheduled Q2 maintenance to March because its Saudi term-contract barrels are not arriving.
What is actually moving through the Strait of Hormuz is a mix of Iranian and Chinese-owned tankers running their own routes under IRGC permission, and sanctioned tankers loading at Iranian ports in defiance of the prevailing U.S. blockade. Lloyd’s List Intelligence has tracked at least 26 Iranian shadow-fleet vessels bypassing the U.S. blockade since it took effect on April 13. Iranian floating storage, oil sitting in tankers anchored at sea because there is nowhere to deliver it, is at about 65 to 75 million barrels.
As of late April, roughly 1,000 ships were in a holding pattern. War-risk insurance was effectively withdrawn by major P&I clubs in early March and those cancellations remain in place. Lloyd’s hull war market remains open, but premiums sit at roughly eight times pre-war levels, with U.S., UK, and Israeli-linked vessels quoted at multiples of that.
Why Reopening Will Be Slow
On May 3, Trump launched Project Freedom, a U.S. naval initiative to escort merchant ships through the strait. The operation lasted 48 hours before he paused it on May 6, citing diplomatic progress with Iran. Only two ships were able to make it through.
On May 7, three U.S. destroyers came under Iranian missile and drone fire while transiting the strait. The U.S. struck back, signaling that progress toward peace remains volatile at best. As of this writing, talks between Iran and the U.S. remain unresolved at best, and on the brink at the worst.
Even if a deal is signed tomorrow, the path back to normal commercial traffic is months long at best. The U.S. has said clearing Iranian mines, planted since the conflict began, will take six months even after a ceasefire, and Iran has reportedly lost track of how many were deployed into the shipping lanes.
The International Energy Agency (IEA) estimates that exports would take at least two months to stabilize once the strait fully reopens. Ultimately, any reopening, regardless of when it comes, will be partial and fragile.
The global fleet of compliant Very Large Crude Carriers (VLCC), the tankers that can carry oil for any major Western trading house, was already small and shrinking before the war. Tankers International notes that nearly 20% of the fleet is now 20 years or older. Forty new VLCCs are scheduled for delivery in 2026, but Tankers International projects effective fleet growth at below 3% over the next 3 years against a nominal 8%.
Where the Cash Flow Is Going
The freight market reflects all of this. The Baltic Exchange’s most recent weekly assessment, dated May 1, put the Middle East Gulf to China VLCC index (TD3C) at $407,437 per day TCE, more than three times the 2025 average of $133,000 per day. Industry breakeven on these ships sits closer to $20,000 per day. While the peak rates have come down, they have not returned to anything resembling normal.
Charterers have also been locking in one-year time charters at record levels rather than running the risk of waiting for spot rates to fall. DHT fixed its Redwood at $105,000 per day in February. Splash247, a maritime reporting outlet has detailed that one-year charter rates were above $130,000 per day in early March.
Those rates tell us that the major oil traders signing the contracts do not believe rates will revert to normal in the next 12 months. With that, strategic investors can position themselves accordingly.
What often gets lost in the headlines is who captures the most upside from this chaos. Ultimately, the owners of the compliant tankers themselves will have a direct advantage. A small subset of those are publicly listed and returning their cash earnings as dividends – and they have already booked their second-quarter earnings at multiples of breakeven.
As we send this out, Brent is trading in the $100-110 per barrel range. The overall environment shows that the freight market rates have not dropped in kind and charterers are pricing in a multi-months-long disruption tail. All of that tells us more about the associated commodity supply chain cost of this war than political soundbites do.
The reality is that the strait will reopen at some point, albeit slowly. But future cash flow from the disruption is already contracted. This matters now. In the May Founders+ issue, which drops tomorrow, we’re diving deep into a key opportunity to share with members! In it we identify the U.S.-listed VLCC owner best positioned to capture this dislocation.

Comments
Log in or sign up to join the conversation.