


As expected, stocks started last week on a bullish foot, bouncing back from the prior week’s second consecutive setback. As feared, though, it wasn’t meant to last. Alphabet (GOOGL)’s post-earnings loss on Thursday tipped the market back in a bearish direction. It Friday’s calculated selloff, however, that’s the big concern now. Nothing really prompted it. As was noted, it was a calculated decision. Traders just wanted out heading into the weekend, perhaps indicating more actionable worry.
That being said, it was the severity and shape of Friday’s selling that sets the stage for another rebound effort this week. Like the last one though, don’t respond to it too quickly. Stocks still have much to prove before we can trust them enough to start buying them again.
We’ll analyze the action below, as always. First (also as always), let’s look at the economic reports that did and will do some of the stock market’s driving.
Economic Data Analysis
Last week’s big news was of course Wednesday’s decision from the Federal Reserve regarding the Fed Funds Rate. That wasn’t the only data worth a look released last week, however. The party actually started on Tuesday, with an update of home prices for August. Although the FHFA Home Price Index edged a little higher, the Case-Shiller 20-City Index made another measurable dip.
Home Price Index Charts
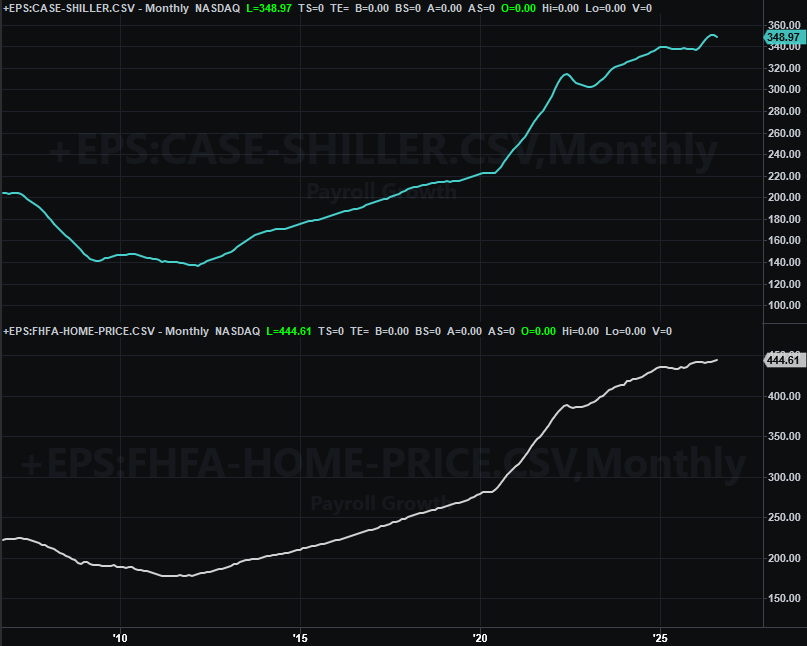
This makes some sense though. The Case-Shiller Index primarily look at housing in more metropolitan markets, which may be facing more of a headwind that the country as a whole, which includes more rural markets where prices never quite soared.
Wednesday’s other big news was the sentiment date from the Conference Board. Although not yet updated on the chart below, it shot back up to 91.7 in October. That’s still not enough to turn the bigger, longer-term tide though. Also remember that the University of Michigan’s sentiment score for October held right around 48.0.
Consumer Sentiment Charts
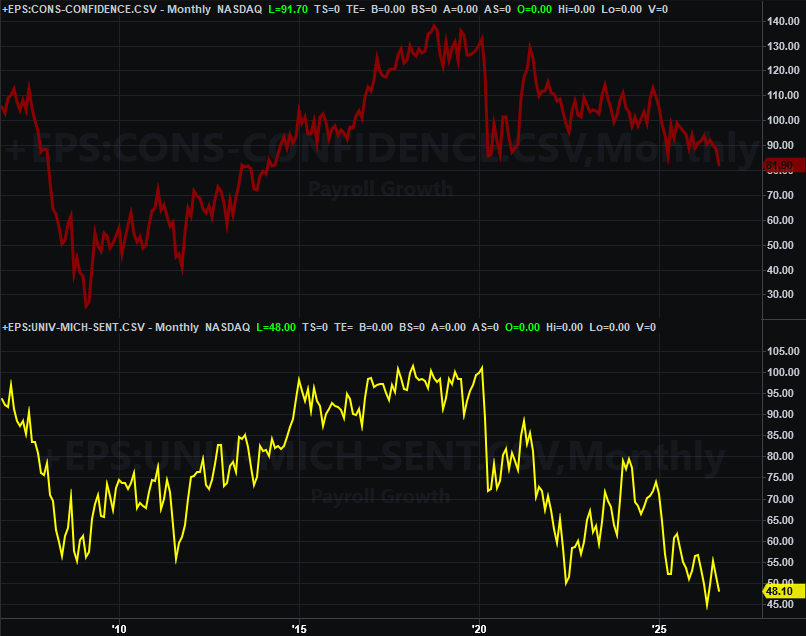
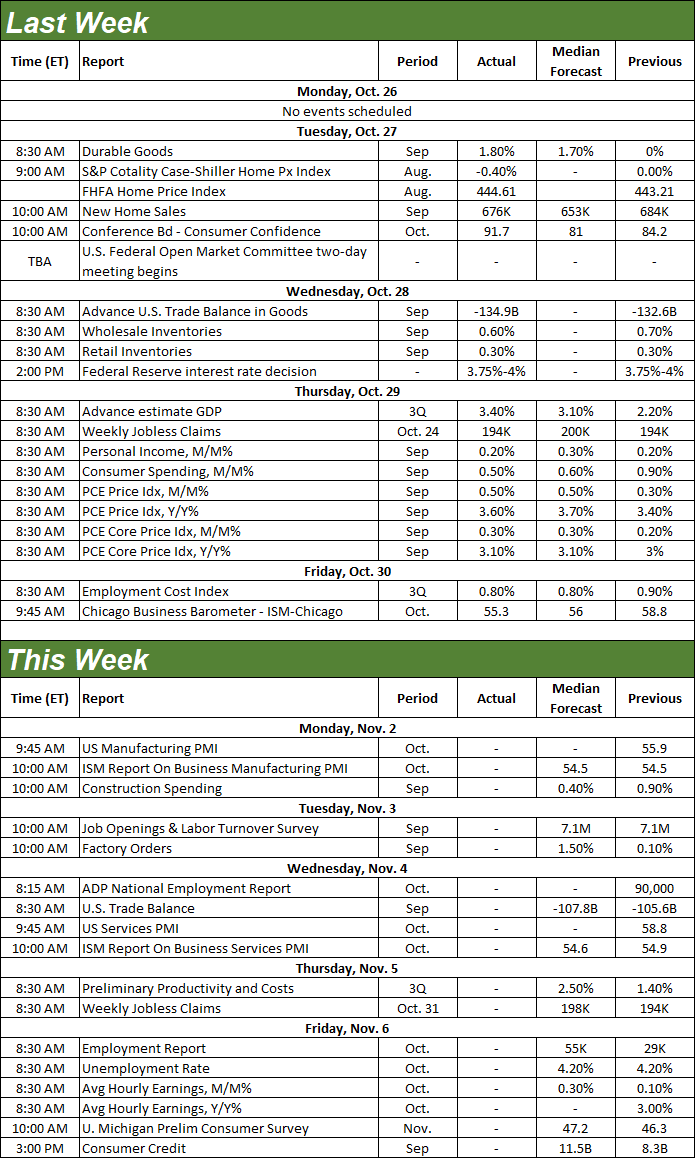
The headline was of course interest rates. As was widely expected, the FOMC kept the Fed Funds Rate target between 3.75% and 4.0%, suggesting its OK with inflation as is. But, maybe it shouldn’t be. We also learned on Thursday that above-average inflation isn’t abating. Personal income and personal spending numbers released on Thursday indicate that annualized price inflation is holding at 3.6%.
Everything else is on the grid.
Economic Data Report Calendar
Source: Briefing.com, TradeStation
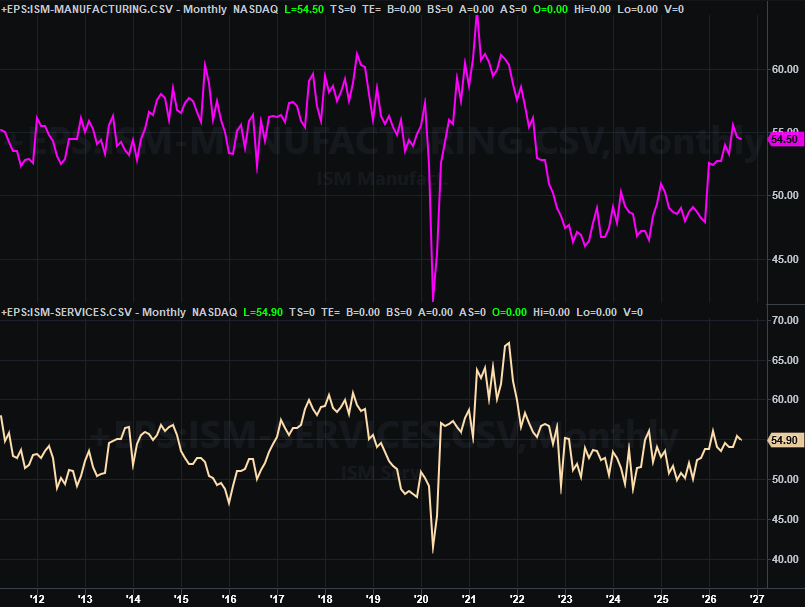
This week’s got a couple of key reports in the cards, starting with the ISM Manufacturing Index updated on Monday, with the ISM Services Index for October due on Wednesday. Economists are predicting reading that are more or less in line with September’s, both of which are still above the pivotal 50 level.
ISM Services, Manufacturing Index Charts
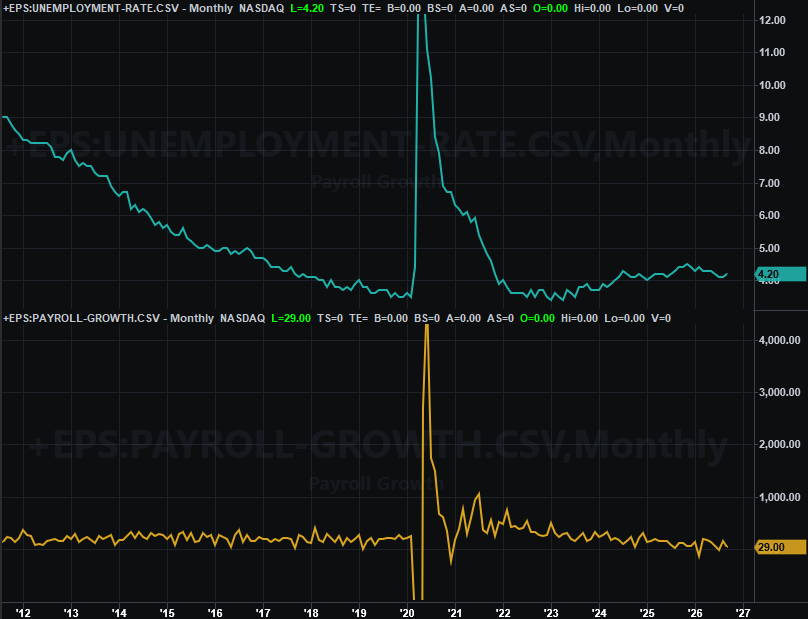
This week’s biggie is of course Friday’s jobs report. You may recall September’s disappointing payroll growth of only 29,000 jobs allowed the unemployment rate to edge a little higher to 4.2%. That one lackluster month isn’t the end of the world, but all trends start out with that first small step. Forecasts suggest slightly more job growth is in the cards this time around, although not enough to change the unemployment rate from 4.2%.
Unemployment Rate, Payroll Growth Charts
Stock Market Index Analysis
In a perfect world, the market ebbs and flows in at least somewhat predictable ways, starting with a buildup of momentum that either eventually turns around, or stops and reverses with a decisive jolt.
We don’t trade in such a world though. Stocks jump around, often unpredictably, creating doubt (and certainty) that only adds to the volatility.
And yet, somehow it all still makes sense.
That’s a reality we were reminded of last week, as the daily chart of the S&P 500 below shows us. The slowdown that we saw as we approached the 20-day moving average line (blue) as well as the somewhat-broken resistance line (purple, dashed) that connects most of the key highs since August makes enough technical sense, especially given the Fed’s decision and commentary on Wednesday, and Alphabet’s setback on Thursday. What’s odd is the size of Friday’s stumble without any real catalyst. It was uncharacteristic.
S&P 500 Daily Chart, with Volume and VIX
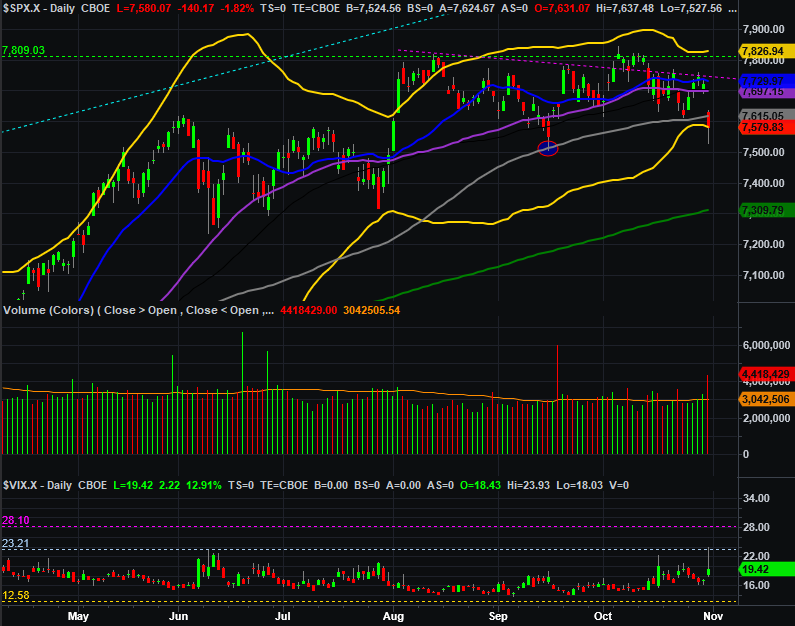
Except, much about Friday’s action does make sense, like where the S&P 500 ended up closing once the initial tumble was over. That lower Bollinger band (yellow) has been and is an important floor. Also notice that while the S&P 500’s Volatility Index (VIX) is still relatively low, it is trying to inch higher now. Its technical ceiling at 23 (light blue, dashed) once again capped its rally to send it down to a much lower close, mirror the S&P 500’s intraday swing that pared back much of its loss as of mid-day. This intraday swing, in fact, sets the stage for more bullishness early this week, following through on Friday’s late recovery. There’s certainly still room for it.
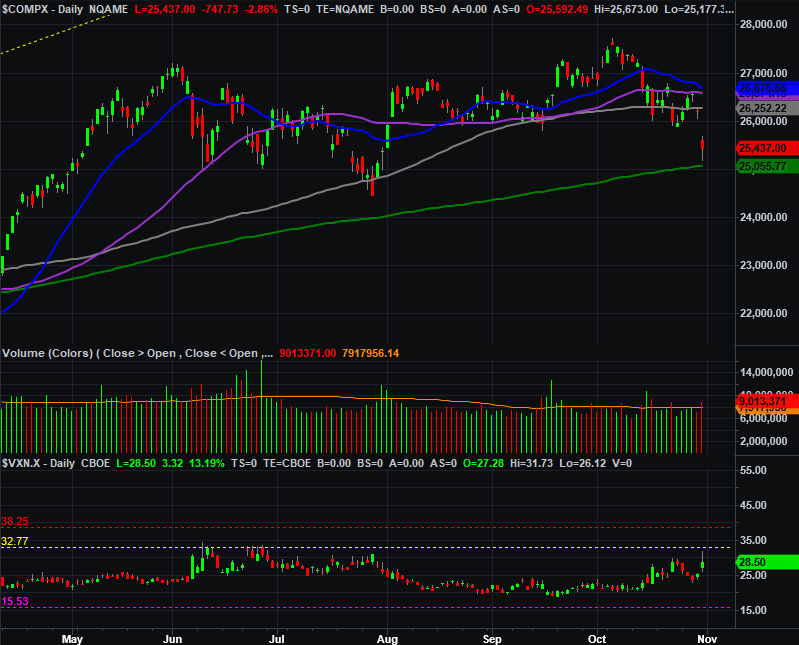
The NASDAQ Composite’s daily chart looks similar, although not identical. As you can see, it too took at beating on Friday, but made a respectable intraday turnaround effort on Friday once its 200-day moving average line (green) came into sight. Its volatility index (VXN) also seems to have peaked at an established technical ceiling (yellow, dashed) around 33, bolstering the case for a bullish reversal now.
NASDAQ Composite Daily Chart, with Volume and VXN
Here’s the weekly chart of the S&P 500 for (much) more perspective. From this vantage point you can see that the market’s been slowly trying to round or ease its way into a pullback from a while now, held under a technical resistance level at 7,793 (light blue, dashed). This timeframe and chart also makes it clear where the index should peel back to before making a healthy bottom that turns sparks a bounce. That’s the support line (red, dashed) that connects the past couple of major lows, which is about to intersect with the 200-day moving average line (green) around 7,318. This will make it an even stronger technical support level.
S&P 500 Weekly Chart, with MACD and VIX
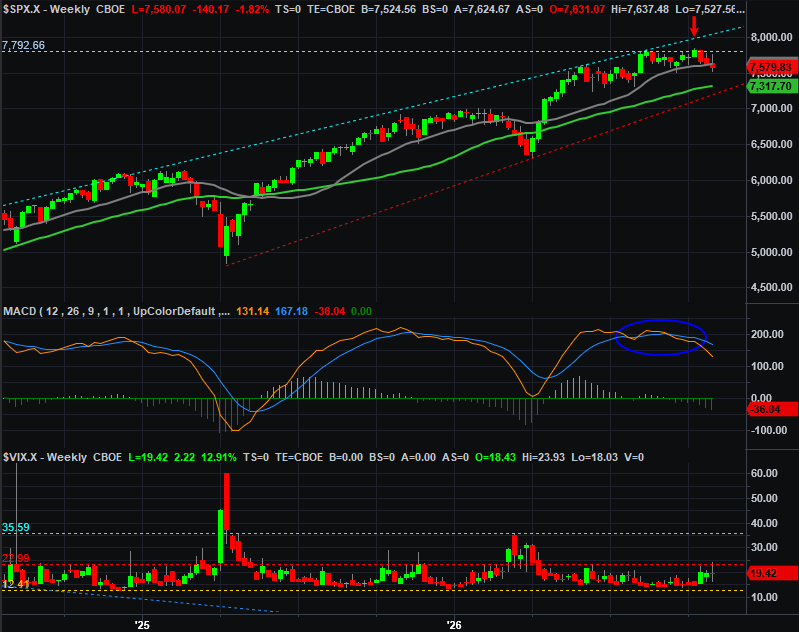
Just know that’s not exactly the ideal stopping point for any correction. That would only be about a 6% pullback from the S&P 500’s recent peak, which isn’t quite enough for a true reset. If more selling is in the cards, we can only use that 7,318 level as a first-checkpoint downside target… not that the bulls have been willing to give up any real ground of late. If the index breaks under that floor, then we’ll apply Fibonacci retracement levels (not shown) to figure out a more plausible landing point. That would probably be in the upper 6000s area. But, first things first.
The trouble with this prospect of course is that we’re now at a time of year that’s usually quite bullish. The bulls may insist on keeping the market propped up here, just on principle. There’s certainly no denying there would be some real value in a major reset at this point though… one that casts a healthy skepticism on the hottest AI technology stocks;


Comments
Log in or sign up to join the conversation.