


As feared a week ago, the market is trapped within an ever-narrowing zone between support and resistance. Although stocks lost ground last week, they held above what have become super-strong support lines. On the other hand, the indexes remain stuck under increasingly-established (and falling) resistance lines.
The good news is, the situation is going to force either the bulls or the bears into playing their hand sooner than later. Once they do, look for a long-pent-up explosive move to finally start something that’s apt to last for a while.
Ideally, the next move will be a bearish one. We’ll discuss why in a moment. First, let’s look at last week’s biggest economic news and preview this week’s, which includes an interest rate decision that just got a whole lot more interesting.
Economic Data Analysis
Not a terribly busy week last week in terms of economic news, but an important one for the foreseeable future of interest rates.
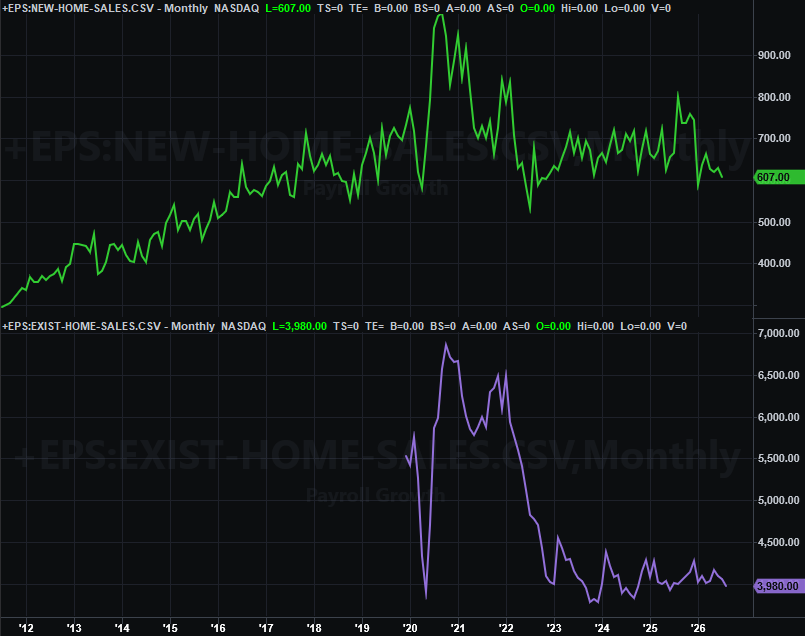
But first things first. On Thursday, we heard from the National Association of Realtors about last month’s sales of existing homes. They were down slightly from July’s annualized print, falling to a pace just under 4 million units. That’s a multiyear low, but not necessarily evidence of a new problem… just an extension of one that’s been around for a while. Also note that new-home sales were and are already low, but also inched even a little lower (again) last month.
New, Existing Home Sales Charts
Source: National Assn. Realtors, Census Bureau, TradeStation
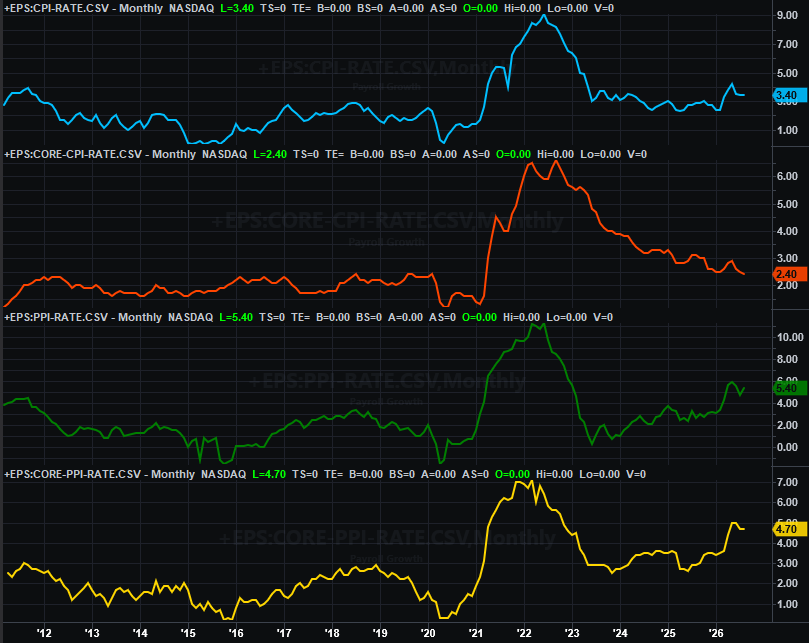
This week’s big news of course was last month’s inflation reports. There’s still plenty of it. Although core inflation edged a little lower to a multi-month low of 2.4%, the overall consumer inflation rate held steady at an above-target level of 3.4%. Producer price inflation rates are also still unusually high, and seem to fighting their way higher again.
Consumer, Producer Inflation Rate Charts
Source: Bureau of Labor Statistics, TradeStation
Yes, this relatively high inflation report pretty much forces the Federal Reserve to respond. As of Friday, the CME FedWatch report suggests there’s an 86.5% chance of a quarter-point rate hike coming this week, when the FOMC has a scheduled opportunity to impose that decision. There’s a 93% chance of a least a quarter-point increase in the Fed Funds rate by the end of October.
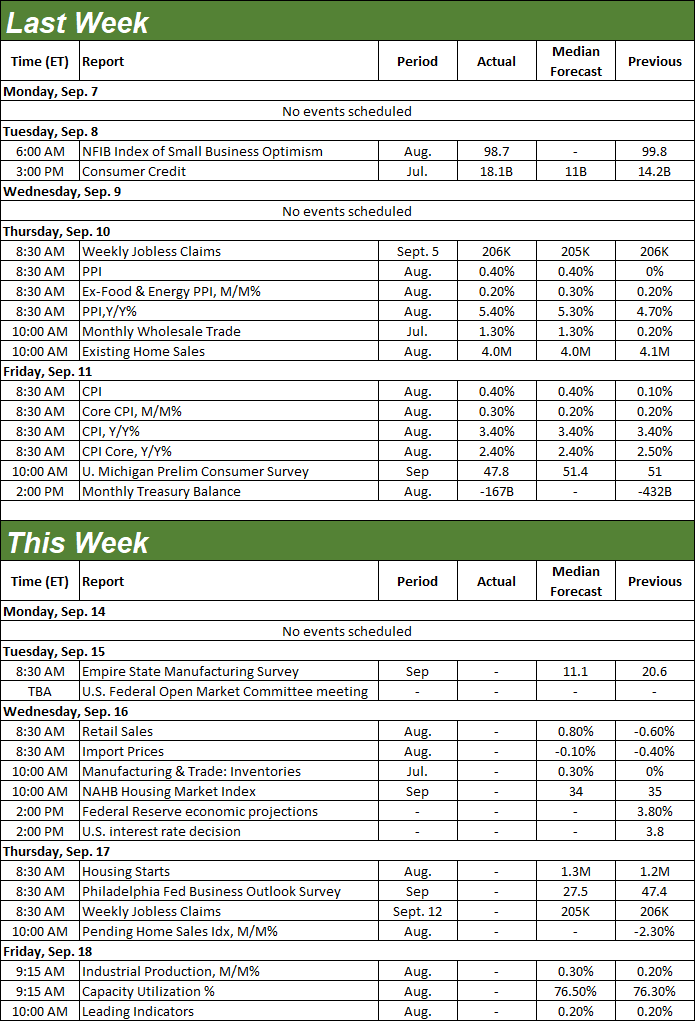
Everything else is on the grid.
Economic Data Report Calendar
Source: Briefing.com, TradeStation
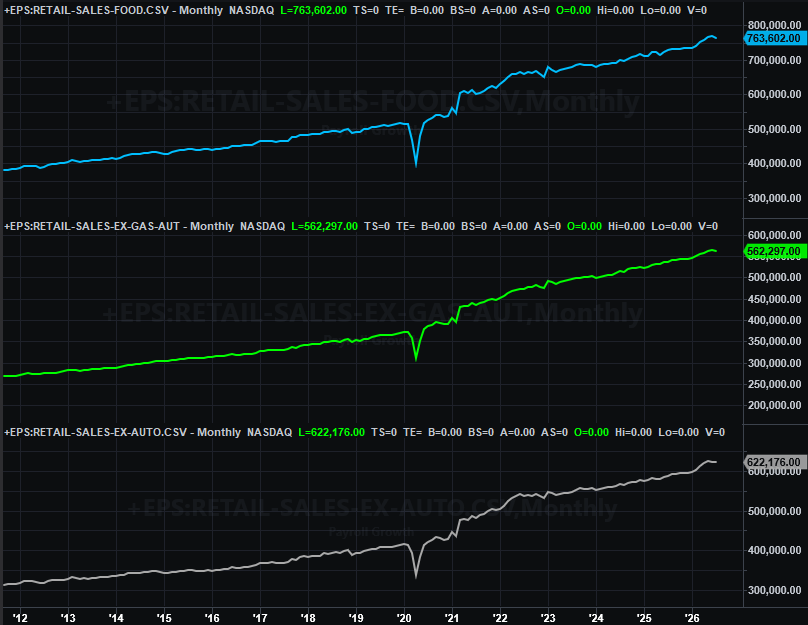
This week’s going to be fairly busy, even beyond Wednesday’s interest rate decision. That same day we’ll also hear August’s retail sales figures from the Census Bureau. Forecasts suggest a much-needed rekindling of growth following July’s dip. If we don’t get it, investors will understandably come to the conclusion that lingering inflation has finally taken too much of a toll on consumerism.
Retail Sales Charts
Source: U.S. Census Bureau, TradeStation
On Thursday we’ll get August’s housing starts and building permits, also from the Census Bureau. The former fell in July, while the latter moved a little higher. But, both remain rather anemic, with starts only expected to move slightly higher this time around. Which, makes sense, given lingering high prices and high interest rates.
Housing Starts, Building Permits Charts
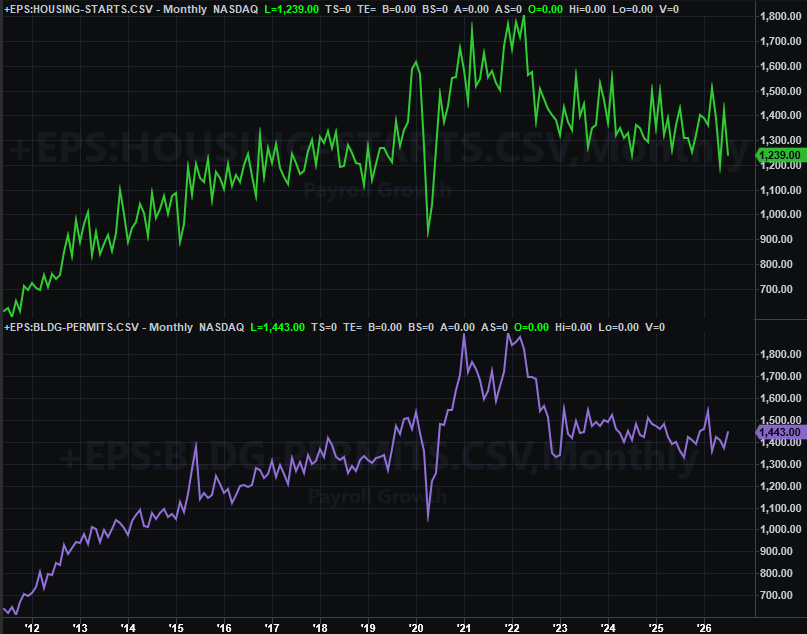
Source: U.S. Census Bureau, TradeStation
It’s not disastrous for the overall economy, but it is a drag.
Finally, on Friday look for the Federal Reserve’s look at last month’s industrial output and usage of the country’s manufacturing capacity. Economists are calling for a slight improvement on July’s figures, which had already extended a turnaround that got going early this year.
Industrial Production, Capacity Utilization Charts
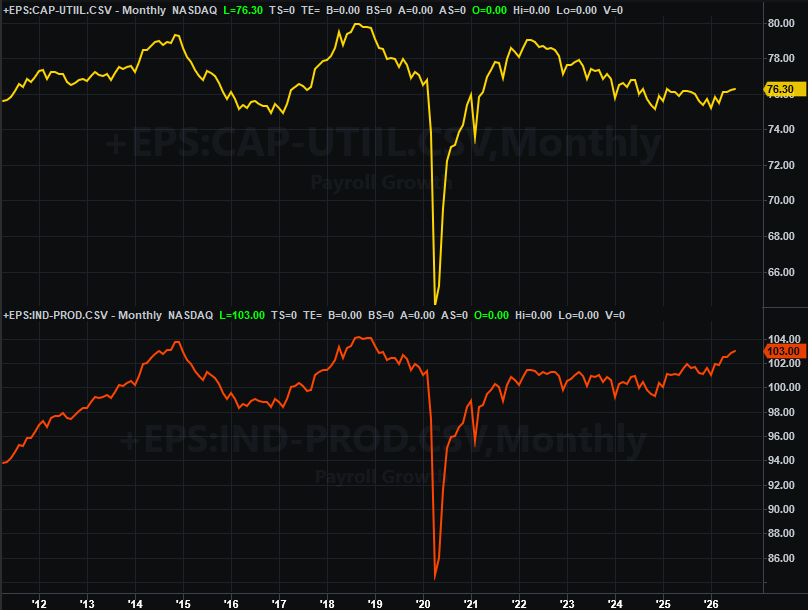
Source: U.S. Federal Reserve, TradeStation
The correlation between this data and corporate earnings and the stock market itself is pretty strong, at least in the long run. It won’t prevent short-term setbacks though. To this end….
Stock Market Index Analysis
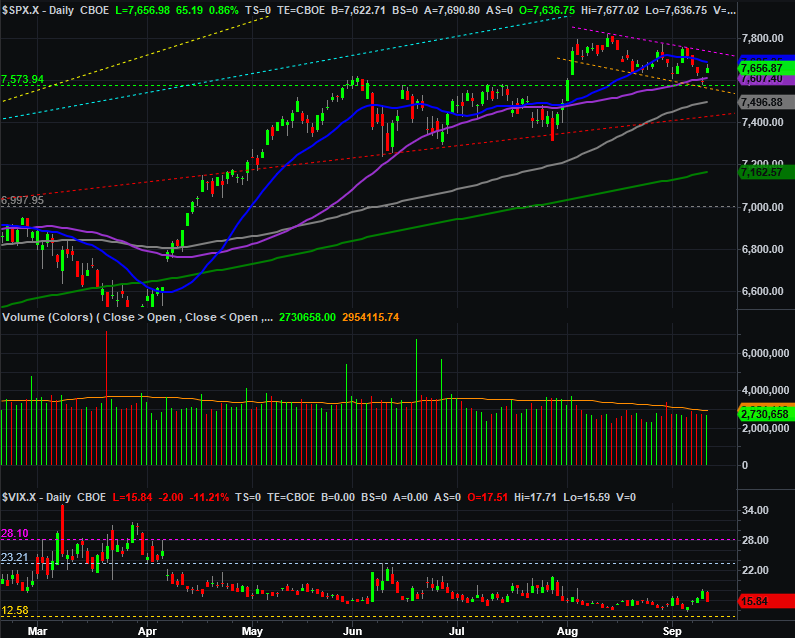
The market is trapped between a rock and a hard place. That’s what we saw starting to take shape a week ago, but it was confirmed last week. Take a look at the daily chart of the S&P 500 below to see for yourself. A falling resistance line (pink, dashed) is now in place going back to its mid-August high, but at the same time, what was previously a horizontal ceiling at 7,576 (green, dashed) seems to have turned into a ceiling; the 50-day moving average line (purple) also appears to something like support, even if not perfectly so.
S&P 500 Daily Chart, with Volume and VIX
Source: TradeNavigator
This is just an extension of the red flags, although there’s now one element to add to the matter. That’s the fact that there’s now also a falling support line (orange, dashed) that intersects with Thursday’s low. The S&P 500 is now making both lower highs and lower lows, even if there is still quite a bit of technical support below.
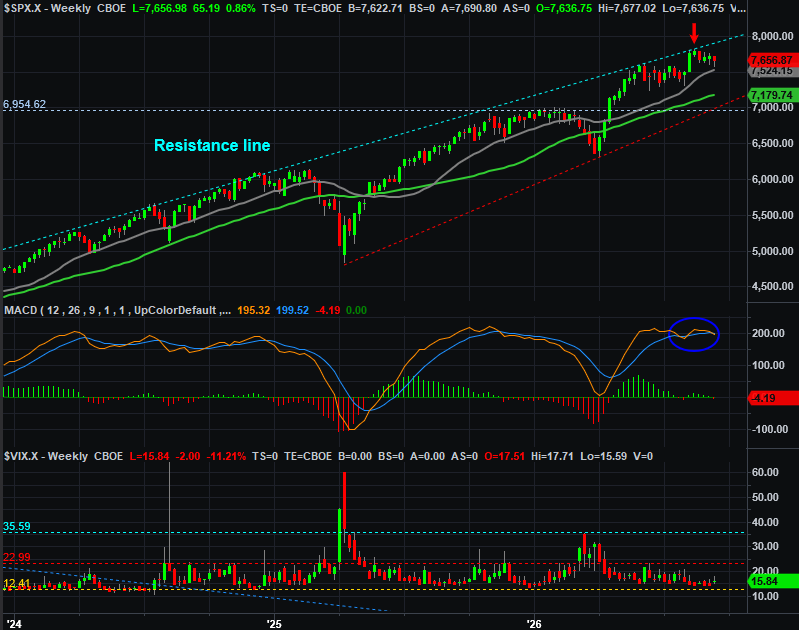
Zooming out to the weekly chart of the S&P 500 puts last week’s loss in perspective, and illustrates why we’re still anticipating a pullback even if it hasn’t started in earnest yet. The index is still dealing with its recent bump into the upper boundary of a (very) long-term technical ceiling (red arrow). This should have sent it back to the lower boundary. It obviously hasn’t yet. With a rekindled bearish MACD crossunder though, maybe we’ll get that move now.
S&P 500 Weekly Chart, with MACD and VIX
Source: TradeNavigator
And that would actually be the best thing in the long run -- for the bulls -- for a couple of related reasons.
One of those reasons is the calendar. September is usually bearish (or at least not-bullish) month that sets up the usual year-end rally. The fact that the market has already been rallying so much since April, however, doesn’t leave it a great deal more room to do so this time around. Without that pullback, the bulls may be hesitant to keep going, even into the beginning of the new year.
The other reason a pullback here and now would be a good thing in the long run is just that stocks are technically overbought and overvalued. It would be better to go through a correction when traders are expecting it and will mentally schedule an appropriate recovery than it would be to throw them a bearish curveball when they aren’t expecting it.
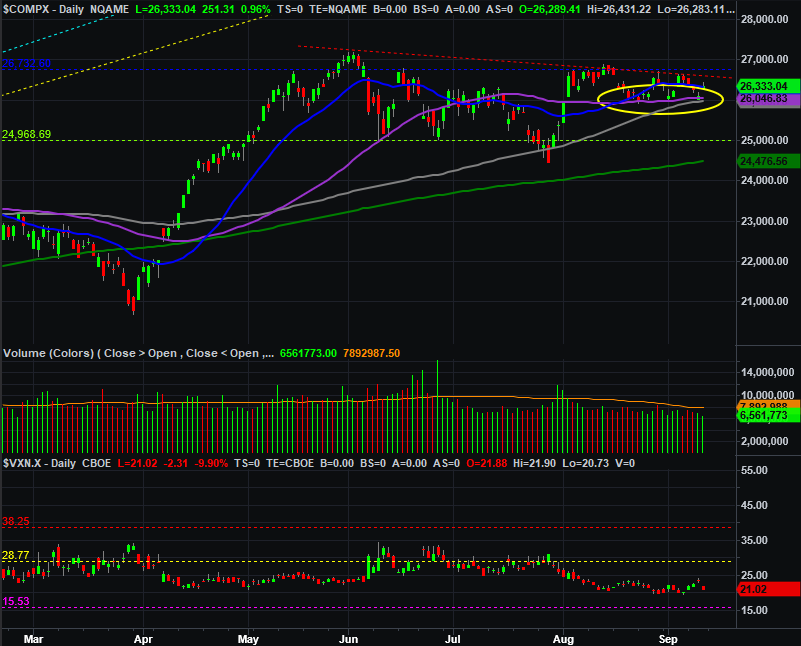
The NASDAQ Composite is in a similar situation, by the way. It’s being steered lower by a falling resistance line (red, dashed) that extends all the way back to its early-June peak. At the same time though, it’s clearly finding support at its about-to-converge 50-day (purple) and 100-day (gray) moving average lines, right around 26,000 (circled in yellow).
NASDAQ Composite Daily Chart, with Volume and VXN
Source: TradeNavigator
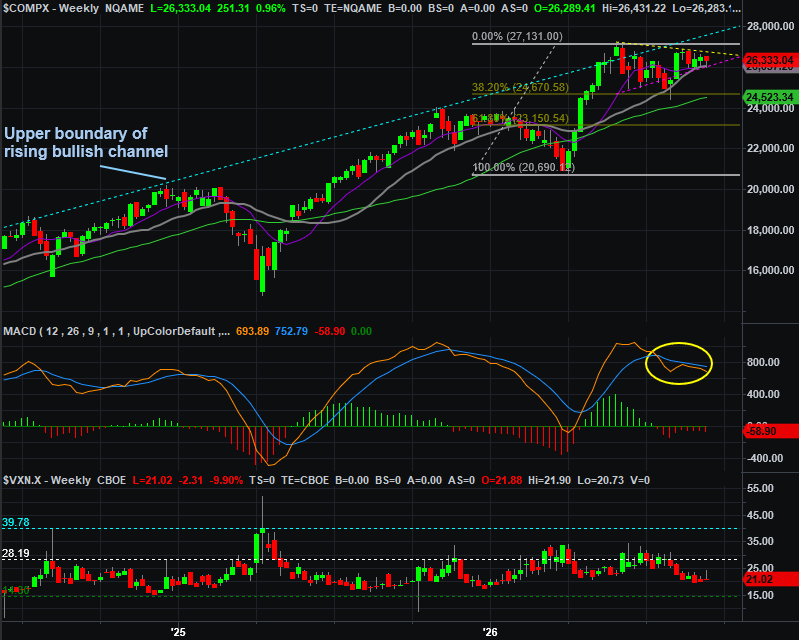
This is no small matter either. Moving average lines are always potential support and ceilings. When they converge though, they augment one another’s strength. That means the floor around 26,00 is very likely to hold up. If it does break or fail though, it’s also more likely to kickstart a relatively explosive move lower. The question then becomes where the next floor might be to catch it. The most obvious candidate is the 200-day moving average line (green) at 24,477, which by the way, is right around where the 38.2% Fibonacci retracement line (from March’s low) currently sits. That would mark roughly a 10% correction for the composite, which is an ideally-sized reset headed into the last couple months of the year.
NASDAQ Composite Weekly Chart, with MACD and VXN
Source: TradeNavigator
Just don’t jump the gun. The fact is, both indices are still quite comfortable between support and resistance. They could still be nudged out of these converging zones in either direction, even if a bullish nudge is the less likely outcome right now.



Comments
Log in or sign up to join the conversation.