
After a wobbly start, the market ended up finishing last week on a high note, moving to a record high – and record high close – by Friday. That’s the fourth winning week in a row, although of those four weeks, this was the smallest win. There was also still a suspiciously modest amount of volume behind the move.
Then there’s the other odd red flag. More on that in a moment. Let’s first work through last week’s biggest economic news and preview what’s coming this week.
Economic Data Analysis
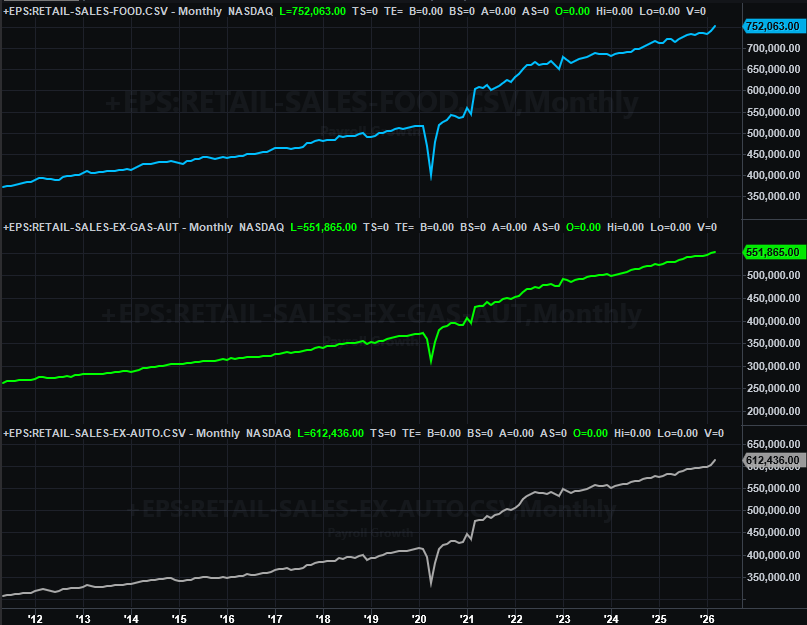
Not a whole lot of reports to look at from last week, but we did get one big one. That’s last month’s retail sales. They were up, and by a surprisingly healthy amount. While inflation is the crux of this increase, note that consumers were still willing to step up with open wallets and open pocketbooks.
Retail Sales Charts
Then on Friday, we got April’s third and final update of the University of Michigan’s consumer sentiment. It comes as no surprise that it fell to a multiyear low of 49.8 (not yet updated on our chart below).
Consumer Sentiment Charts
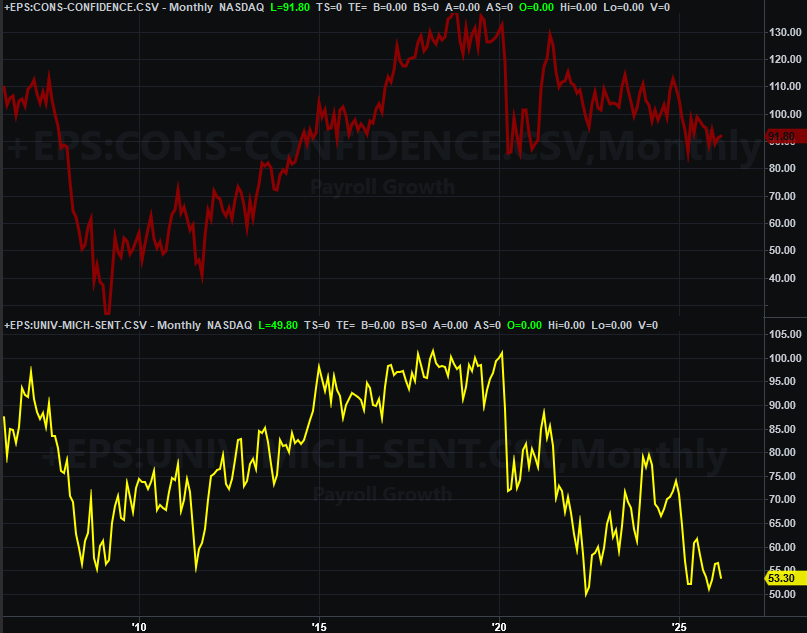
We’ll hear the Conference Board’s measure of consumer confidence for April on Tuesday of this week. Economists believe this number will follow the University of Michigan’s figure lower, although it’s not expected to reach a multiyear low of its own. Still, both sentiment indicators are alarmingly low, and leading… and not necessarily at low levels that somehow seem to imply a bottom is being made. To this end, it’s kind of surprising the market was able to reach a record high when most people are wildly worried about the foreseeable future.
Everything else is on the grid.
Economic Data Report Calendar
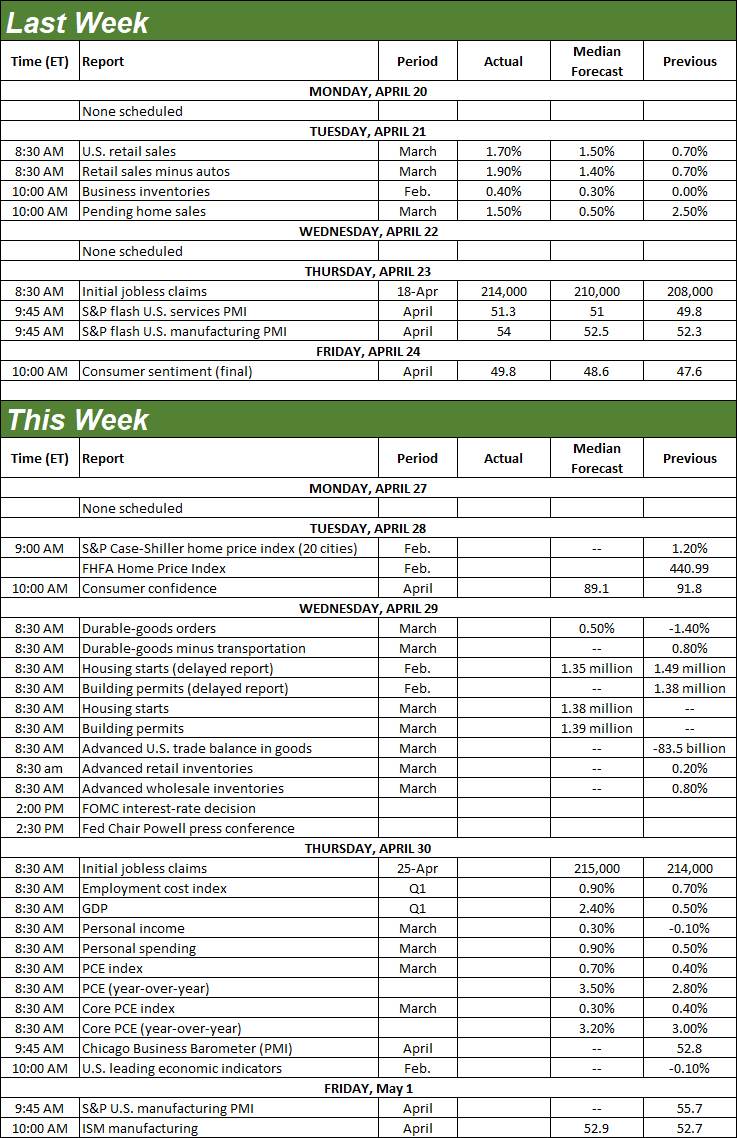
Source: Briefing.com, TradeStation
In addition to the look at April’s consumer confidence, also on Tuesday we’ll hear from Standard & Poor’s and the FHFA about February’s home prices. You’ll likely recall that they’ve been edging higher, but finally started to show some signs of slowing in January. Don’t be surprised to see this slowing continue for February.
Home Price Charts
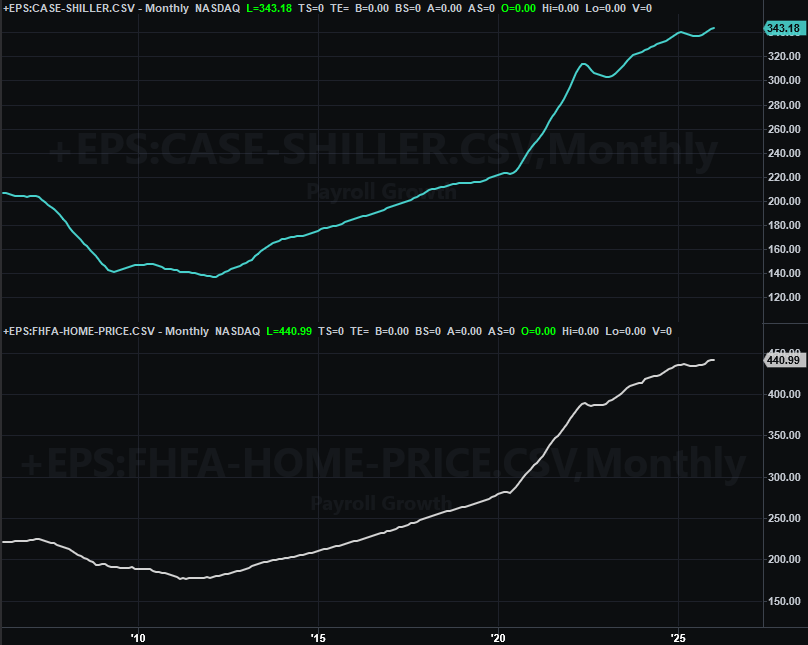
Also keep in that while home prices are an indication of economic health, they don’t indicate the total quantity of houses sold. They only point to pricing power.
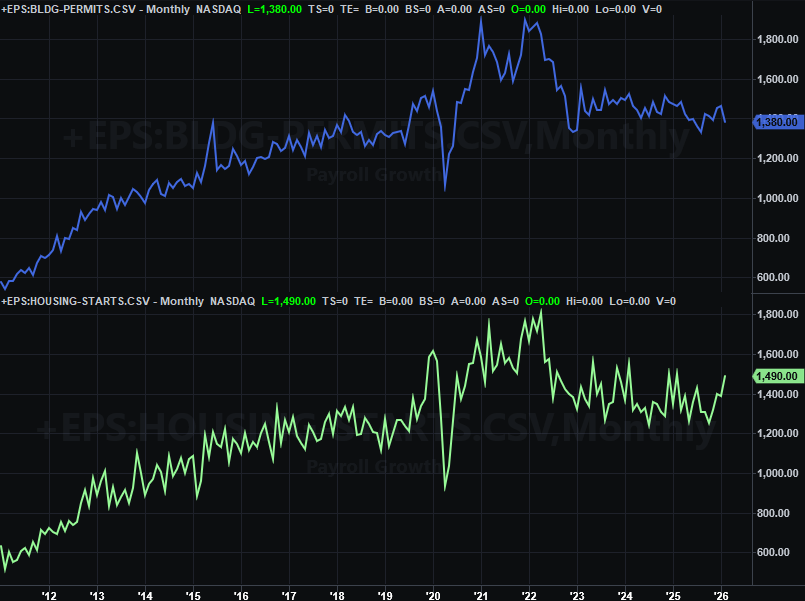
Somewhat in this vein, on Wednesday look for housing starts and building permits data for February and March. We were getting a mixed message as of January, so it will be interesting to see how much -- if any -- clarity we get with this update.
Housing Starts and Building Permits Charts
Wednesday’s big news will of course be the Federal Reserve’s decision on interest rates… a matter that became far more complicated in just the past few weeks. As of the latest look traders are saying there’s a 99.5% chance the FOMC won’t change a thing this time around, and is unlikely to change anything at least through the beginning of next year.
Thursday’s look at last month’s consumer spending and personal income numbers will shed some light on the correctness of Wednesday’s call on interest rates, although as it stands right now, the expected increase in spending and wages confirms there’s no room or reason for the Fed to lower rates.
The only other item of interest in the lineup for this week is Friday’s look at the nation’s manufacturing sector from the ISM for Aprile. It’s been pretty healthy, particularly in light of the economic backdrop. Economists don’t think this has changed in the meantime.
ISM Services and ISM Manufacturing Index Charts
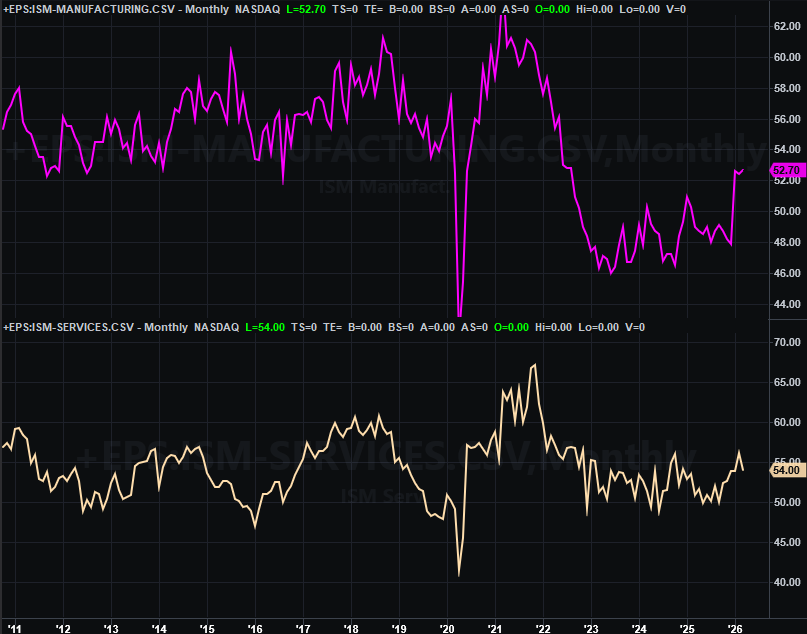
The ISM’s services index update for April is coming next week. It hasn’t been quite as bullish, but still firmly positive despite miserably low sentiment.
Stock Market Index Analysis
We start things this week with a look at the weekly chart of the NASDAQ Composite, just for a bit of perspective. As you can see, the index’s 1.5% gain was the weakest of the past four that carried the NASDAQ more than 20% above its early April low.
NASDAQ Composite Weekly Chart, with MACD and VXN
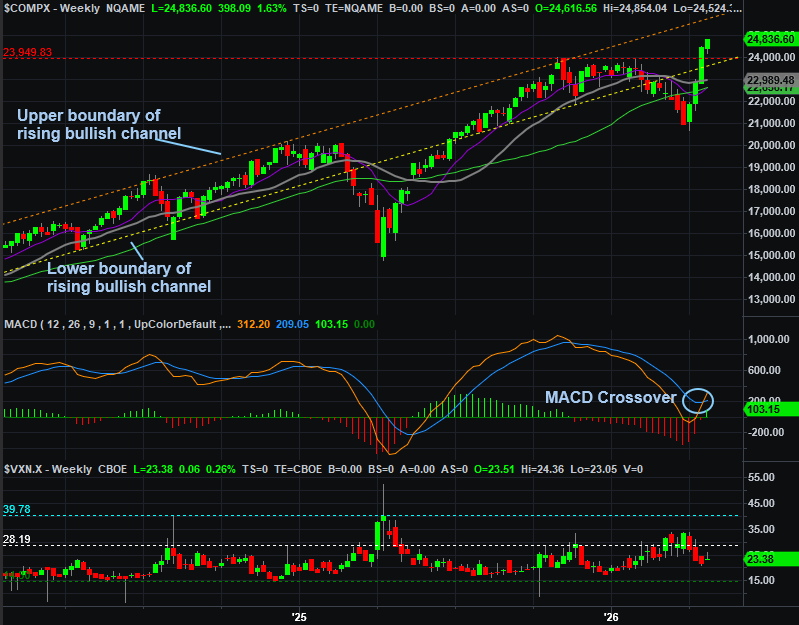
From a basic technical perspective, it’s bullish. The NASDAQ put some distance between itself and the technical ceiling at 23,950 (red, dashed) it hurdled the prior trading week. And, the momentum speaks for itself; we even saw a bullish MACD crossover materialize.
There is one somewhat concerning detail to point out about the NASDAQ’s weekly chart, however. That’s the fact that the volatility index (VXN) isn’t plunging when it should be, in step with soaring stocks. It suggests that traders aren’t entirely convinced this rally effort is going to last. And honestly, given just how far the market’s come in just four weeks, it’s not crazy to worry about at least some sort of profit-taking pushback.
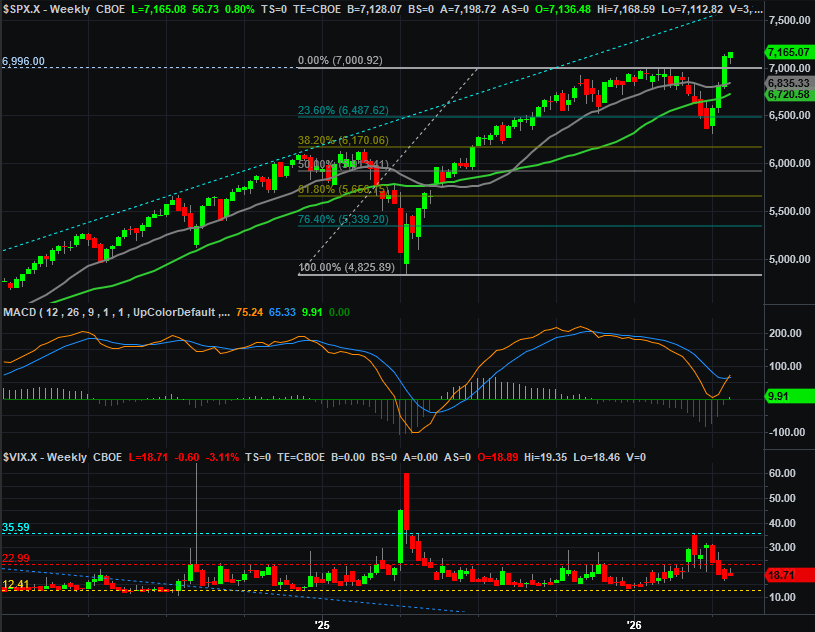
The S&P 500’s weekly chart tells the exact same story, leading to the exact same mixed message about what’s likely to come next.
S&P 500 Weekly Chart, with MACD and VIX
On that note, here’s the daily chart of the S&P 500 with a new overlay we usually don’t watch. That’s the moving average envelope, framed by yellow lines. The point and purpose of these lines is to establish boundaries of what constitutes “too far.” That doesn’t necessarily mean an index must reverse course when these boundaries met; as you can see, the lower boundary of the moving average envelope didn’t prevent the S&P 500 from imploding in March. However, an encounter with one of the moving average envelope boundaries usually does mean the market’s at a pivotal point. From here -- now that the upper boundary has been bumped -- the bulls are either going to have to make a firmer commitment, or back away and let the market peel back.
S&P 500 Daily Chart, with Volume and VIX
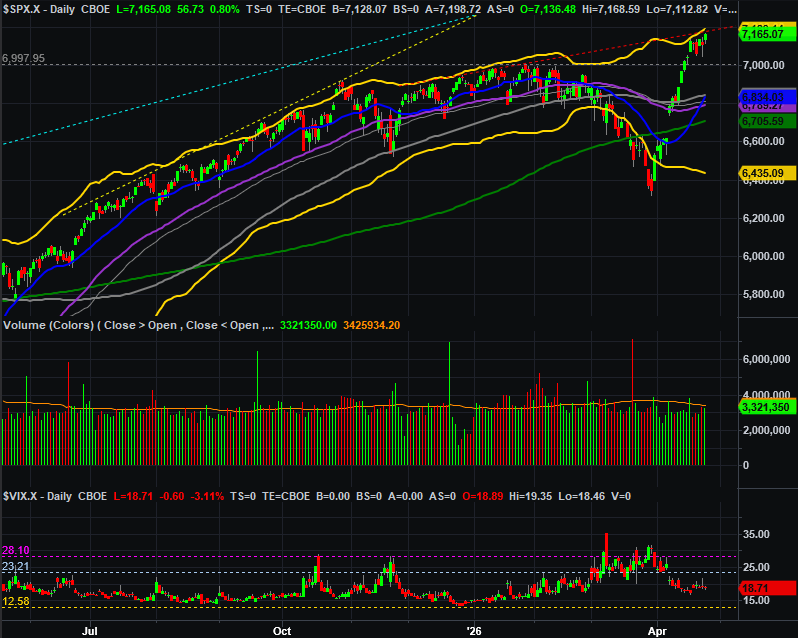
And the hurdle to continue moving higher may be taller than you realize. Although it’s fairly obscured by the upper boundary of the moving average envelope, there’s a straight-line technical ceiling (red, dashed) that was established in December and January and then re-encountered just last week.
Underscoring the prospect that the rally is running on fumes is the lack of volume behind the whole thing. And, the S&P 500’s Volatility Index’s (VIX) failure to move all the way to an absolute low near 13 once again suggests traders aren’t wildly confident in the bullishness, but instead are playing a little -- although not a lot of -- defense. Of course, this could mean the market ends up climbing a wall of worry.
Bottom line? This is a low-confidence call, but we’re likely to see some selling take shape from here. There’s no particular technical reason for that expectation. It’s just an acknowledgement of how extreme the past four weeks have been.
Then again, the market’s pretty disconnected from reality right now, and 100% being steered by how things in the Middle East are moving. That’s essentially a coin-toss for traders, which is why you won’t want to dig in too deep here on either side of the fence.


Comments
Log in or sign up to join the conversation.