


It wasn’t easy or pretty, but when all was said and done by the end of last week, the bulls appear to have won their recent battle. Both of the indices are now up and over the technical ceilings that they haven’t been able to hurdle until now.
It’s not a perfect bullish development, to be clear. There’s still some technical resistance above that could be a potential problem. There’s more support below than resistance above, however, and now there’s some bullish momentum to boot.
We’ll assess the action in a moment. Let’s first walk through last week’s biggest economic news and then preview what’s coming this week.
Economic Data Analysis
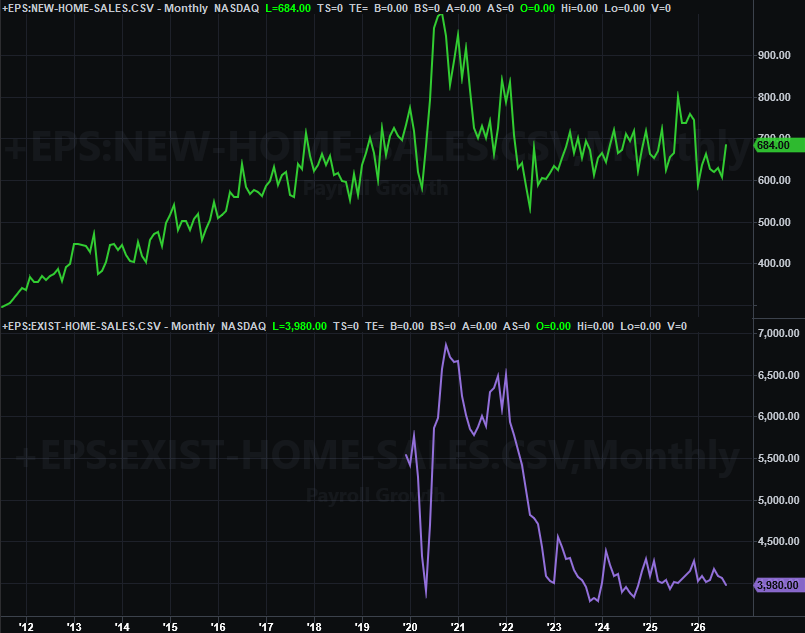
There were only two noteworthy economic announcements made last week. One of them was Thursday’s report of last month’s sales of newly built homes. You may recall that existing homes sales fell to a multi-month low in August. New-home sales, however, jumped from 607K in July to 684K last month, easily topping estimates of 618K.
New, Existing Home Sales Charts
Source: U.S. Census Bureau, Natl. Assn. of Realtors, TradeStation
These seemingly-disparate figures don’t necessarily defy logic. In defiance of the usual situation, existing home prices remain relatively more expensive compared to newly-built homes. Mostly though, just recognize that even with last month’s surprising pop, new-home sales are still quite low.
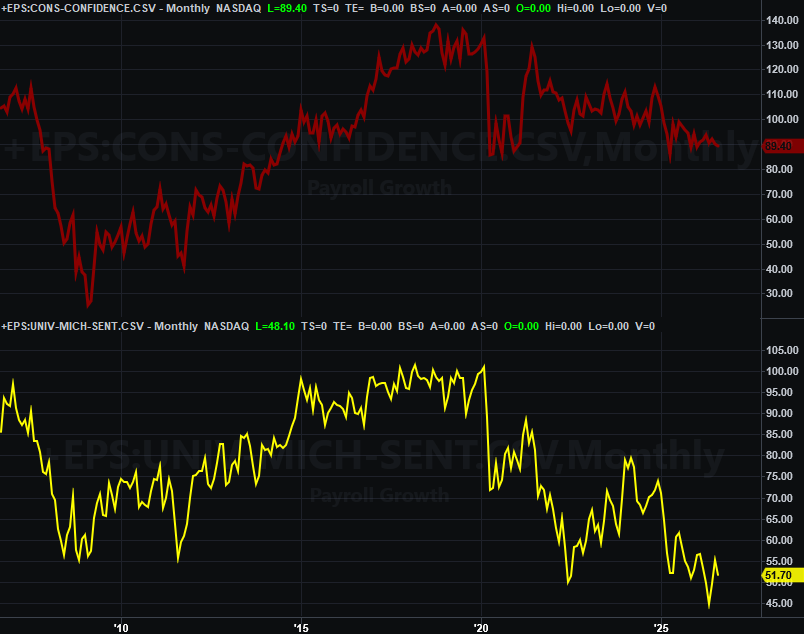
Last week’s other biggie was Friday’s third and final update of the University of Michigan’s consumer sentiment score for September. Although not yet updated on our chart below, as expected, it fell, sliding to 48.1. While it’s been worse, it’s still bad, and worsening. Given this, it’s also surprising the market’s still able to continue climbing higher.
Consumer Sentiment Charts
Source: Conference Board, University of Michigan, TradeStation
The Conference Board’s look at consumer confidence for September will be posted on Tuesday of this week. Economists are looking for a slight pullback from August’s already-low reading.
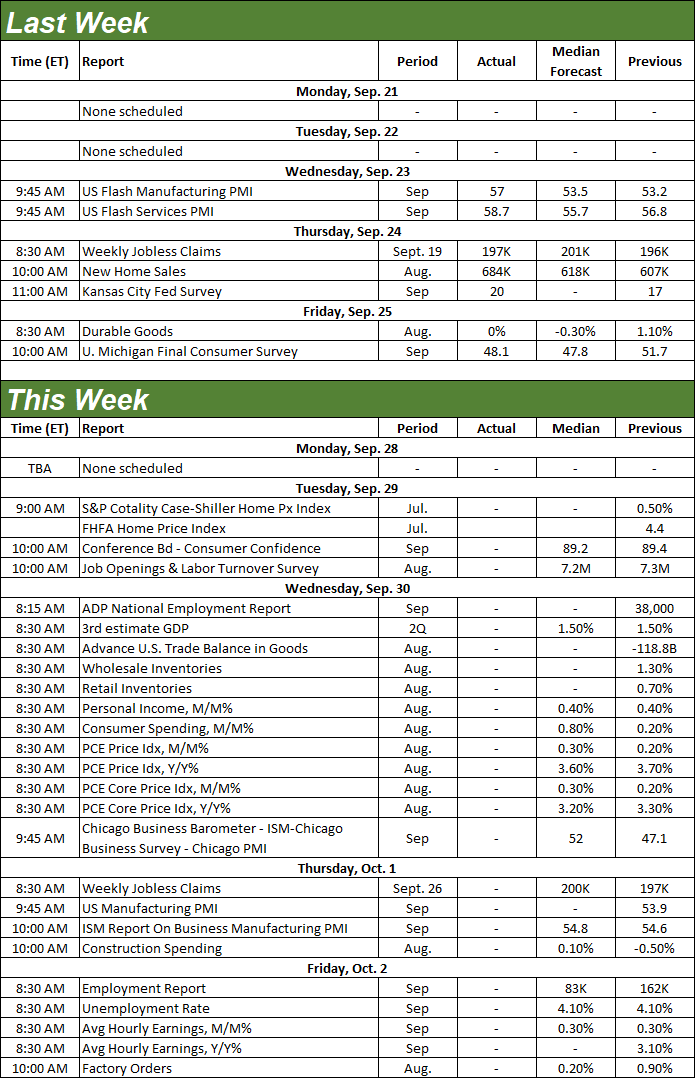
Everything else is on the grid.
Economic Data Report Calendar
Source: Briefing.com, TradeStation
This week’s fairly loaded.
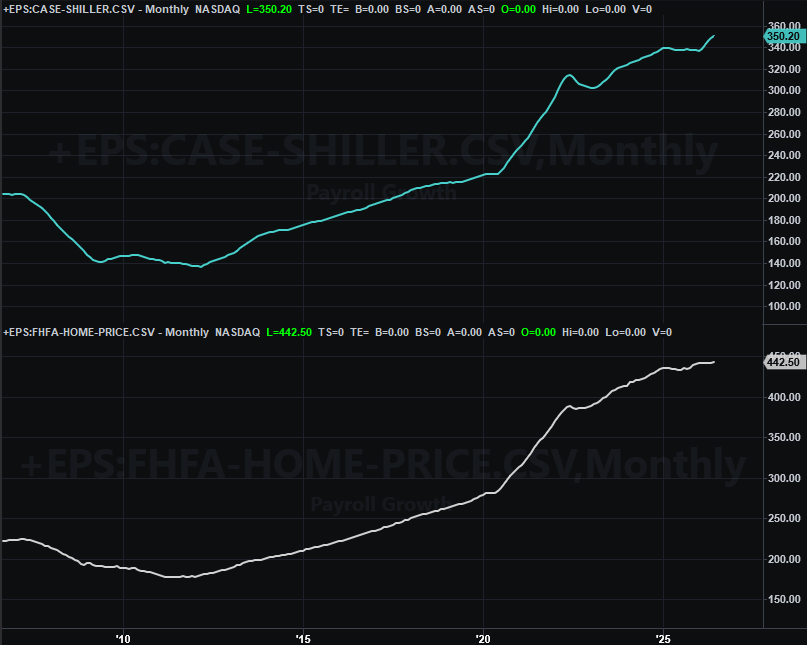
The party starts in earnest on Tuesday. In addition to the Conference Board’s consumer confidence report, we’ll also get an updated look at the Case-Shiller home price report, as well as a look at the FHFA Home Price Index. As you can see, the former is still moving higher at a measurably faster pace than the latter, although both are still pointed upward.
Home Price Index Charts
Source: FHFA, Standard & Poor’s, TradeStation
On Wednesday look for last month’s personal income and personal spending changes. These are important numbers simply because they have so much impact on the Federal Reserve’s decisions on interest rates. As it stands right now, forecasts call for continued growth of both, keeping the likelihood of another quarter-point rate increase on the table near the end of next month.
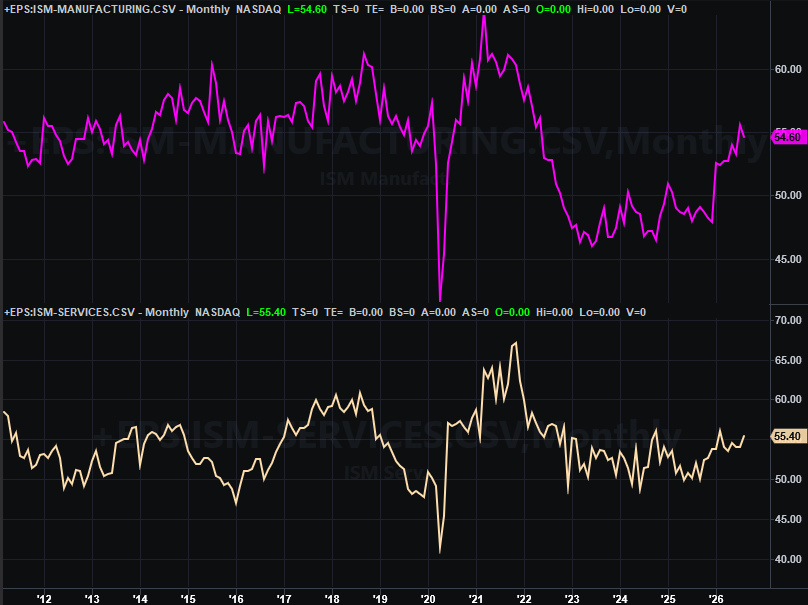
On Thursday we’ll get last month’s ISM Manufacturing Activity Index number from the Institute of Supply Management, or ISM. Economists are only looking for a slight improvement from August’s slight dip. Even so, either number is positive in the sense that they’re both well above 50.
ISM Manufacturing, Services Index Charts
Source: Institute of Supply Management, TradeStation
The ISM Services Index update will be released next week. Note that it too is above the key 50 level.
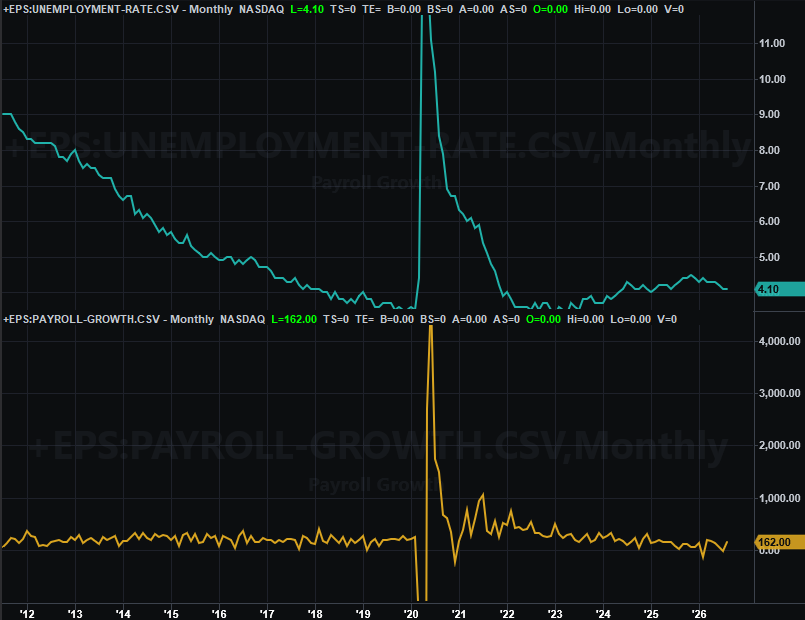
Finally, the coming week’s big news is of course Friday’s jobs report. You might recall August’s numbers were a pleasant surprise. They’re not likely to be quite as strong this time around, but still positive enough to hold the unemployment rate down to a respectable 4.1%.
Payroll Growth, Unemployment Rate Charts
Source:Institute of Supply Management, TradeStation
Stock Market Index Analysis
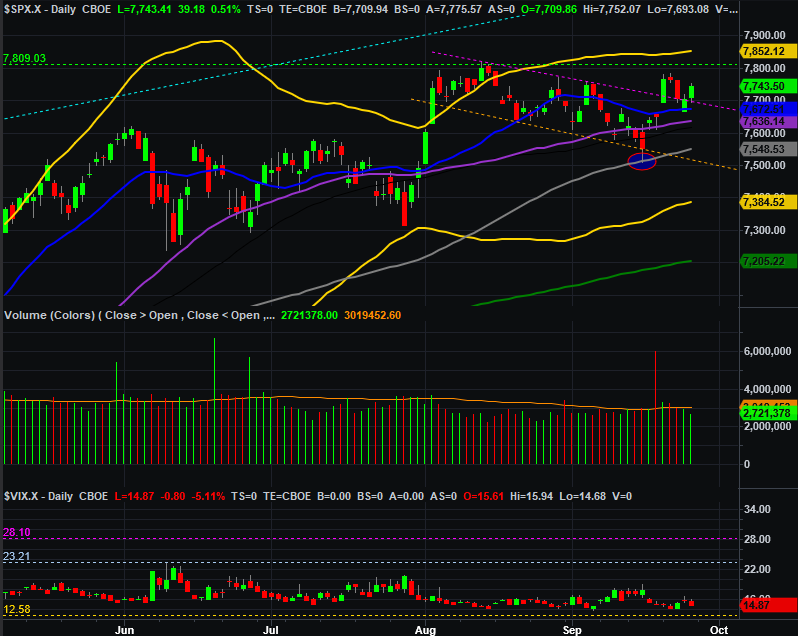
It’s not the way the bulls would have liked it to pan out. But, when all was said and done, the bulls got the job done. The overheated jump on Monday of last week set up a bit of profit-taking pressure on Wednesday and Thursday. By Friday, however (the latter half of Thursday, actually), the bulls had regrouped and were hammering away at it again. With Friday’s gain, the S&P 500 (SPY) is back above the short-term falling resistance line (purple, dashed) that had been steering the index lower since early August.
S&P 500 Daily Chart, with Volume and VIX
Source: TradeNavigator
There’s still work to be done here, however, for the S&P 500 to fully get over the hump. The target here is 7,809 (green, dashed), where the index peaked last month. If the S&P 500 can just get above that level, it will go far in terms of convincing the majority of traders that the index can freely move higher; just keep an eye on the upper Bollinger band (yellow) currently at 7,852 as well, which also has the potential to stymie any nascent forward progress.
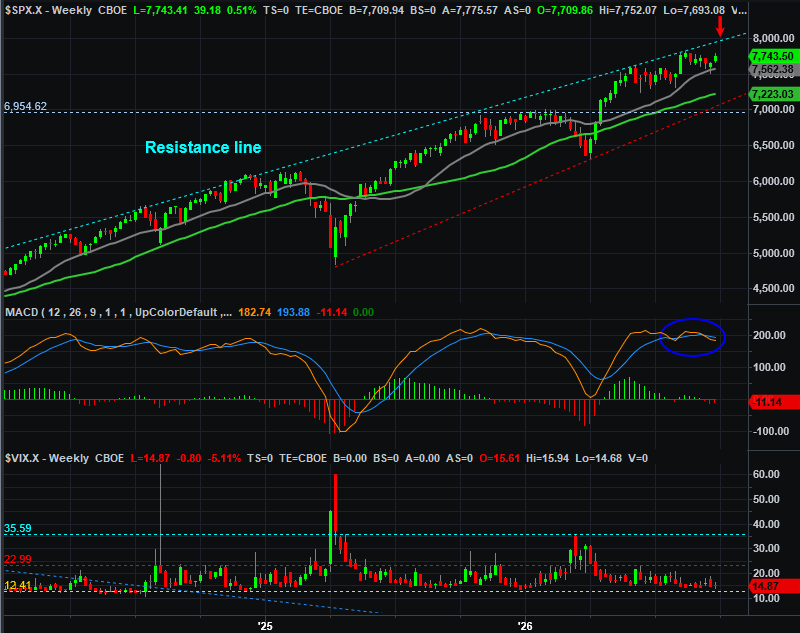
The potential problem shows up on the weekly chart of the S&P 500. Although there is some room for the index to keep climbing before bumping into the upper boundary of a very long-term bullish trading range (see where the red arrow is pointing to the light blue dashed line). Not much, but some. Given how long it’s been since the index has suffered a true correction -- and how far and long it’s rallied from March’s low -- there’s no denying the weight of these gains has the potential to undermine the bullish effort sooner or later, and probably sooner than later.
S&P 500 Weekly Chart, with MACD and VIX
Source: TradeNavigator
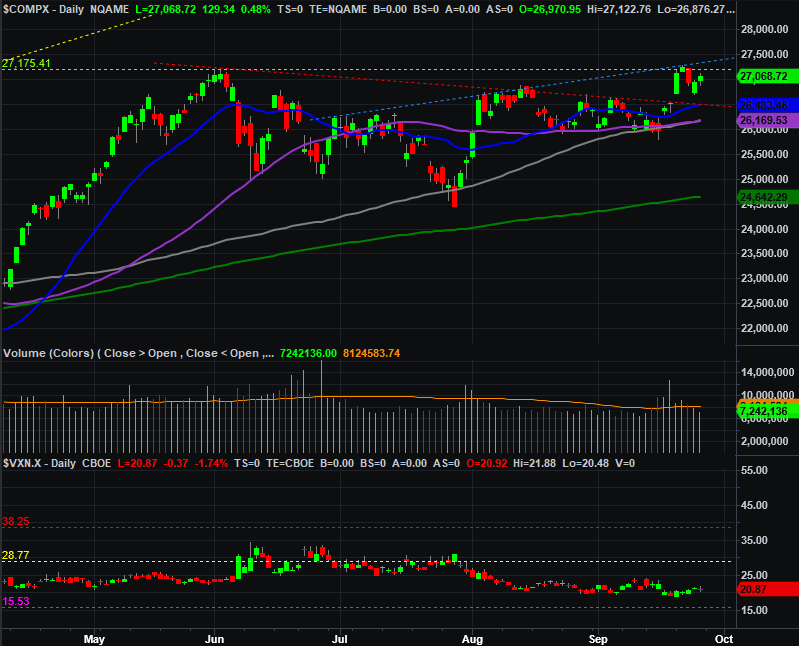
The NASDAQ Composite (QQQ) is doing slightly better, but only slightly. It did manage to break above June’s peak at 27,175 (lime green, dashed) briefly on Tuesday, and though it peeled back later in the week, it ended Friday’s session testing that same technical ceiling without actually hurdling it. Also notice that the composite confirmed the rising technical resistance (light blue, dashed) that now connects all the key highs since late June.
NASDAQ Composite Daily Chart, with Volume and VXN
Source: TradeNavigator
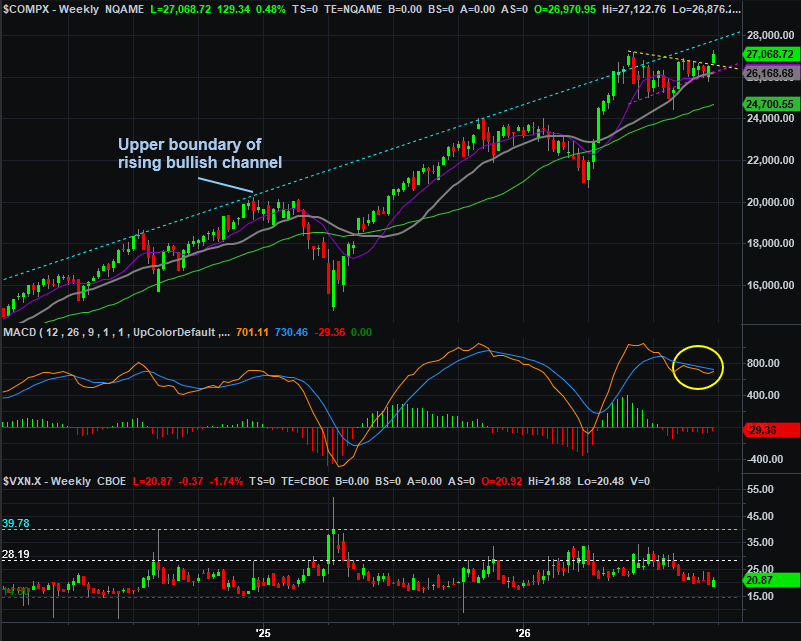
Now take a step back and look at the weekly chart of the NASDAQ Composite. The breakout above the falling resistance line (yellow, dashed) is crystal clear here, but so is the fact that the NASDAQ also remains below the upper boundary of its long-term, rising trading range (light blue, dashed). There’s some room to run before bumping into more serious resistance.
NASDAQ Composite Weekly Chart, with MACD and VXN
Source: TradeNavigator
Bottom line? The momentum is pointed in a bullish direction, and the path of least resistance is higher even if there is some modest technical resistance above.
The obvious problem remains though. That is, the sheer weight of the runup from March’s low. The market has been stretched thin by persistent bullishness. The bulls don’t want to let go, which is understandable, but the proverbial piper needs to be paid sometime. We’d rather pay it now to clear the decks for the usual year-end bullishness. Not doing so now could limit that effort, and/or start the new year particularly vulnerable.
Of course, we’re still keeping an eye on all the technical support below where the indexes currently sit. Although there’s a lot of it, never say never. If the AI trade unravels thanks to the wrong bad news, for instance, the bulls could change their mind in a hurry. We’ll cross that bridge if-and-when we come to it though.



Comments
Log in or sign up to join the conversation.