


As expected, the bulls pushed back last week on the steep selloff from two weeks ago. As feared, that effort didn’t really go anywhere. It may have done more bearish harm than no such effort at all, in fact, by virtue confirming there’s now technical resistance at important technical levels. Indeed, we’re just one or two more bad days away from slipping into a selloff that won’t likely be easy to stop. We’ll need to proceed all the way through the correction.
We’ll take a detailed look at that in a moment. Let’s first walk through last week’s most important economic news, which didn’t initially make the adverse impact you might expect, but eventually did on Friday.
Economic Data Analysis
Last week’s big economic reports were of course Tuesday’s look at October’s consumer inflation followed by Friday’s look at producer costs. Although we didn’t get an annualized figure for consumer inflation due to last October’s government shutdown, we got enough information to confirm that overall price increases remain on the mid-3% area for consumers. As for the nation’s factories and assemblers, their input costs edged up by a multiyear high pace of 6.5%. Core inflation is slightly more tolerable, but only slightly.
Consumer, Producer Inflation Rate Charts
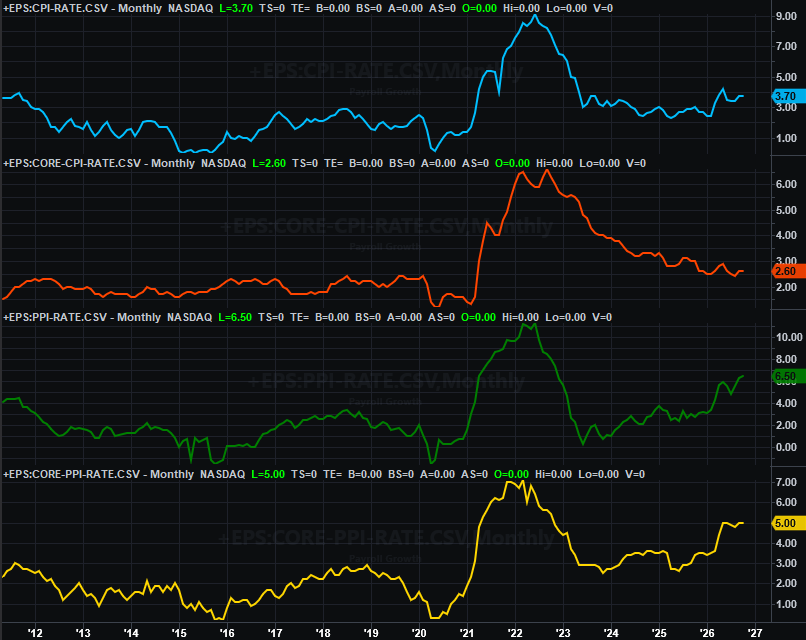
The Federal Reserve’s Open Market Committee will have little choice but to act when it has the chance to in early December. To this end, the CME’s FedWatch indicates there’s a 95% chance for a quarter-point increase in the Fed Funds Rate next month, and a 5% chance for a 50-basis point hike.
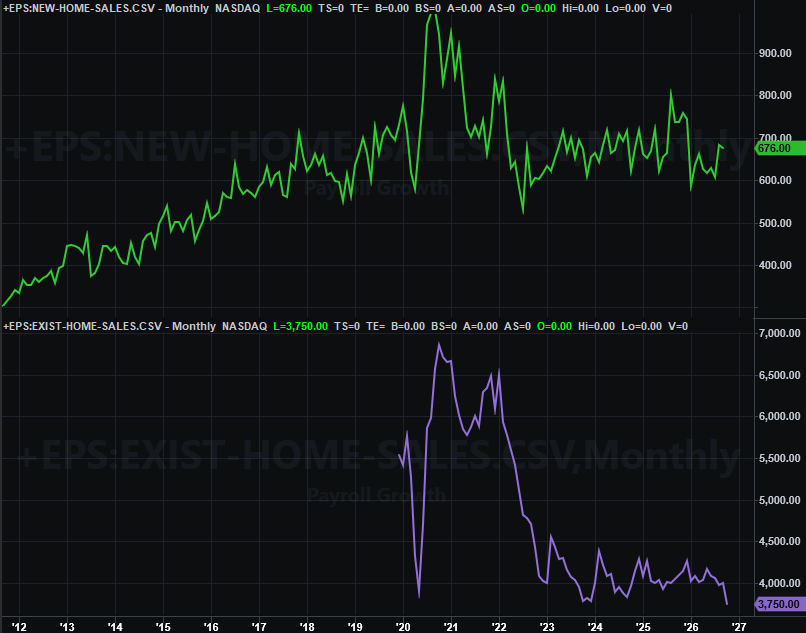
The only other item of real interest posted last week was Friday’s look at sales of existing homes, which were markedly low even if few people noticed. The National Association of Realtors reported sales of existing homes slipped to a multiyear low annualized pace of 3.75 million units, confirming there’s very little demand for homes at their present prices.
New, Existing Home Sales Charts
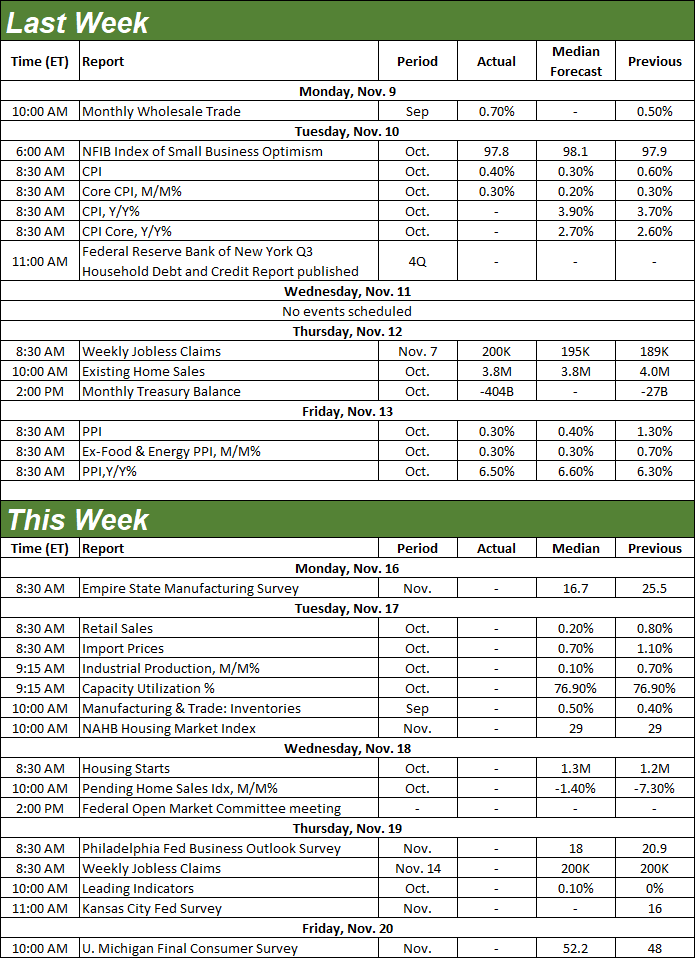
Everything else is on the grid.
Economic Data Report Calendar
Source: Briefing.com, TradeStation
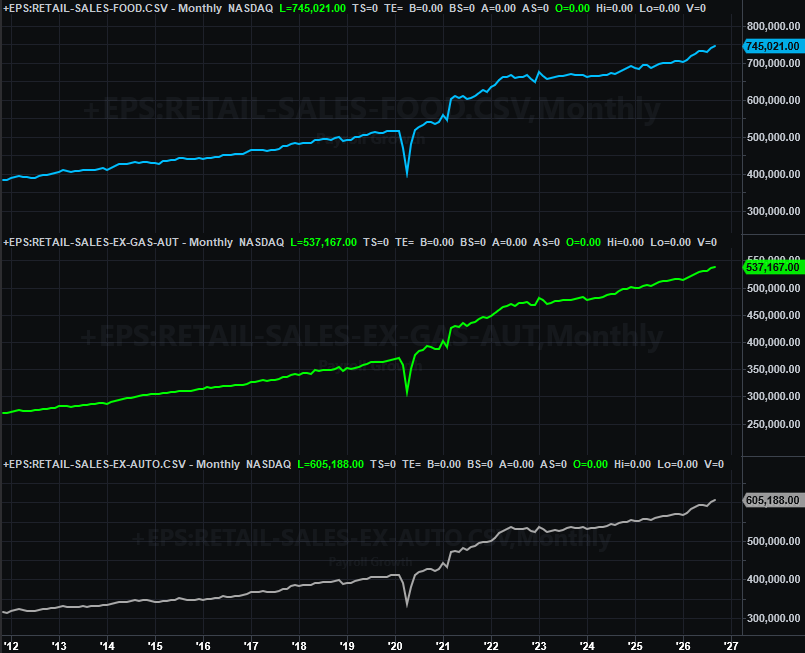
This week will give us a few important data nuggets as well, beginning with Tuesday’s look at last month’s retail sales. Spending has remained strangely strong considering the economic backdrop and poor consumer sentiment. But, the numbers are the numbers, and are expected to show some more modest improvement this time around.
Retail Sales Charts
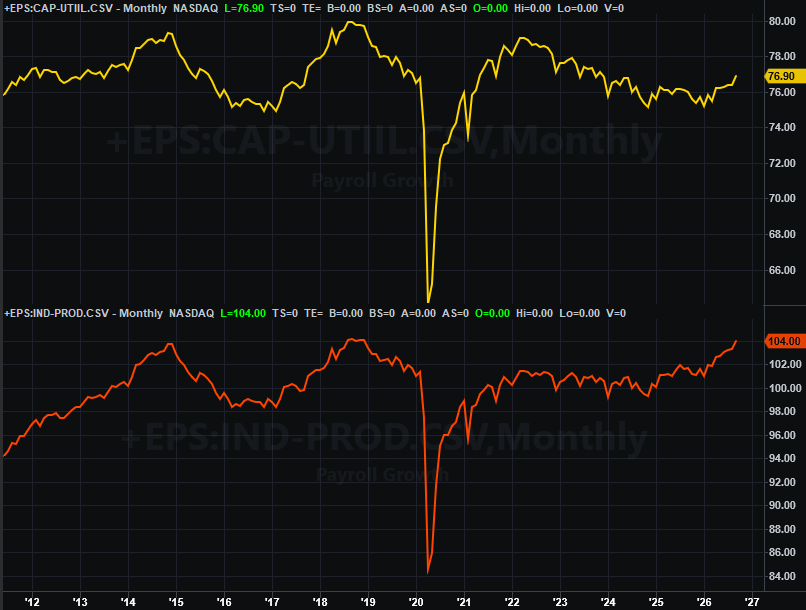
Also, on Tuesday look for the Federal Reserve’s measure of capacity utilization and industrial production. This has been a surprising bright spot of domestic economy and, ultimately, corporate earnings, even if it is the result of re-domestication policy for some of our factory work. Expect a bit more forward progress this time around.
Capacity Utilization and Industrial Productivity Charts
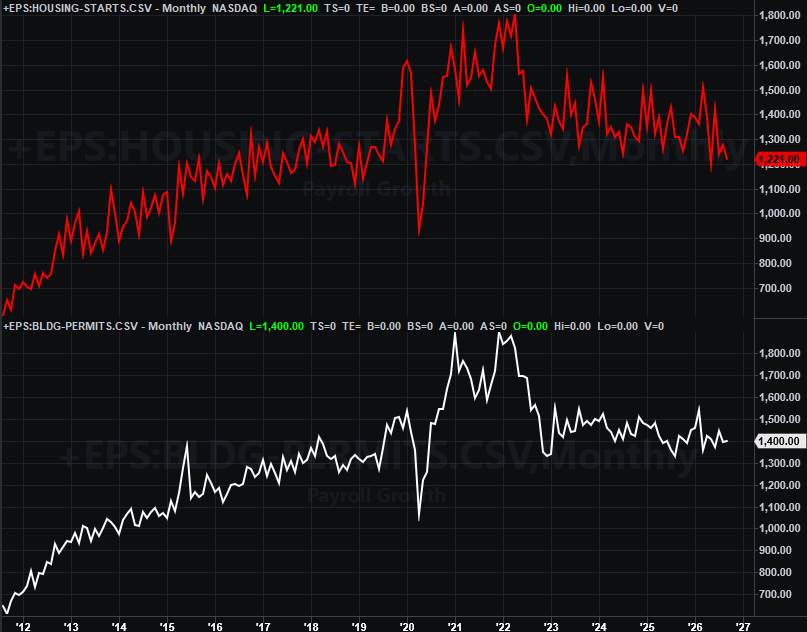
Finally, on Wednesday we’ll hear about October’s housing starts and building permits, somewhat rounding out the real estate picture for the month. Economists are calling for slight growth from September’s pace, but certainly not enough improvement to shake these numbers out of their slump.
Housing Starts and Building Permits Charts
Stock Market Index Analysis
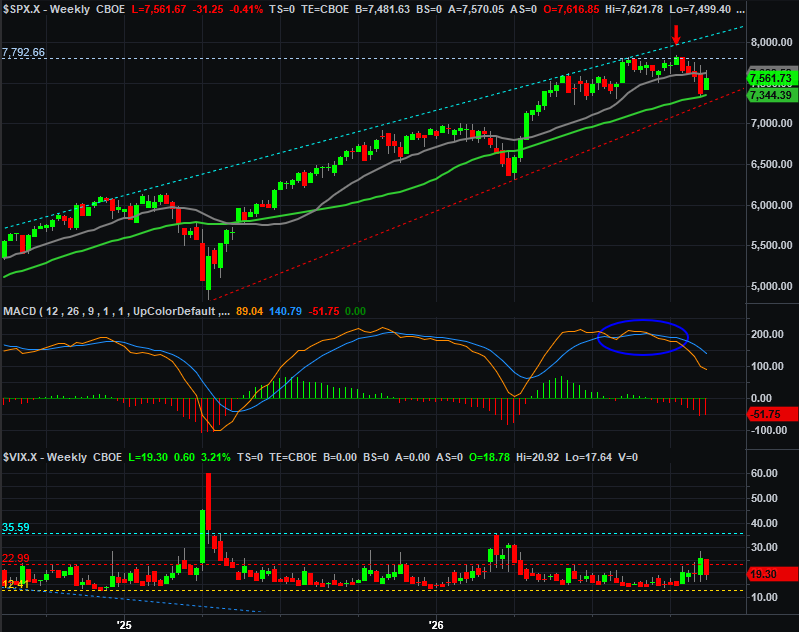
We kick things off this week with a look at the weekly chart of the S&P 500 just to paint a picture with the broad brush strokes first. As you can see, after four straight weekly losses that dragged the index down by nearly 6%, last week the S&P 500 mustered an intraweek recovery of 3.8% before settling back to a close of 7,561.73, up 2.5% from the prior week’s close. As you can see though, that didn’t exactly snap the index out of its slump. Indeed, the 100-day moving average line (gray) was confirmed as a technical ceiling.
S&P 500 Weekly Chart, with MACD and VIX
That confirmation is even clearer on the daily chart. Not only was the index unable to fight its way back above the 100-day moving average line last week, but the 20-day line (blue) -- which crossed under the 100-day line for the first time since March -- kept the S&P 500 from climbing any farther as well.
S&P 500 Daily Chart, with Volume and VIX
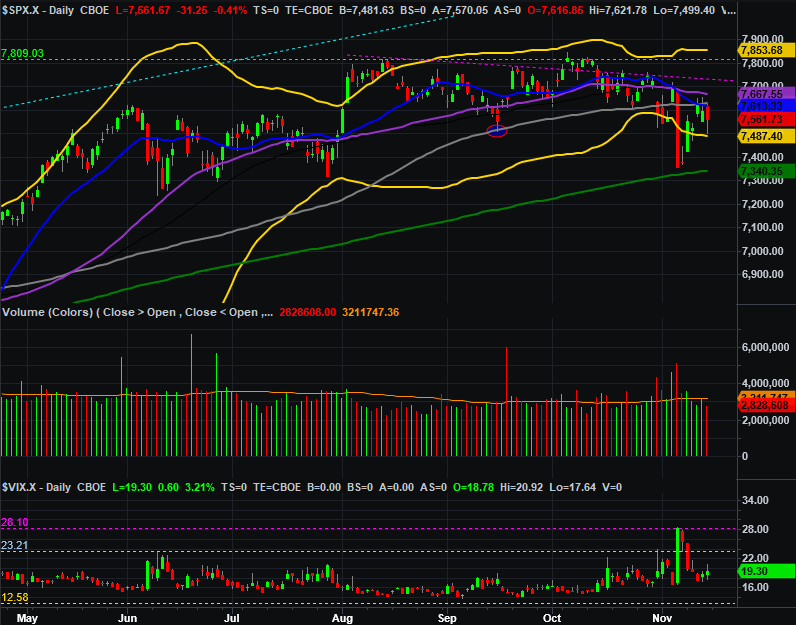
It’s not the end of the world just yet. As you can see, the index remains above its pivotal 200-day moving average line (green) at 7340, and hasn’t actually lost any net ground since June. It’s teetering uncomfortably close to a breakdown though… and the NASDAQ Composite is teetering even closer.
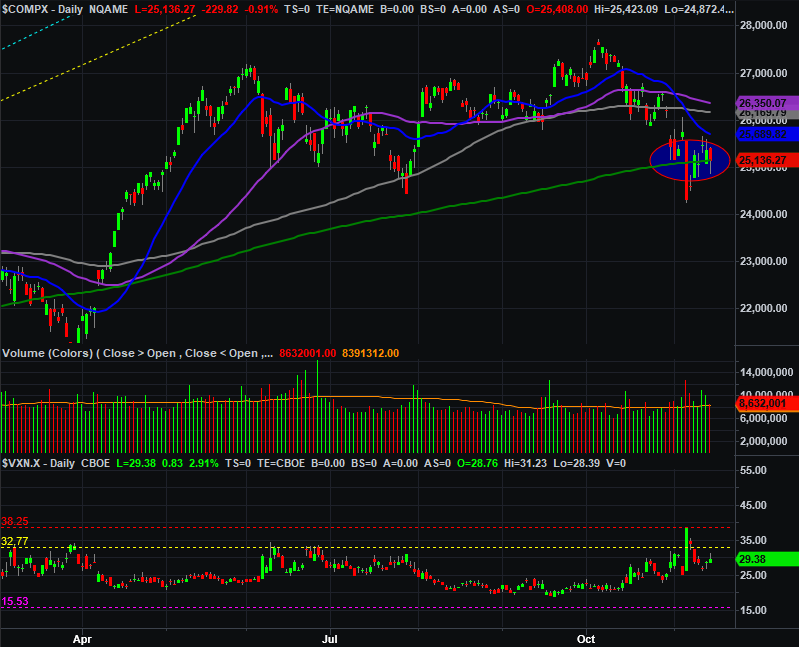
As you can see on the NASDAQ’s daily chart below, although the composite ended up closing right at it (no coincidence), it spent quite a bit of time underneath this technical support level/line last week. The bears are testing the waters, and if this floor breaks again, the bulls may not be so quick to push back the next time around.
NASDAQ Composite Daily Chart, with Volume and VXN
Here’s the weekly chart of the NASDAQ Composite to remind us of something else at work here. That’s the fact that over the course of the prior five weeks, this index traveled the entire span of the space between a long-term ceiling and an intermediate-term floor (dashed). Last week’s modest bounce makes sense, but it also doesn’t necessarily mean the composite is now going to make the journey back up to the upper boundary again. It could take a few attempts to break this longer-term technical floor currently at 24,403.
NASDAQ Composite Weekly Chart, with MACD and VXN
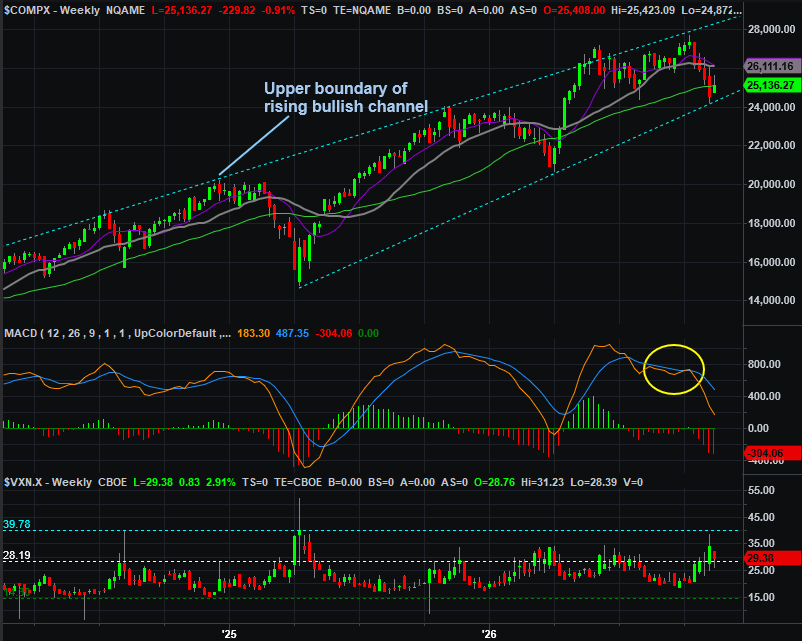
With all of that being said, we continue to pay just as much attention to both indexes’ volatility indices… the S&P 500’s “VIX,” and the NASDAQ’s “VXN.” These two indices are telling us just as much about when and where any selloff has surpassed its tipping point, and when the time comes, when and where any bottom has been made.
To this end, the S&P 500 may not hit its ultimate bottom until the VIX peaks at 35, and the VXN needs to reach 40 for the NASDAQ to make its bottom… although that one’s tricky, because the composite would have just broken under a major technical floor when that’s most likely to happen. We’ll have to make a fresh assessment of everything if-and-when that time comes.
And if we should finally get a true breakdown going, we’ll look at Fibonacci retracement lines as possible landing points. But first things first.



Comments
Log in or sign up to join the conversation.