

Year-on-year, activity still seems to be increasing. Shown below are the Lewis-Mertens-Stock (NY Fed) WEI, and the Woloszko (OECD) Weekly Tracker, and the Baumeister-Leiva-Leon-Sims Weekly Economic Conditions Index for the US, for data up to a week ago (September 10th):
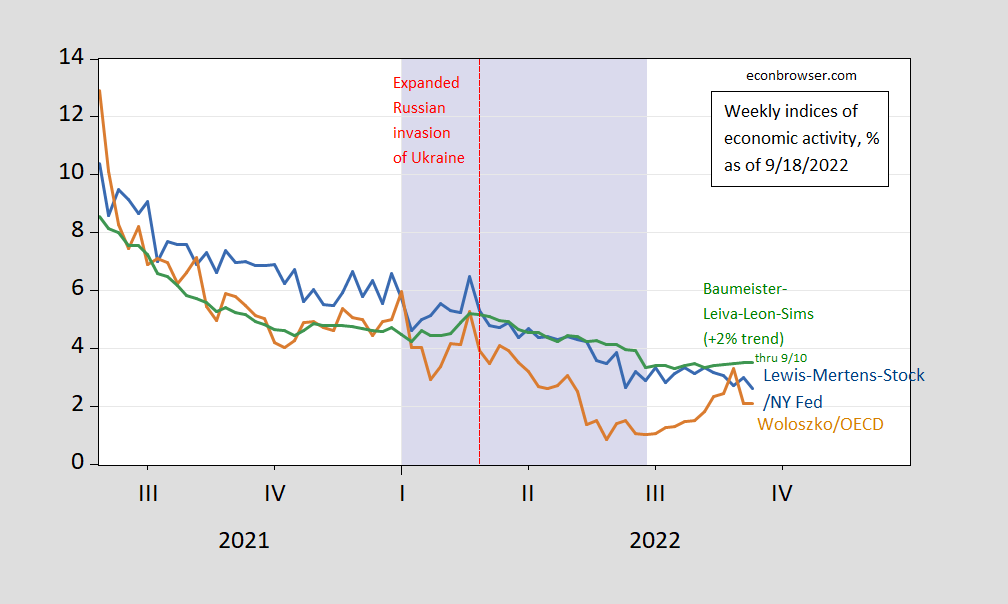
Figure 1: Lewis-Mertens-Stock (NY Fed) Weekly Economic Index (blue), Woloszko (OECD) Weekly Tracker (tan), Baumeister-Leiva-Leon-Sims Weekly Economic Conditions Index for US plus 2% trend (green) Lilac shading denotes a hypothetical H1 recession dates. Source: NY Fed via FRED, OECD, WECI, and author’s calculations.
The WEI reading for the week ending 9/10 of 2.6 is interpretable as a y/y quarter growth of 2.6% if the 2.6 reading were to persist for an entire quarter. The OECD Weekly Tracker reading of 2.1 is interpretable as a y/y growth rate of 2.1% for year ending 9/10. The Baumeister et al. reading of 1.5% is interpreted as a 1.5% growth rate in excess of long term trend growth rate. Average growth of US GDP over the 2000-19 period is about 2%, so this implies a 3.5% growth rate for the year ending 9/10.
Since these are year-on-year growth rates, it’s possible we were in a recession in H1 as one observer suggested a couple weeks ago (the period is highlighted by the lilac shading), but it (still) seems unlikely, contra suggestions by observers such as Steven Kopits.
More By This Author:
Hurricane Maria and Puerto Rico 5 Years LaterDid US Inflation Accelerate Relative To Euro Area?
PPI in August, And Possible Implications For The CPI


Comments
Log in or sign up to join the conversation.