


Cooper Standard Update
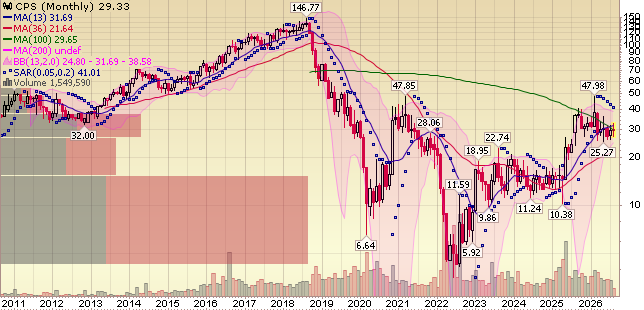
For newer readers, here’s a quick overview of the key drivers behind our thesis on Cooper Standard, a special situation auto supplier offering a leveraged play on the light vehicle production recovery and the massive operating leverage that comes with it:
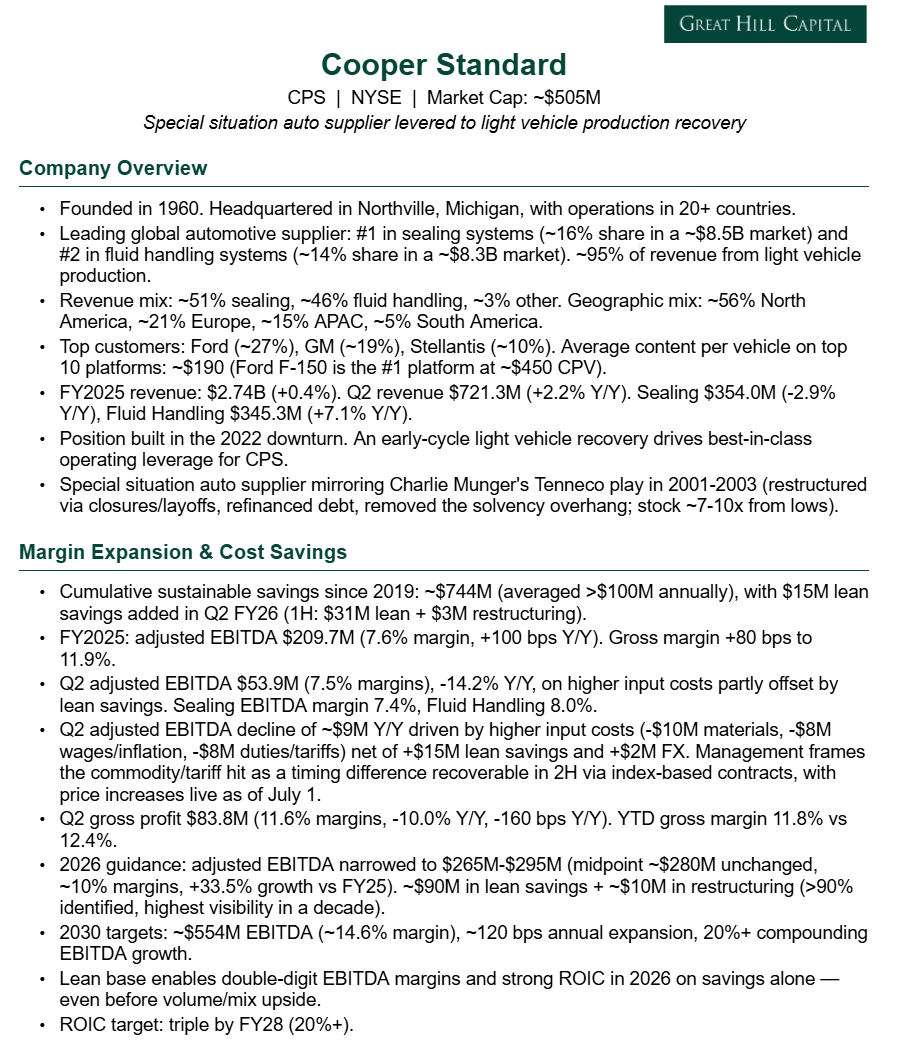
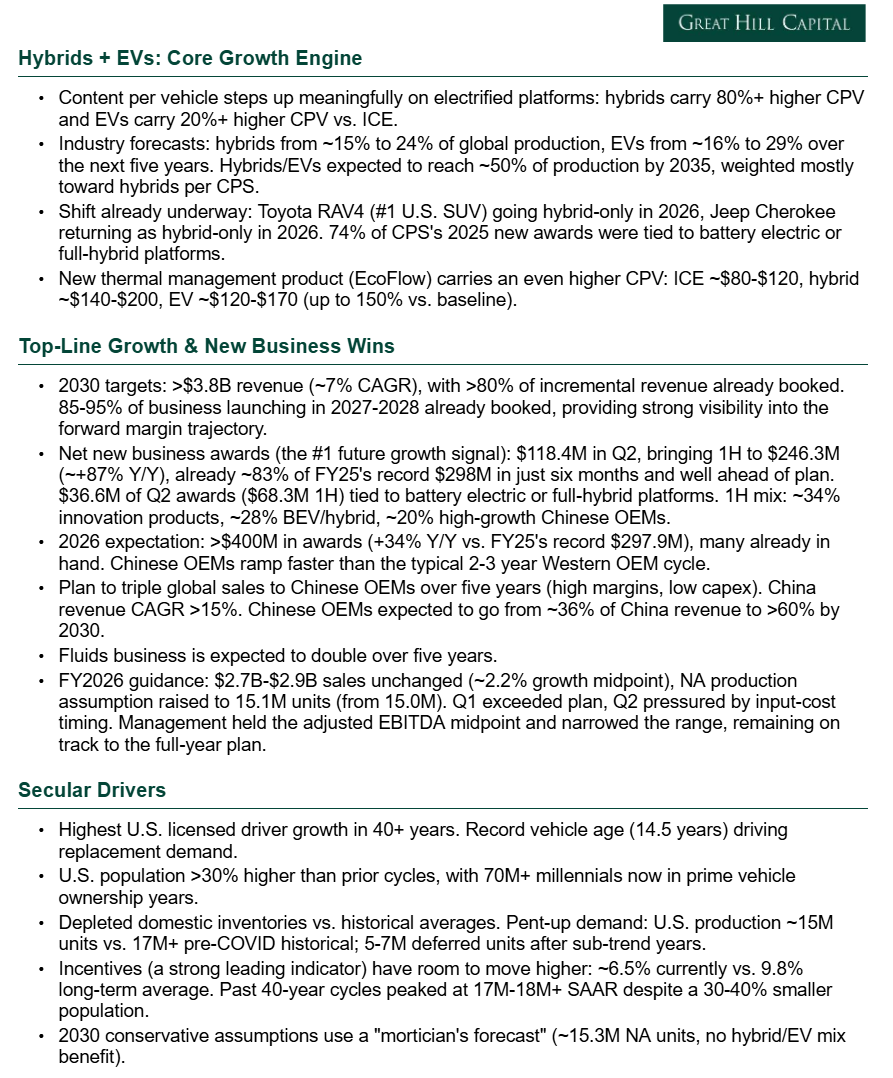
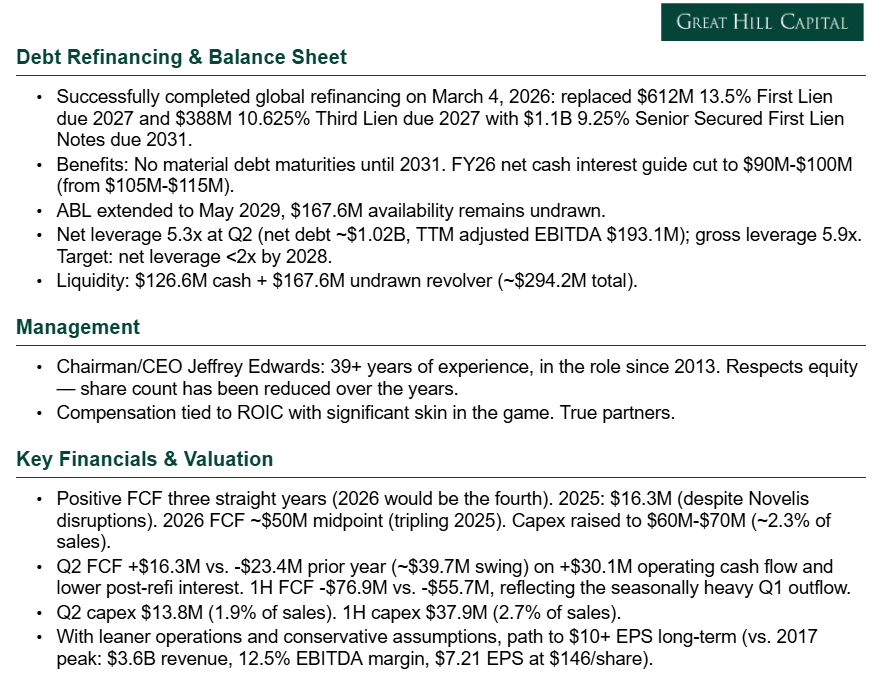
Paying the bill before sending the invoice.
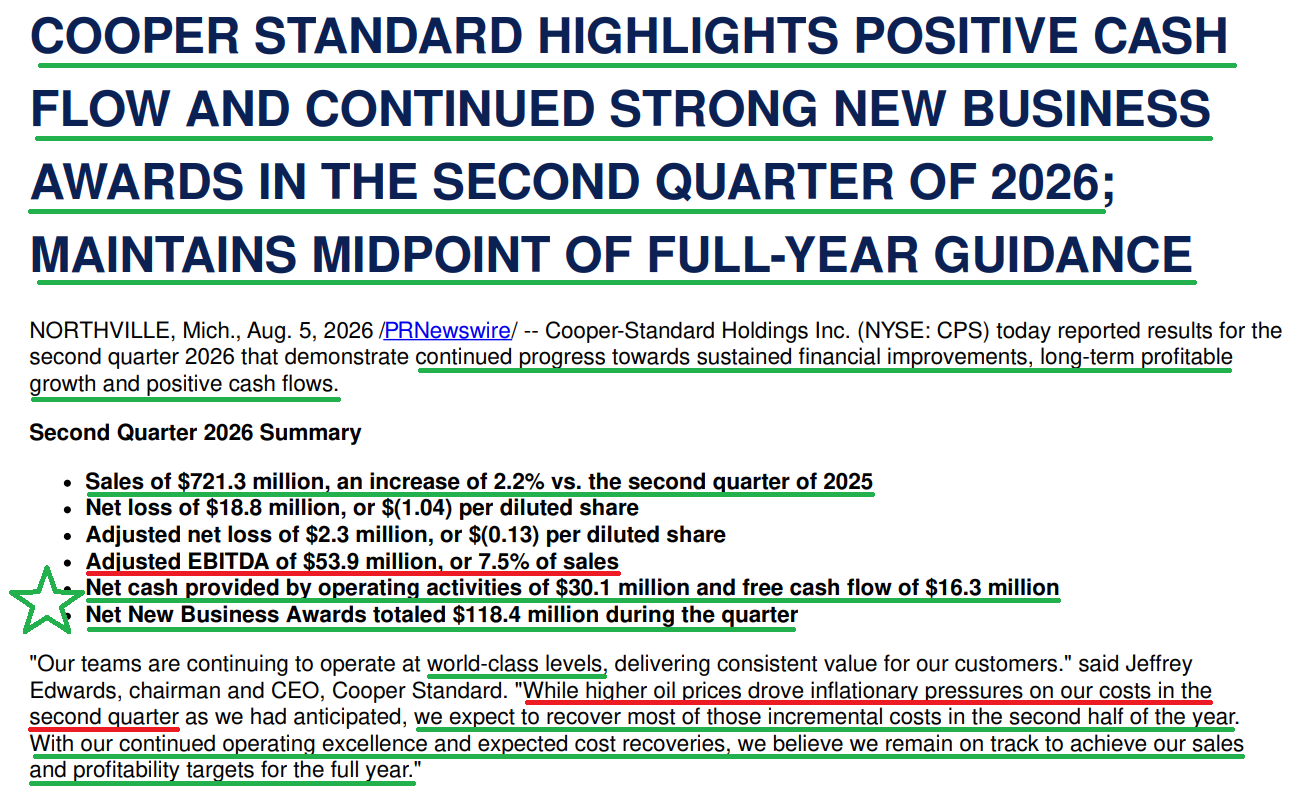
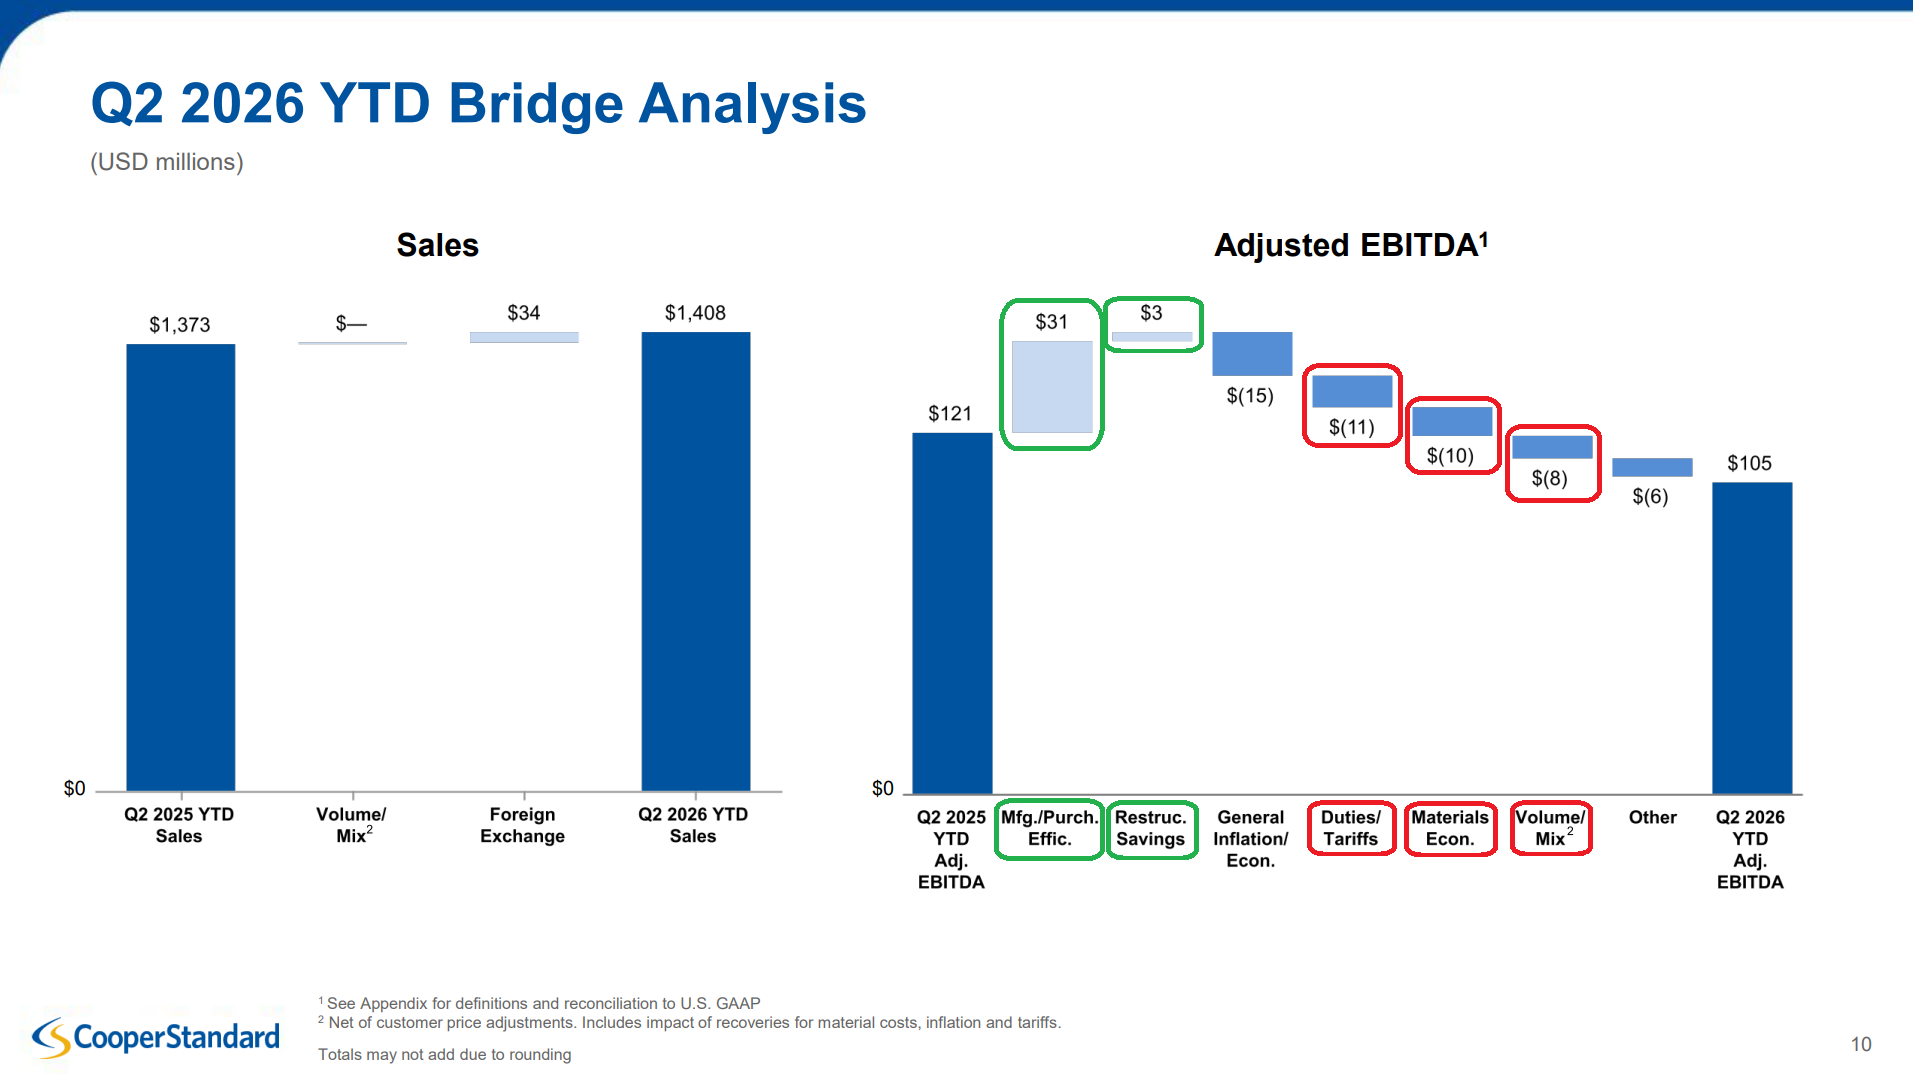
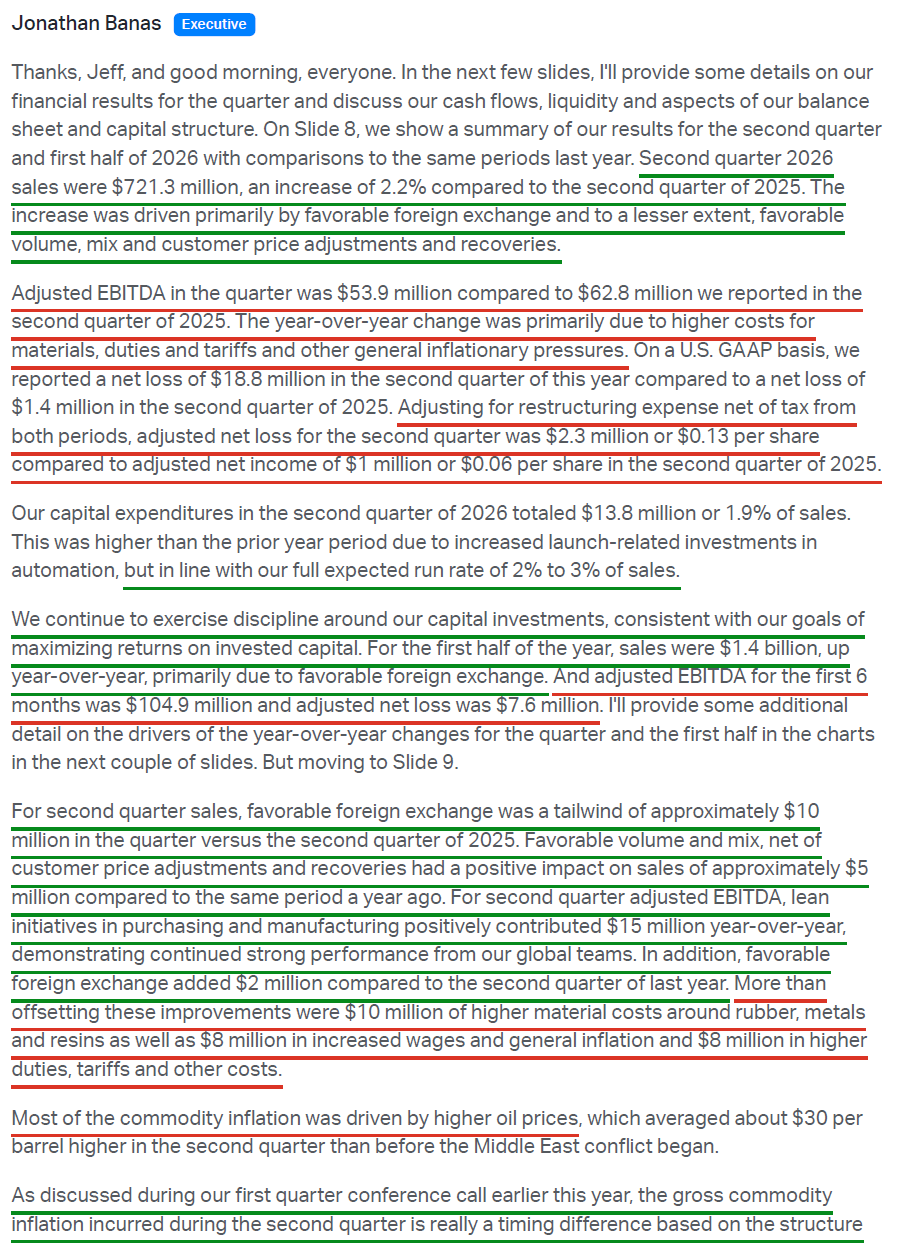
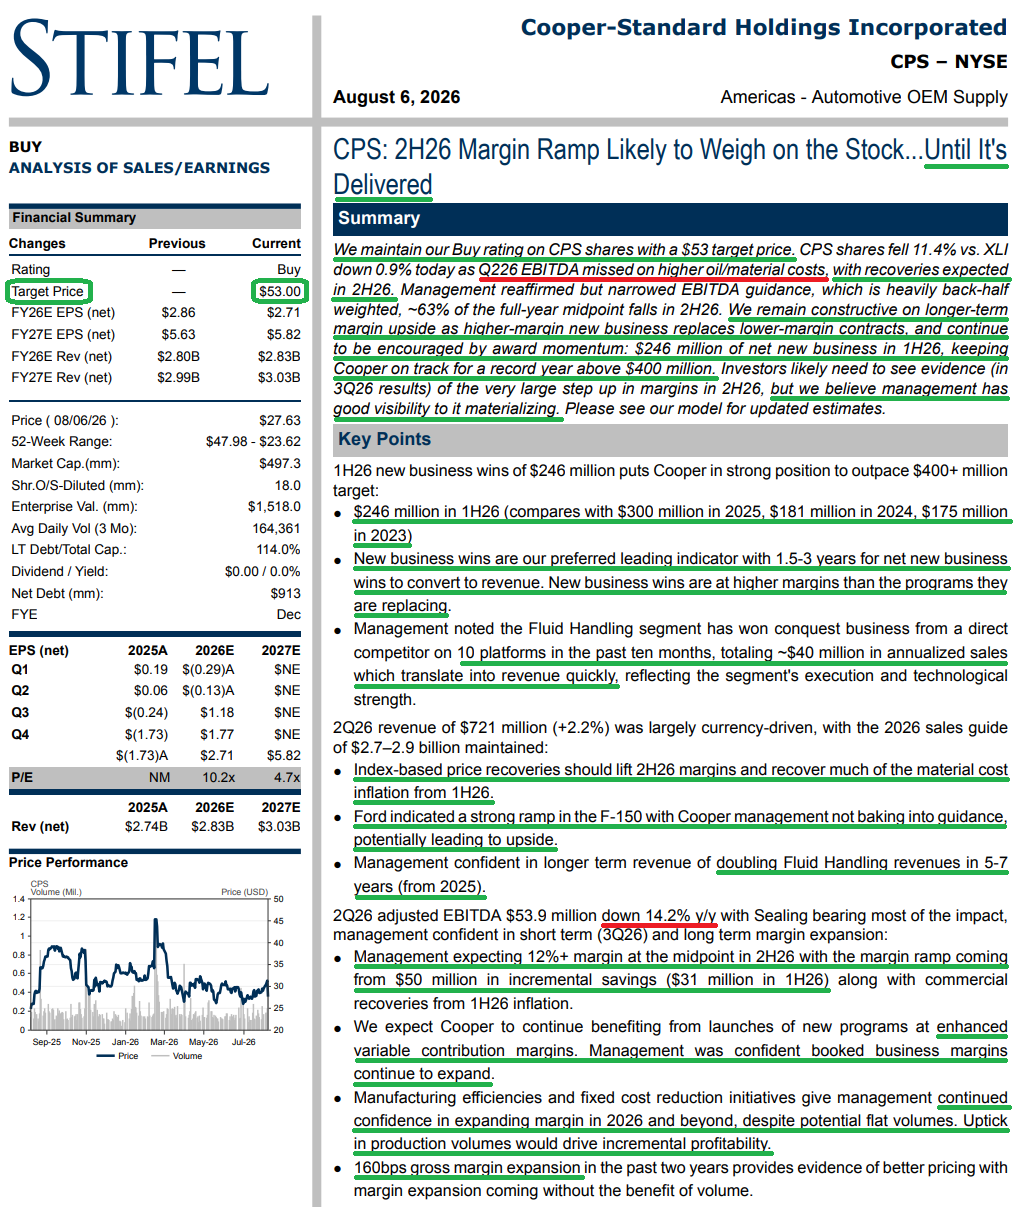
If we had to sum up Cooper Standard’s second quarter in a single line, that would be it. While top-line revenue of $721.3M (+2.2% Y/Y) came in ahead of consensus of $710.6M, adjusted EBITDA took input cost pressures on the chin, falling 14.2% Y/Y to $53.9M (7.5% margins) and missing consensus expectations of $64.8M.
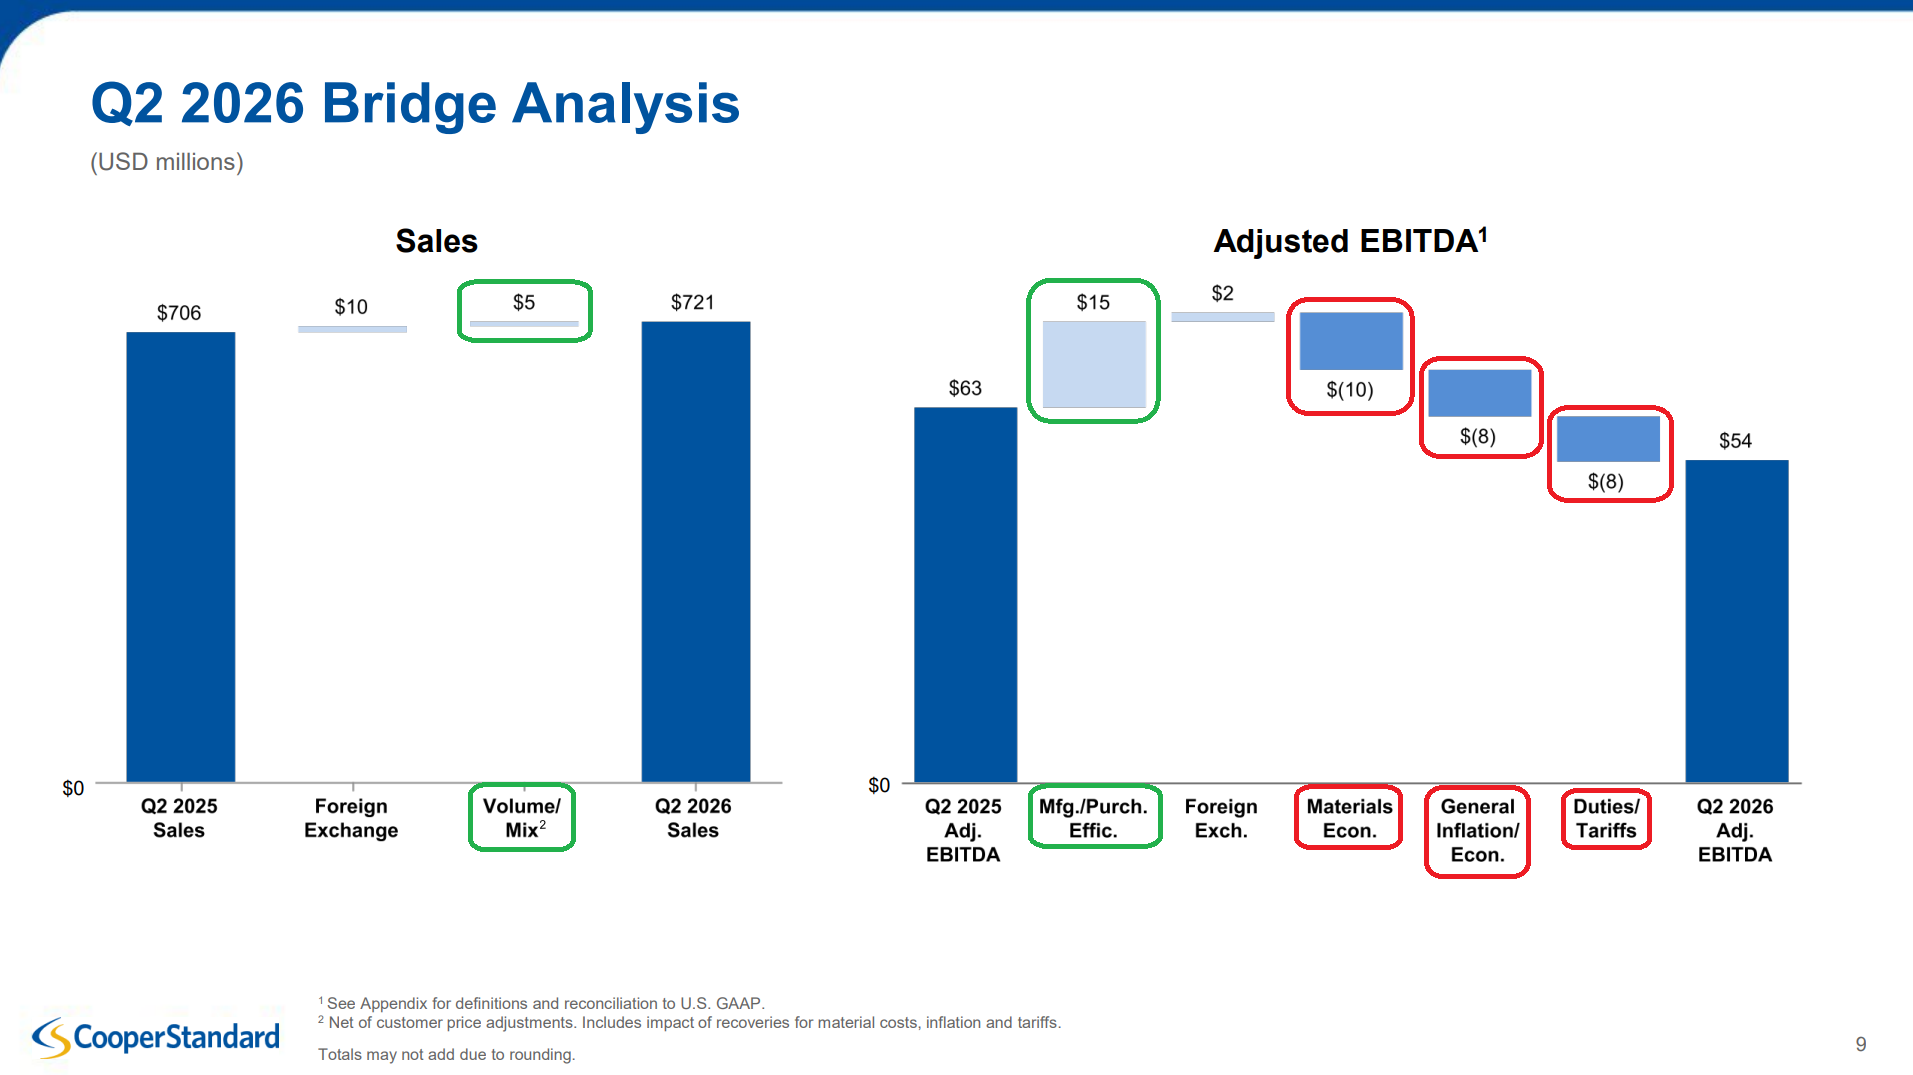
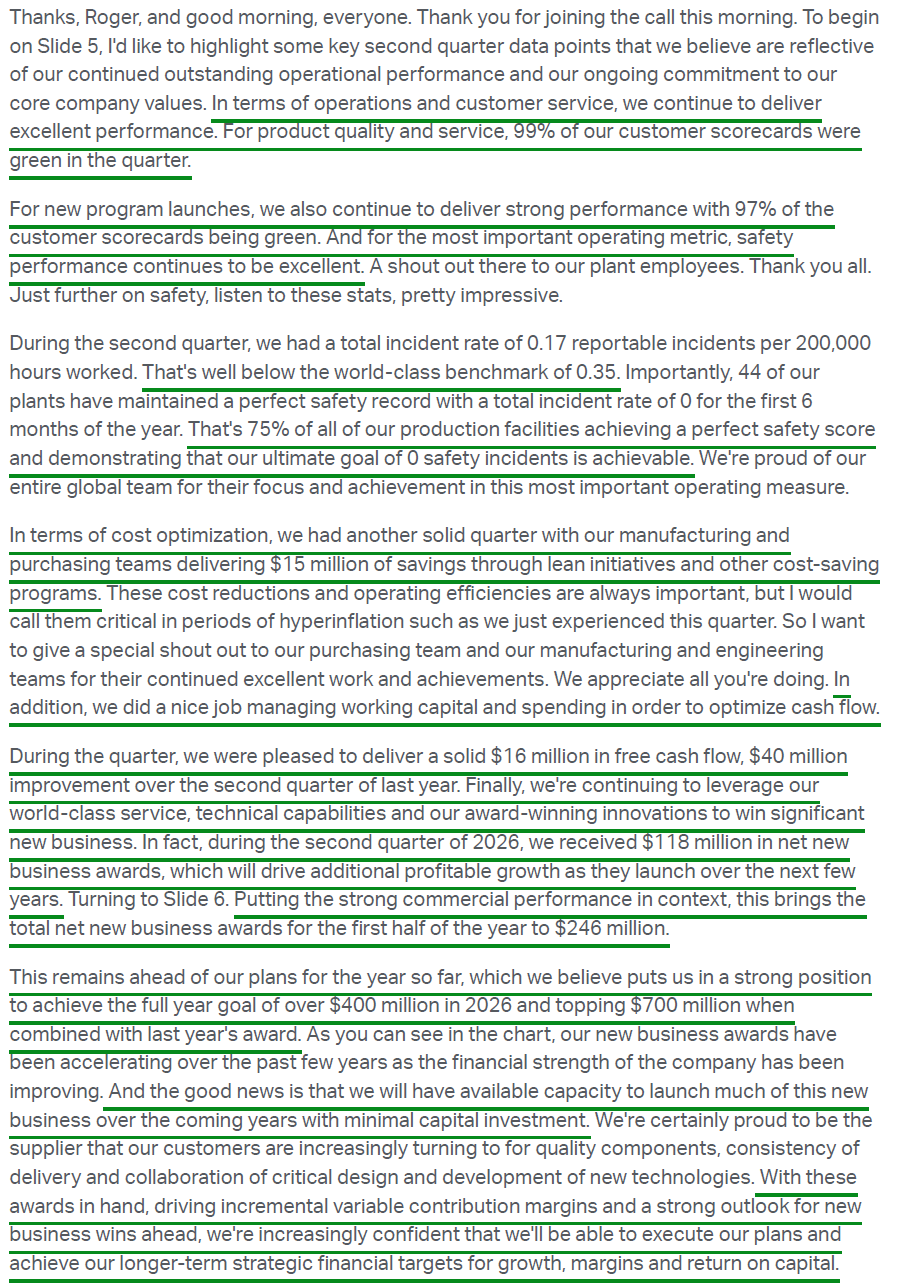
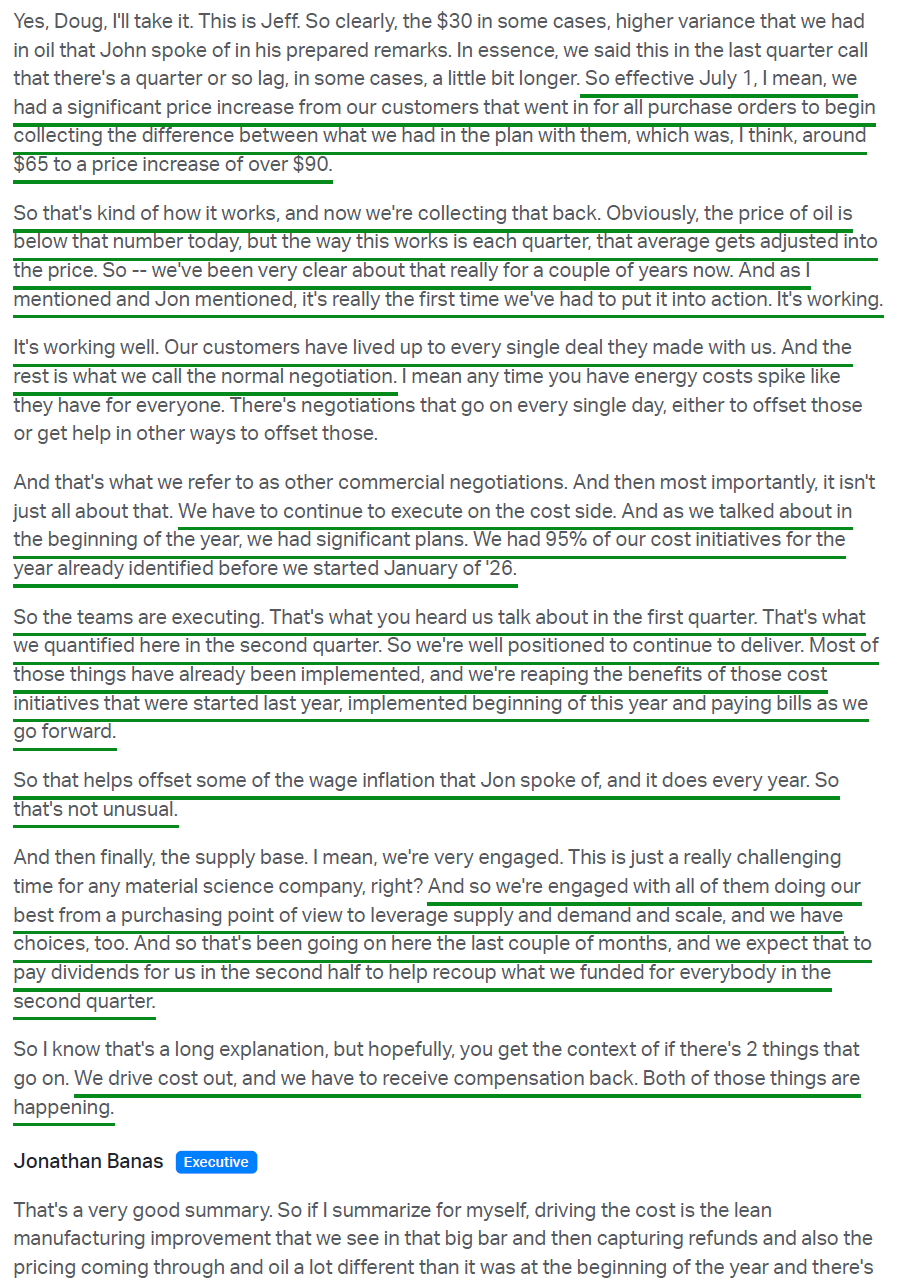
As expected, the decline came almost entirely from oil-driven hyperinflation working its way through the cost base, with higher material costs across rubber, metals, and resins creating a $10M headwind, alongside general inflation ($8M) and higher duties and tariffs ($8M), with $15M of manufacturing and purchasing lean savings absorbing what it could.
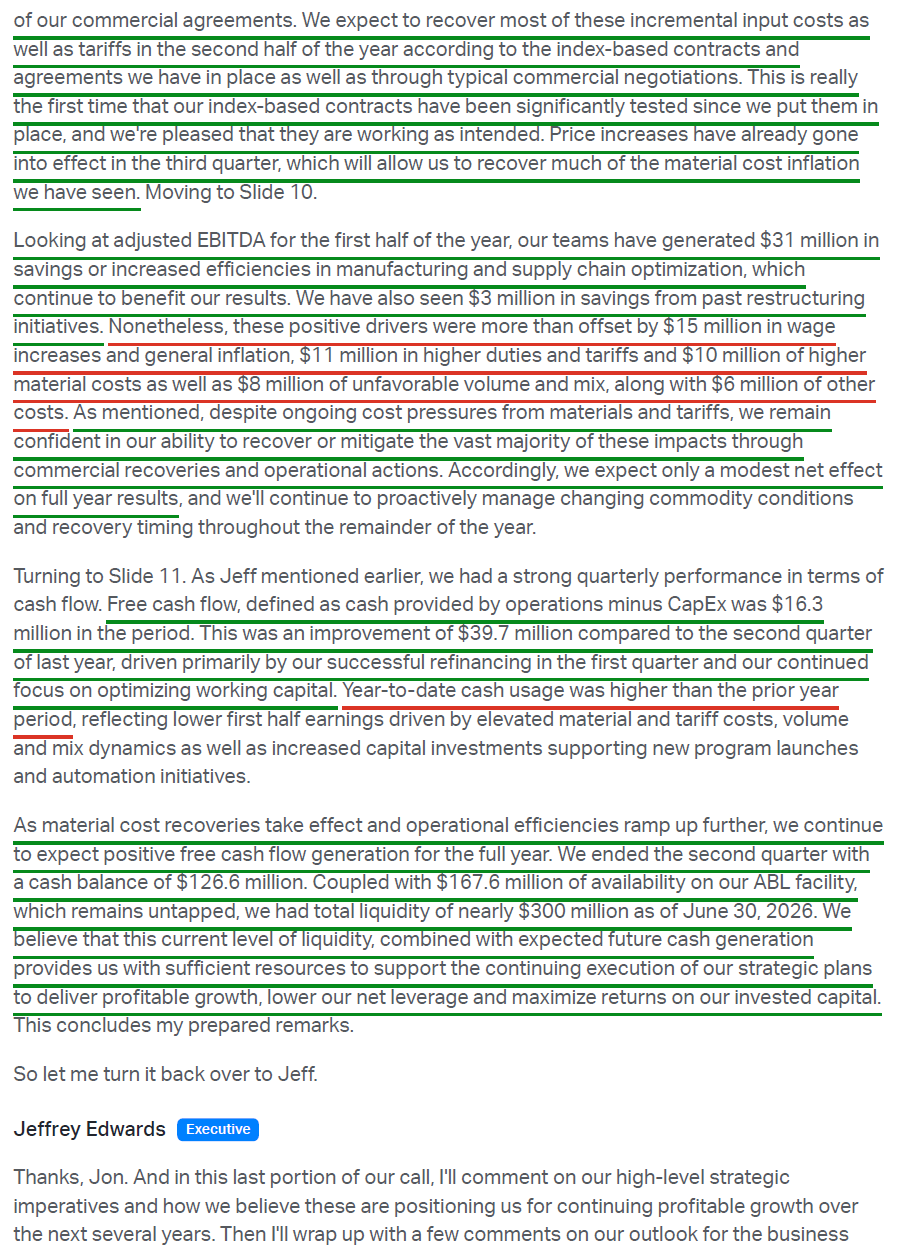
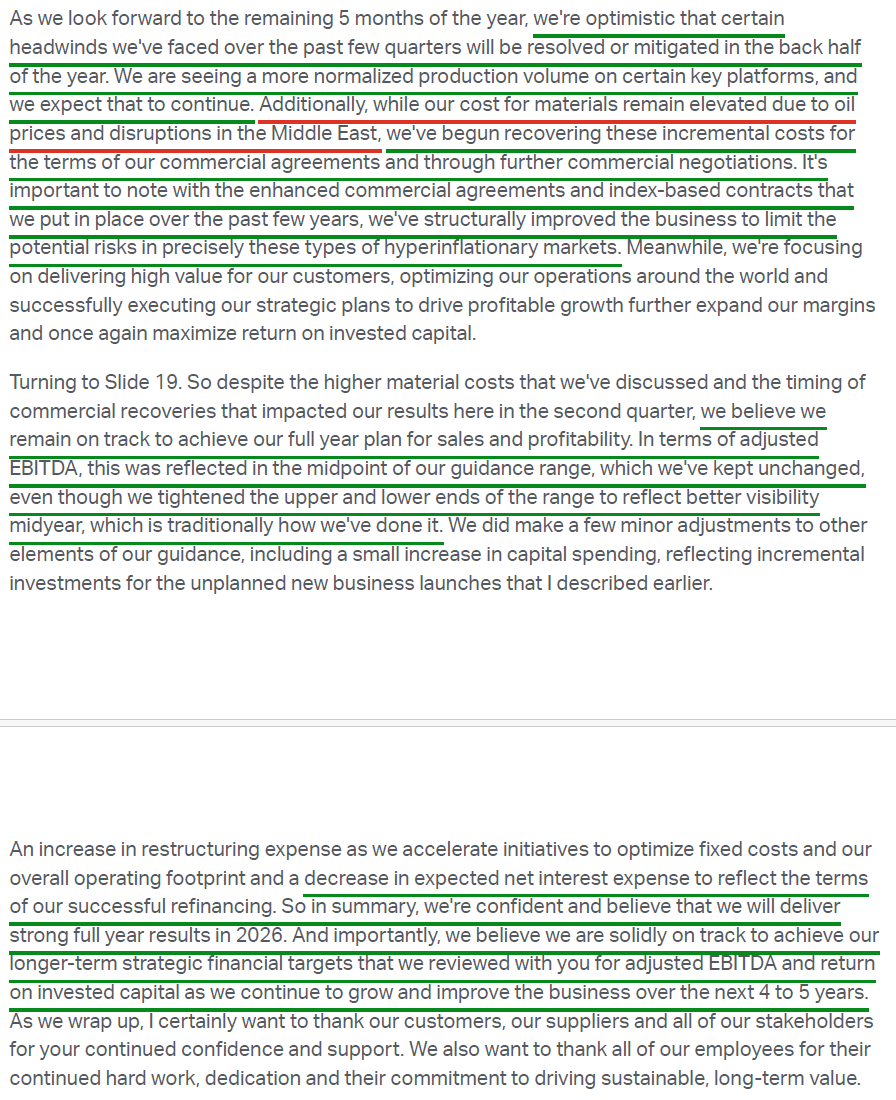
None of this was a surprise. Management told us on the Q1 call, in plain English, that the second quarter would take the hit and the back half would recover it, because that is precisely how the index-based commercial agreements are structured. CPS has spent years rebuilding its commercial book around those contracts, with north of 70% of the exposure now covered contractually and the remainder negotiated on a rolling basis. The indices reset quarterly, meaning CPS absorbs the input cost inflation when it hits and claws it back from the customer in the period that follows. That is exactly what is now underway, with price increases going into effect across all purchase orders on July 1.
More importantly, this was the first significant test those agreements have faced since being put in place, and they are working exactly as intended, with management noting that customers have lived up to every single deal. That is the part deserving far more attention than it is getting. A commodity shock of this magnitude used to take a permanent bite out of a leveraged supplier like CPS. Today, it is nothing more than a timing difference between two quarters, a fundamental de-risk that we are watching play out in real time.
The market, in typical shoot-first, ask-questions-later fashion, got head-faked by the headline “miss” anyway, treating CPS as a show-me story. Show me the recoveries, show me the margins, show me the volumes.
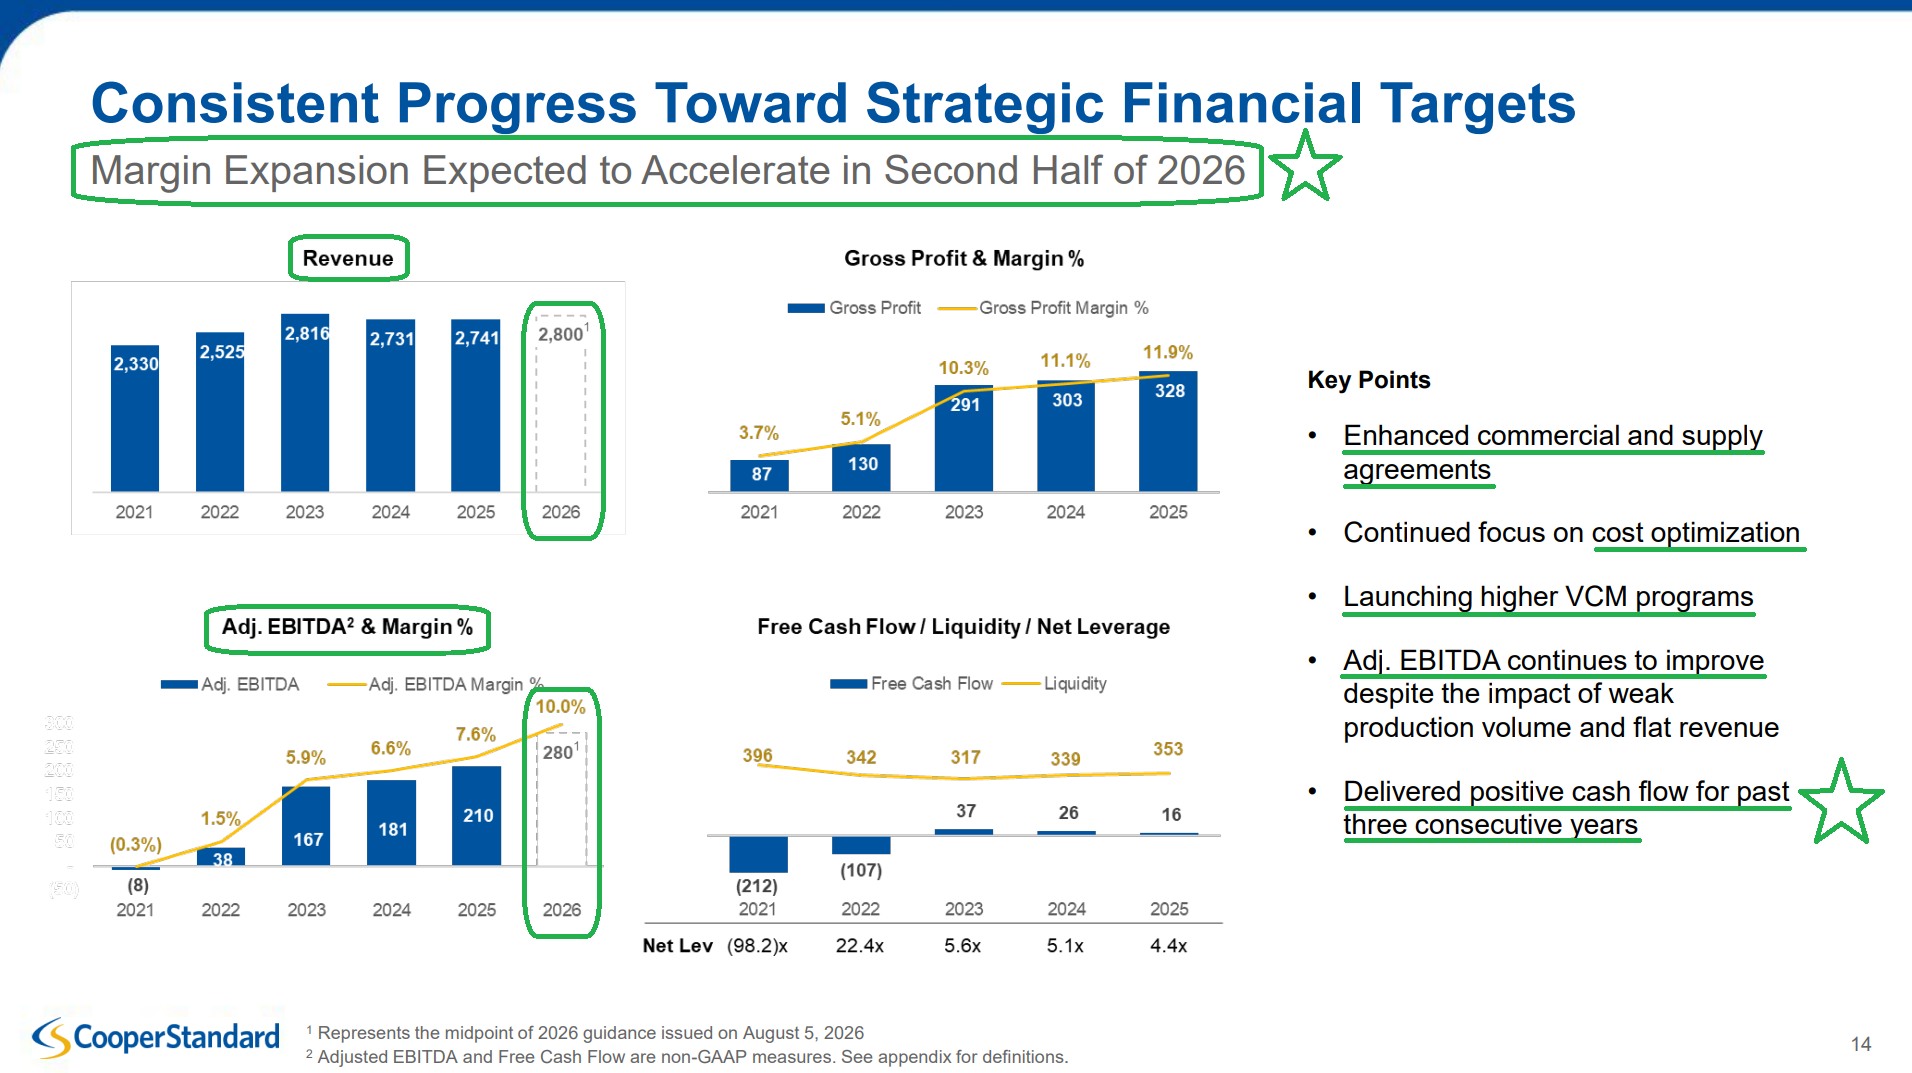
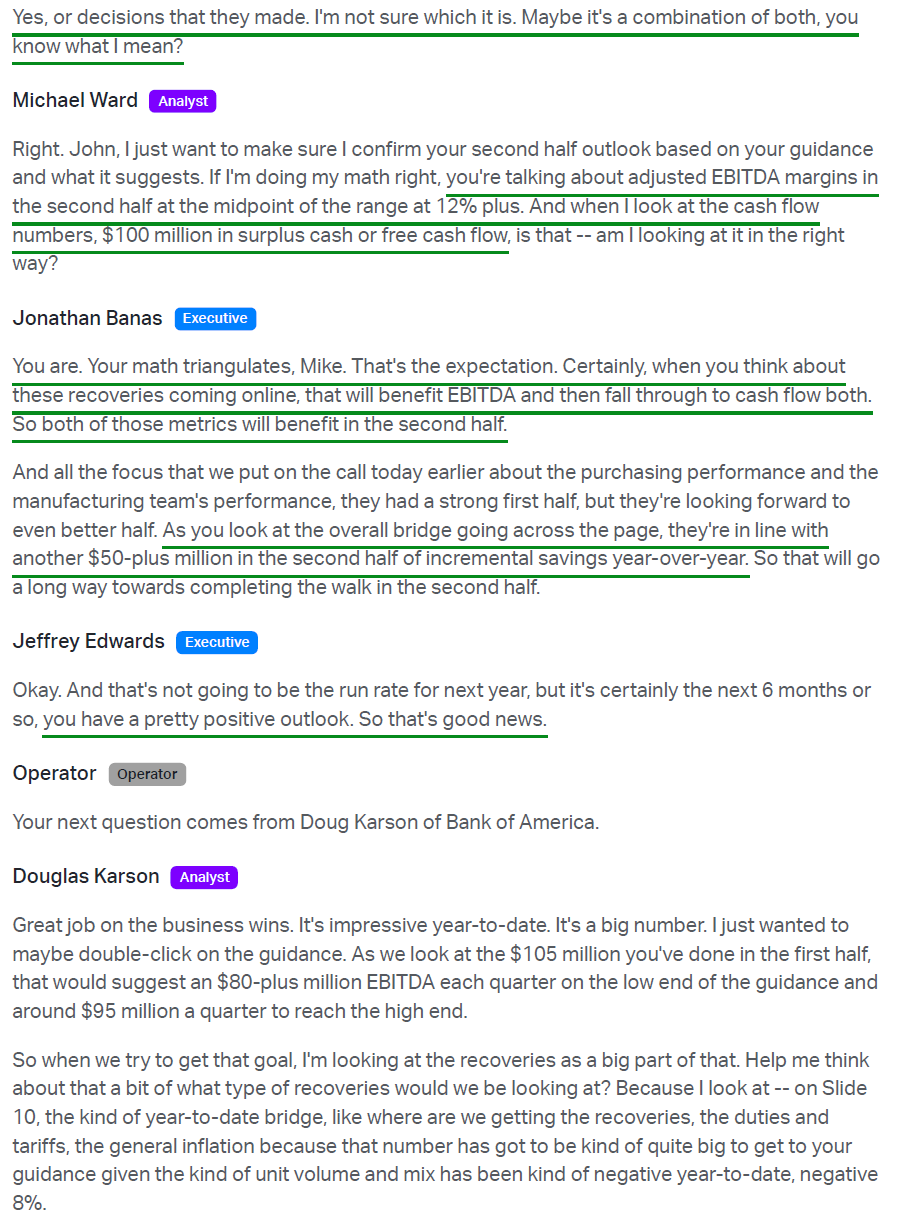
Meanwhile, because the recoveries are contractual rather than hoped for, management has a direct line of sight to recovering the vast majority of the cost pressures ($10M materials and $11M duties and tariffs YTD) in the back half. By maintaining the midpoint of the full-year $280M adjusted EBITDA (+33% Y/Y growth) guide while hiking the low end (to $265M from $260M), the implied back half requires ~12.6% adjusted EBITDA margins in each quarter, alongside ~$100M of cumulative free cash flow in 2H. That gets CPS to its long-awaited double-digit margin target while marking a fourth consecutive year of positive free cash flow generation.
Tip of the cap to management for delivering on these targets despite a seemingly endless stream of headwinds, from tariffs and hyperinflation to war and customer supply chain disruptions. Through it all, they have continued to control what they can control.
Beyond this world-class execution, the market continues to overlook three catalysts moving decisively in Cooper Standard’s favor.
First and foremost: new business awards.
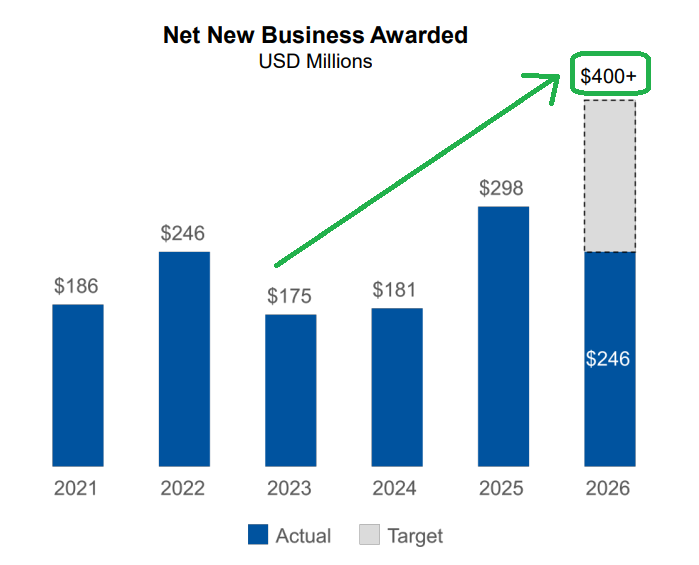
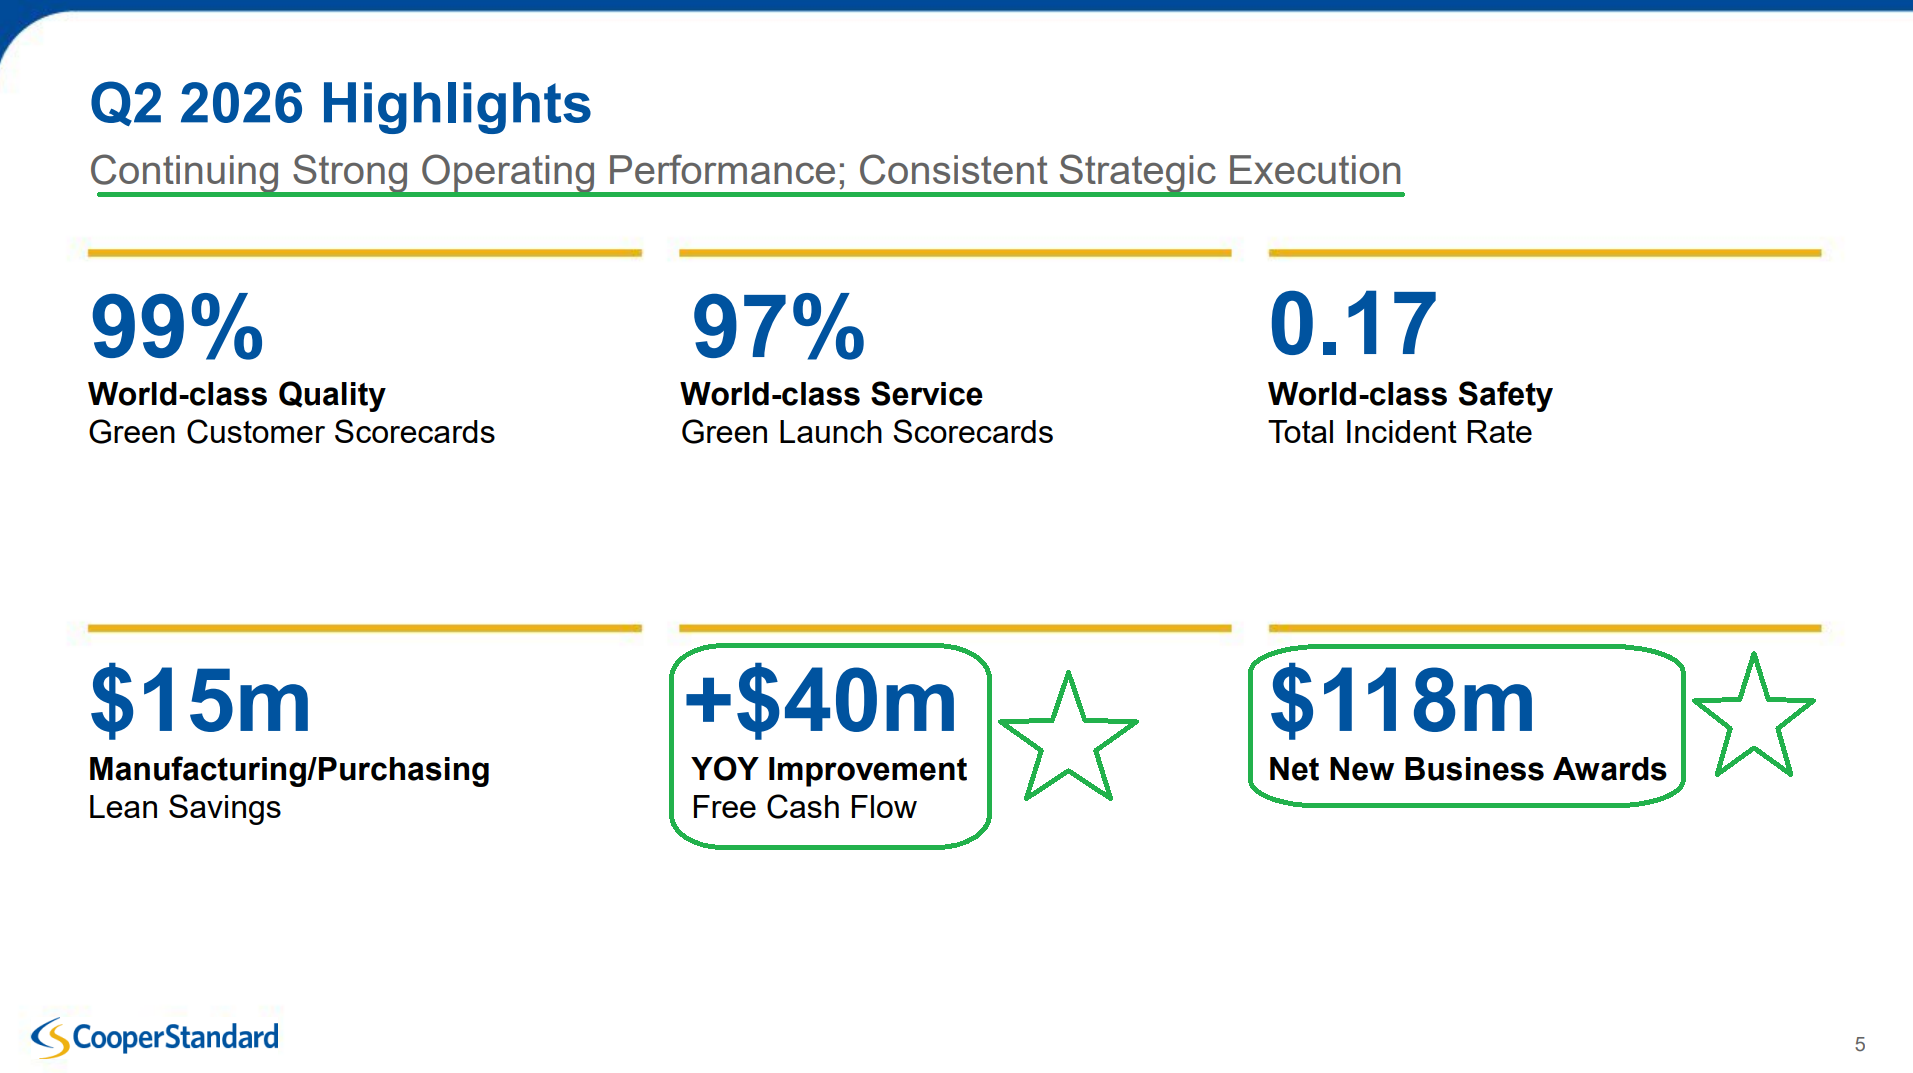
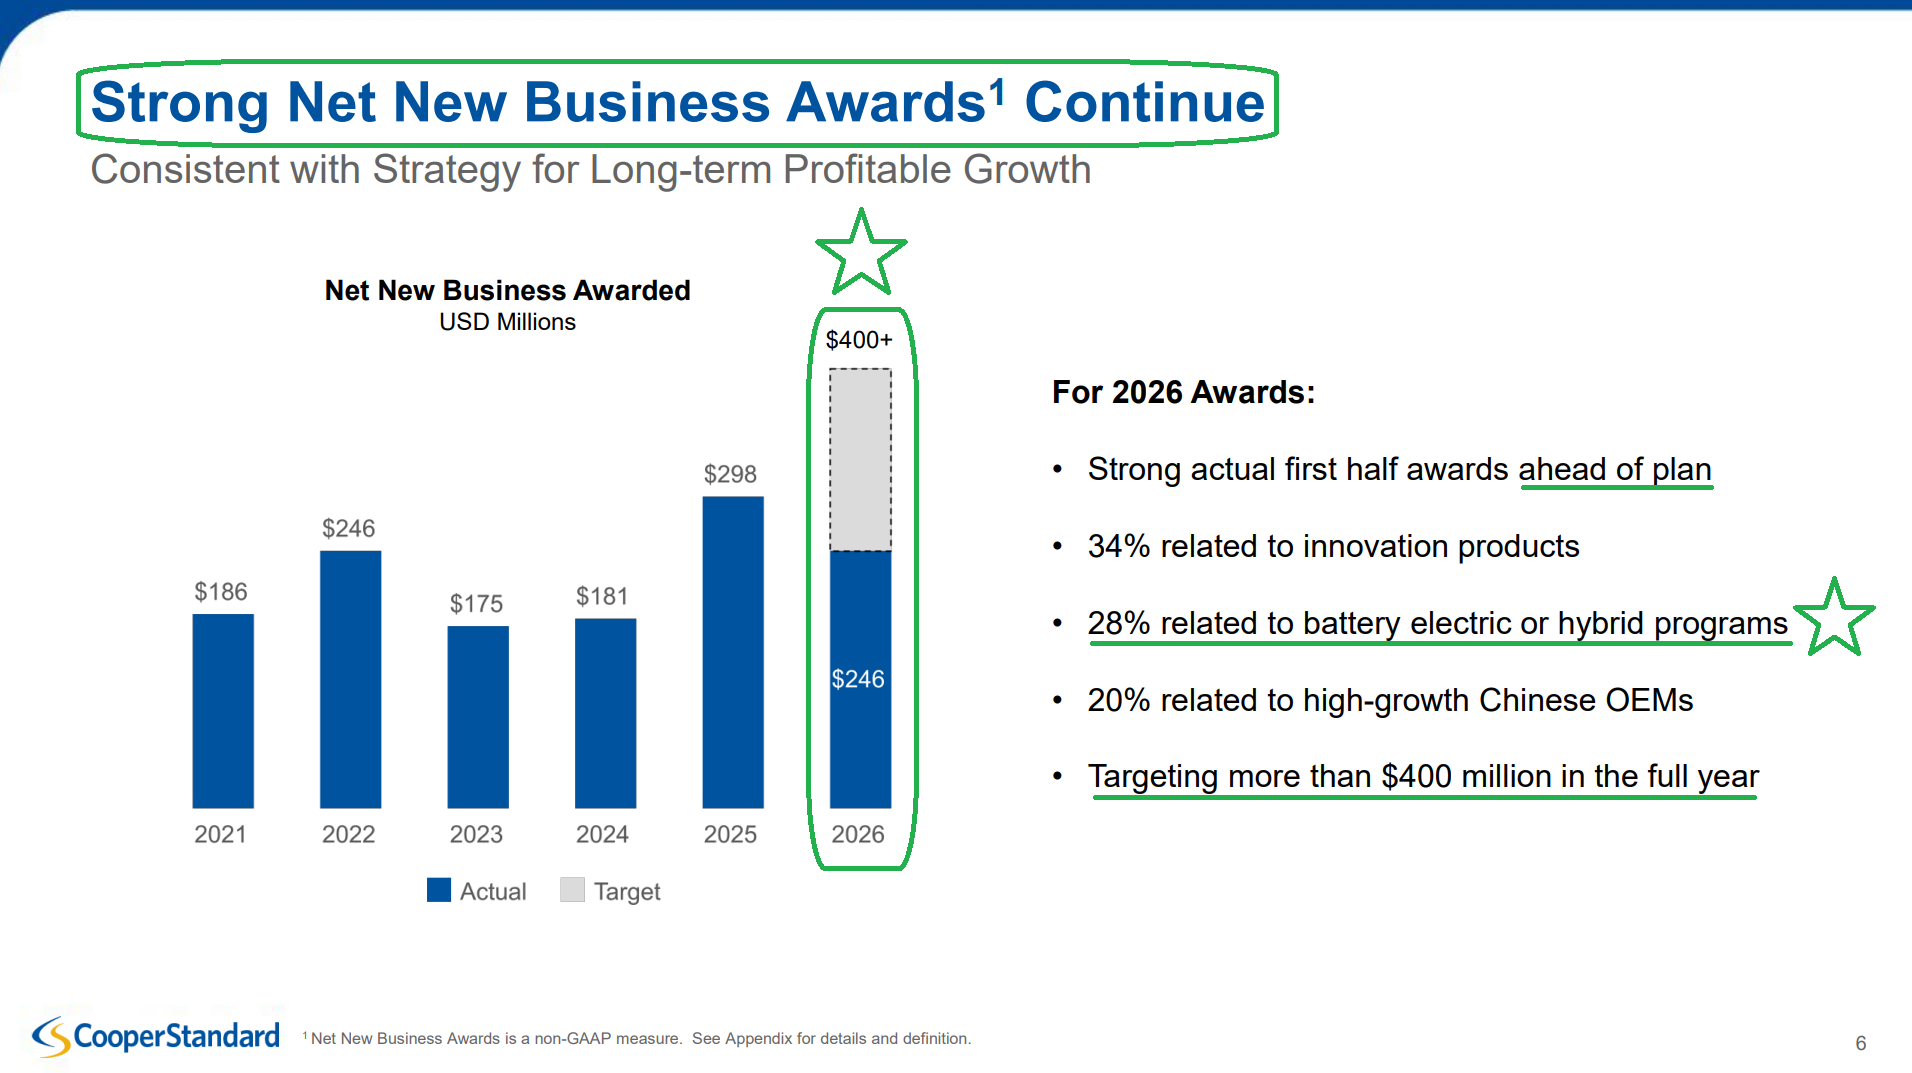
This is the #1 leading indicator of growth over the next 24-to-36-month window, and it’s hitting another gear. CPS booked another $118.4M (+54% Y/Y) of net new business wins in Q2, bringing 1H wins to $246.3M, up 87% year over year. This accounts for ~83% of all of FY25’s haul in just six months and is running well ahead of plan against a $400M+ full-year target, levels not seen since 2019. Better yet, these wins carry far higher margins than the programs they are replacing, with management once again confirming that the company already has the capacity to launch most of them with minimal incremental capital investment, a key driver behind its expectation of tripling ROIC by FY28.
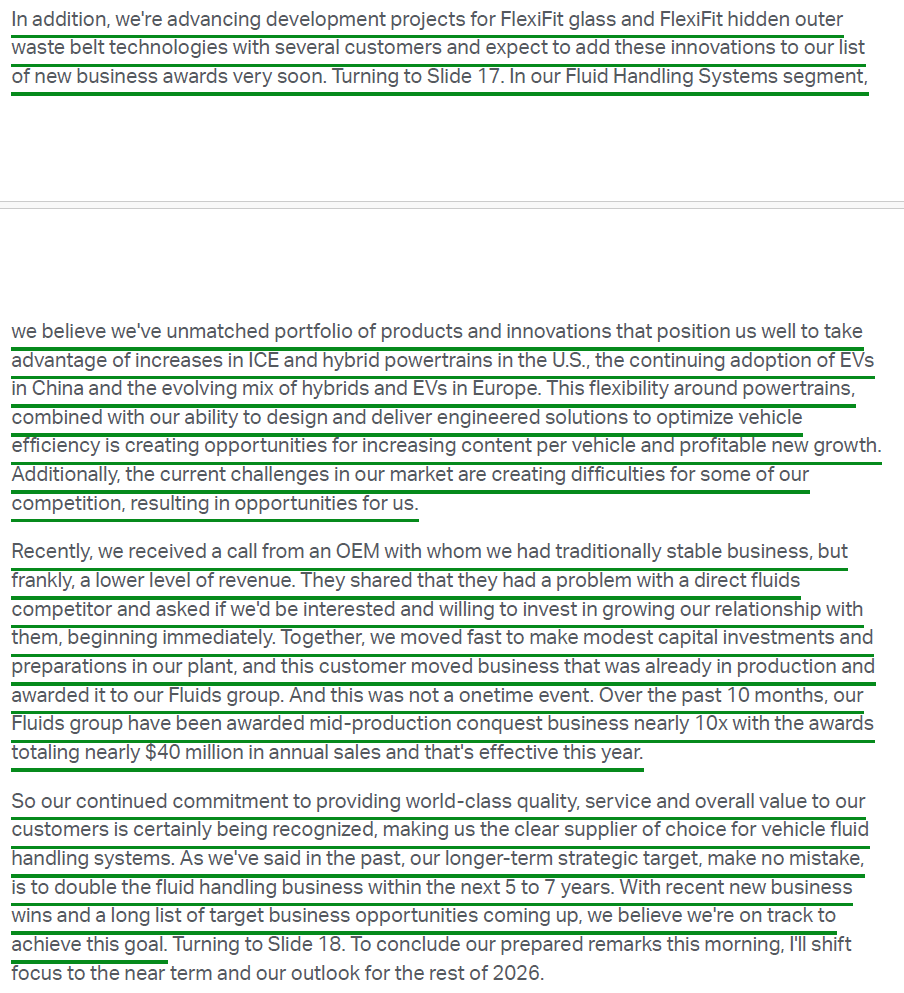
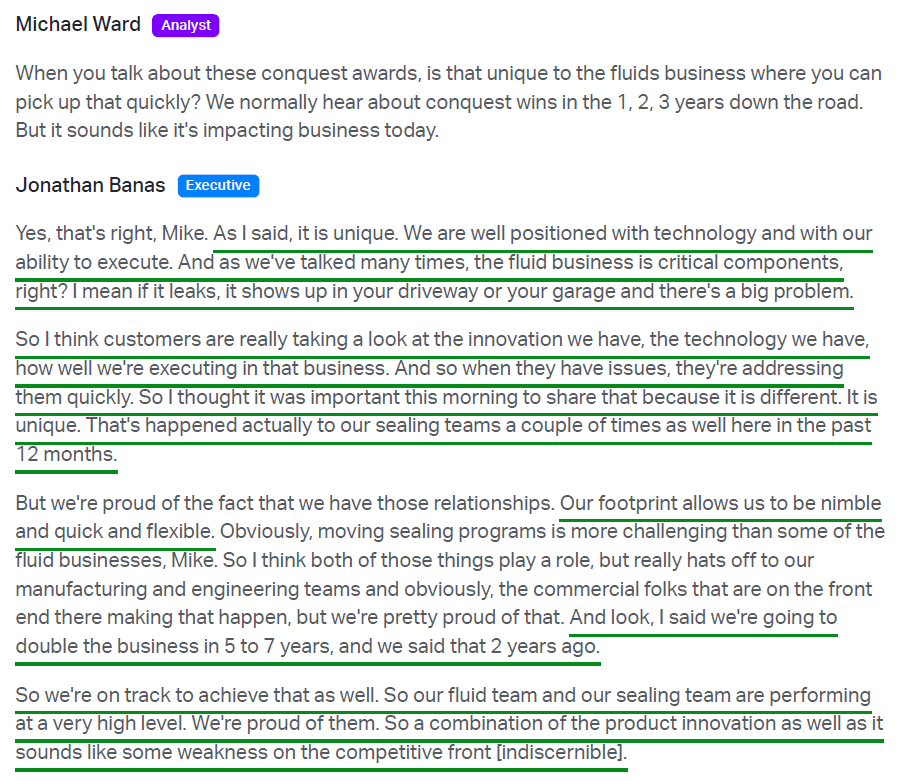
A solid portion of these wins, and another underappreciated point management highlighted on the call, came from conquest business. Over the past ten months, the Fluids group has been awarded mid-production business nearly ten times, totaling ~$40M in annual sales effective this year rather than on the usual two-to-three-year ramp, taken directly from a competitor buckling under the same tough conditions CPS is absorbing without a scratch. Management noted the sealing team has seen the same thing happen a couple of times over the past twelve months. This is a direct testament to the innovation and world-class execution that has become synonymous with Cooper Standard as of late, with customers clearly taking notice.
The second key catalyst is hybrid vehicles.
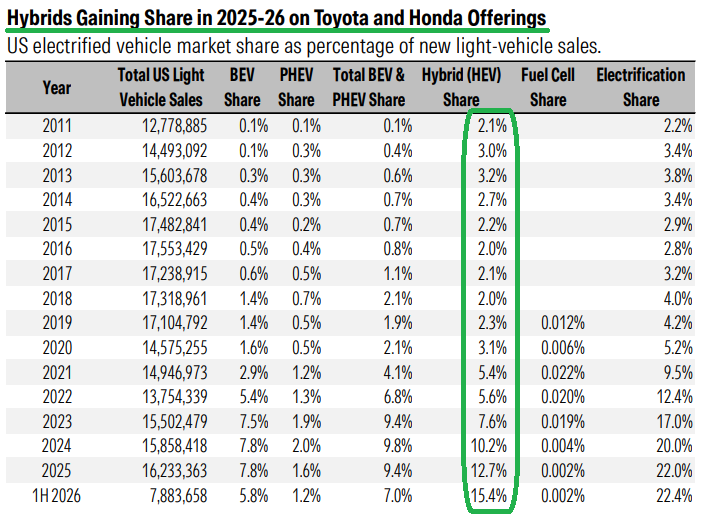
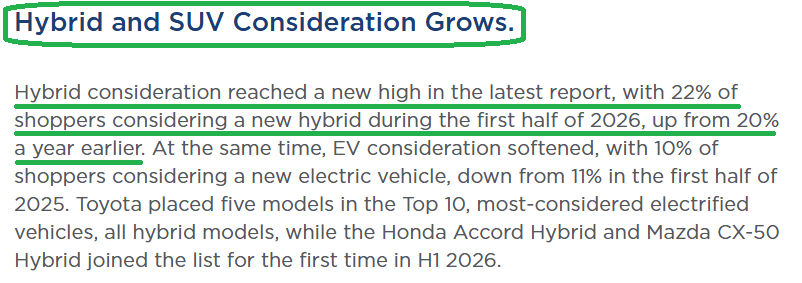
Consumers are voting with their wallets, and the mass market is making itself clear: hybrids are winning. Hybrid sales are up 20.5% year to date and now account for 15.4% of all new vehicles sold, gaining 2.9 percentage points of share in a single year and making hybrids the fastest-growing powertrain in the country. Just as importantly, consideration has reached an all-time high, with 22% of shoppers considering a new hybrid in the first half, up from 20% a year earlier.
Elevated gas prices have only amplified the trend, with 56% of in-market shoppers saying rising prices at the pump make them more likely to consider a hybrid or plug-in hybrid (source: Cox Automotive).
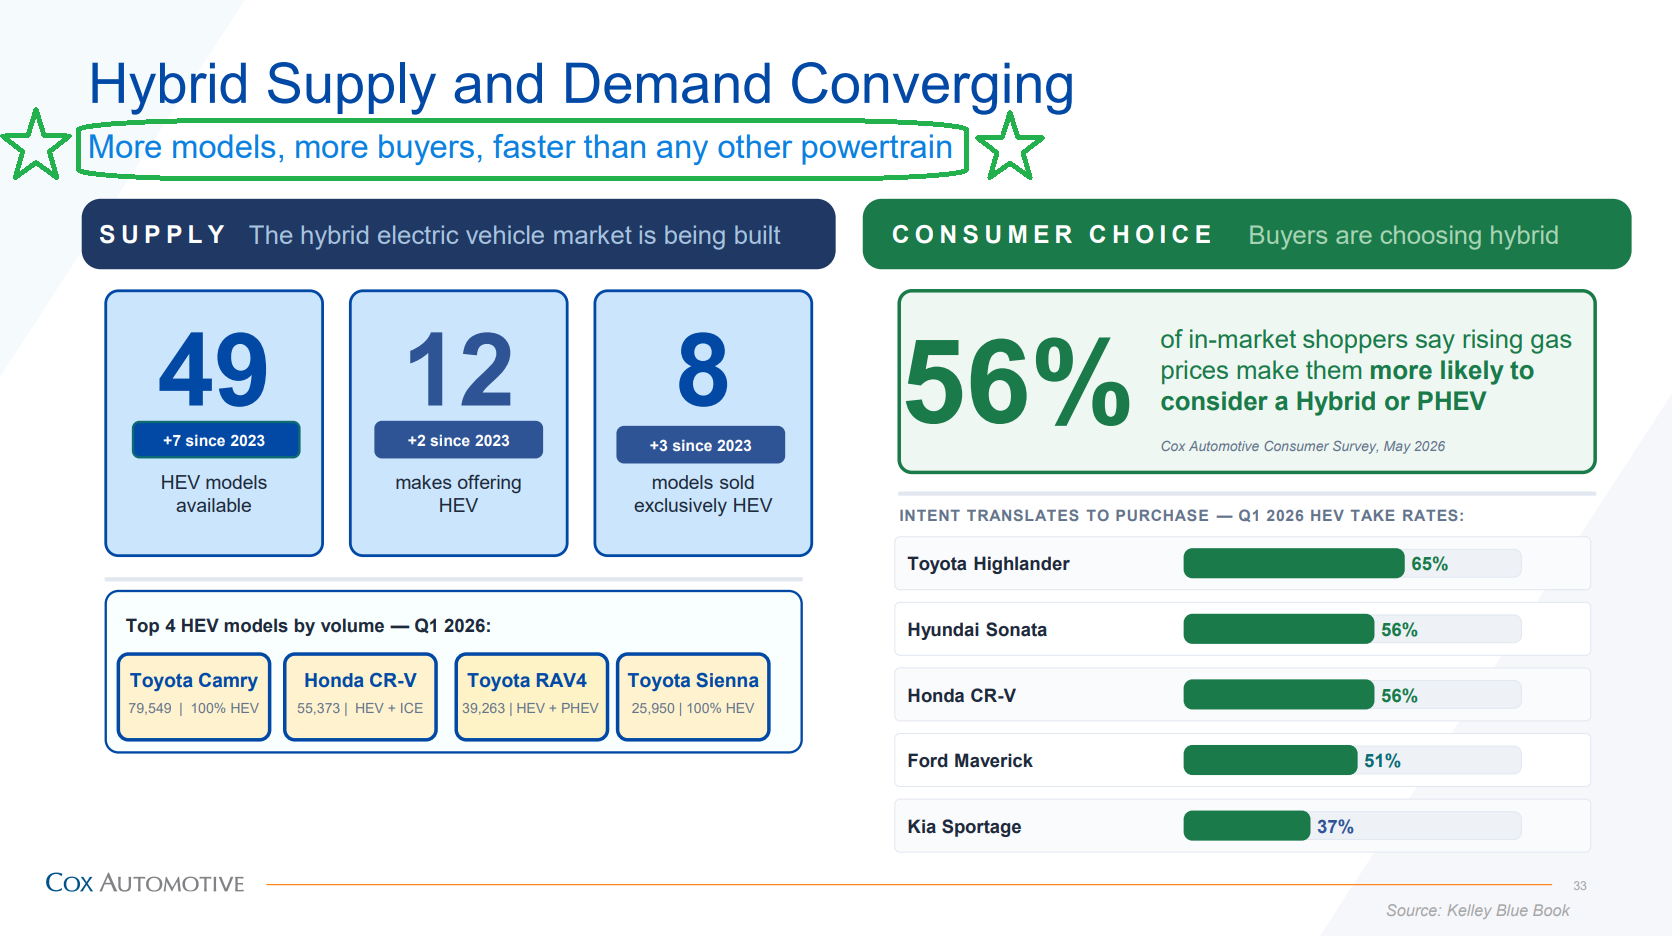
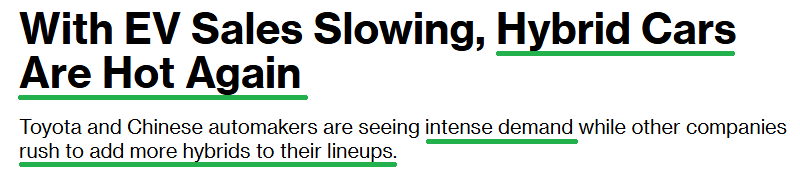
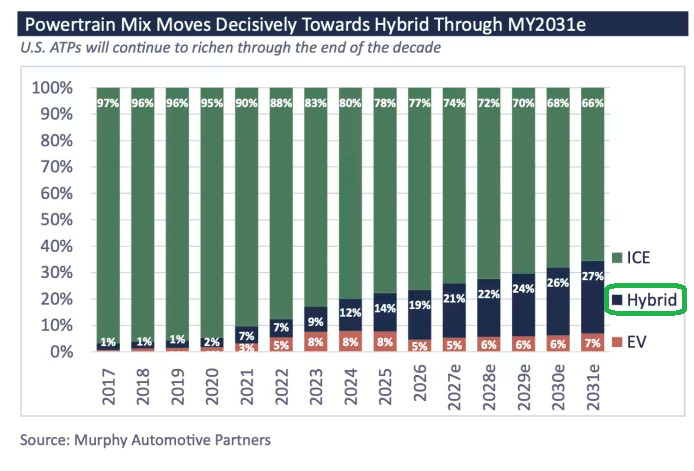
The OEMs are taking notice. Analysts now see hybrids accounting for as much as 40% of global vehicle production by 2030, while the U.S. hybrid powertrain mix is expected to nearly double to ~27% of sales over the next five years.
Ford (CPS #1 customer, 27% of sales) put it plainly: “Hybrids are another strength for Ford we plan to build on. The F-150 Hybrid leads among full-sized trucks and the Maverick Hybrid achieved record sales in the first half to become America’s best-selling hybrid pickup. We plan to extend our hybrids across our entire lineup over the next several years.”
Toyota has gone even further, with the U.S. head of product planning stating that “For all of the vehicles we are developing, the base assumption right now is that it should be 100% hybrid.”
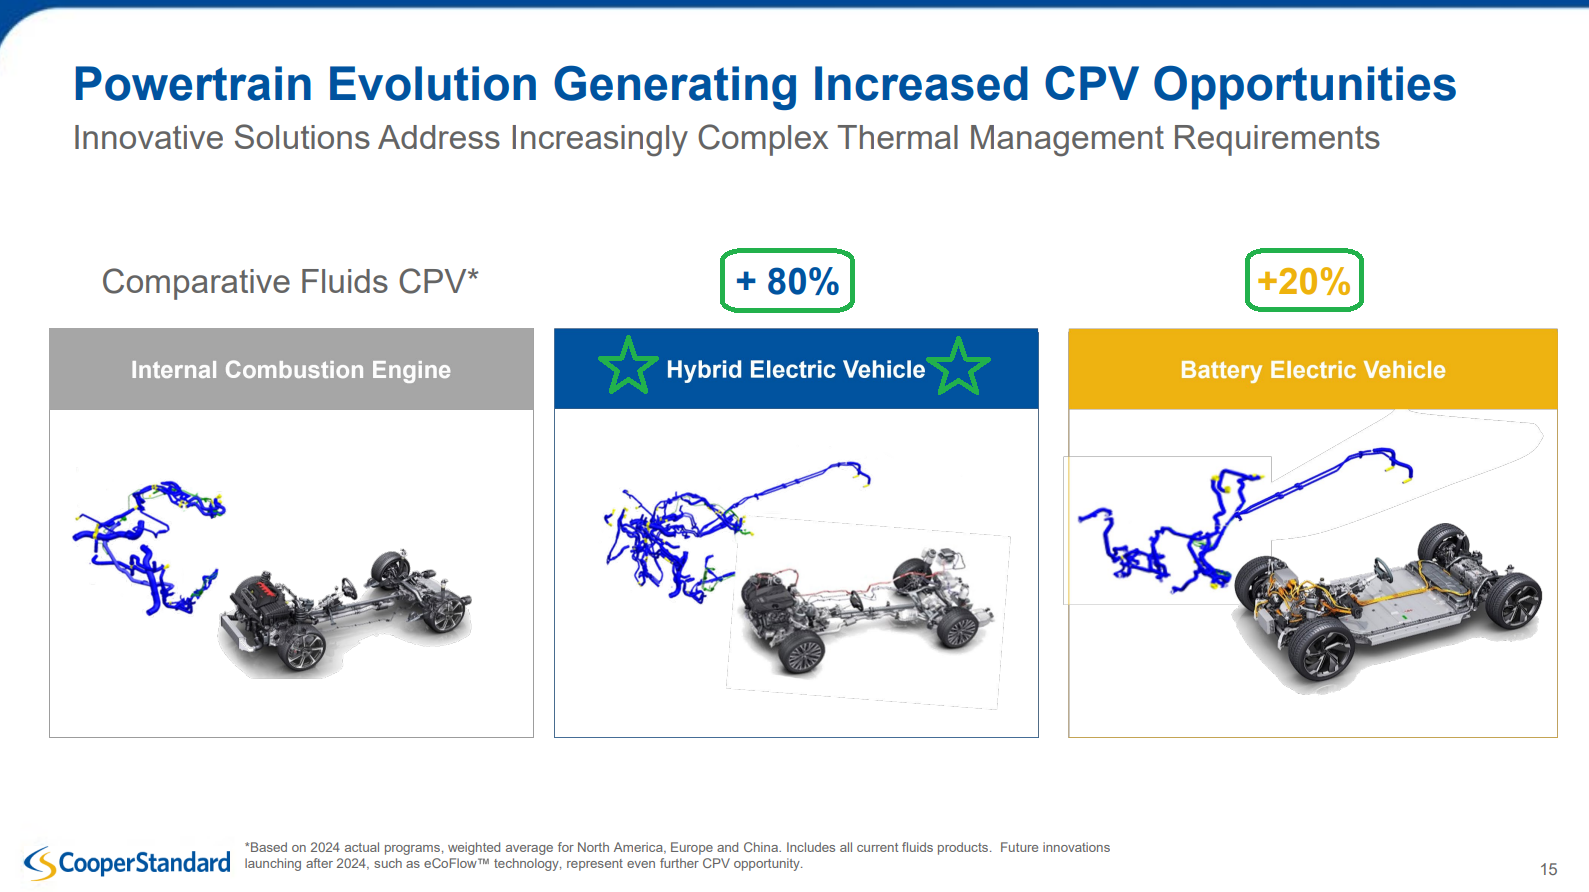
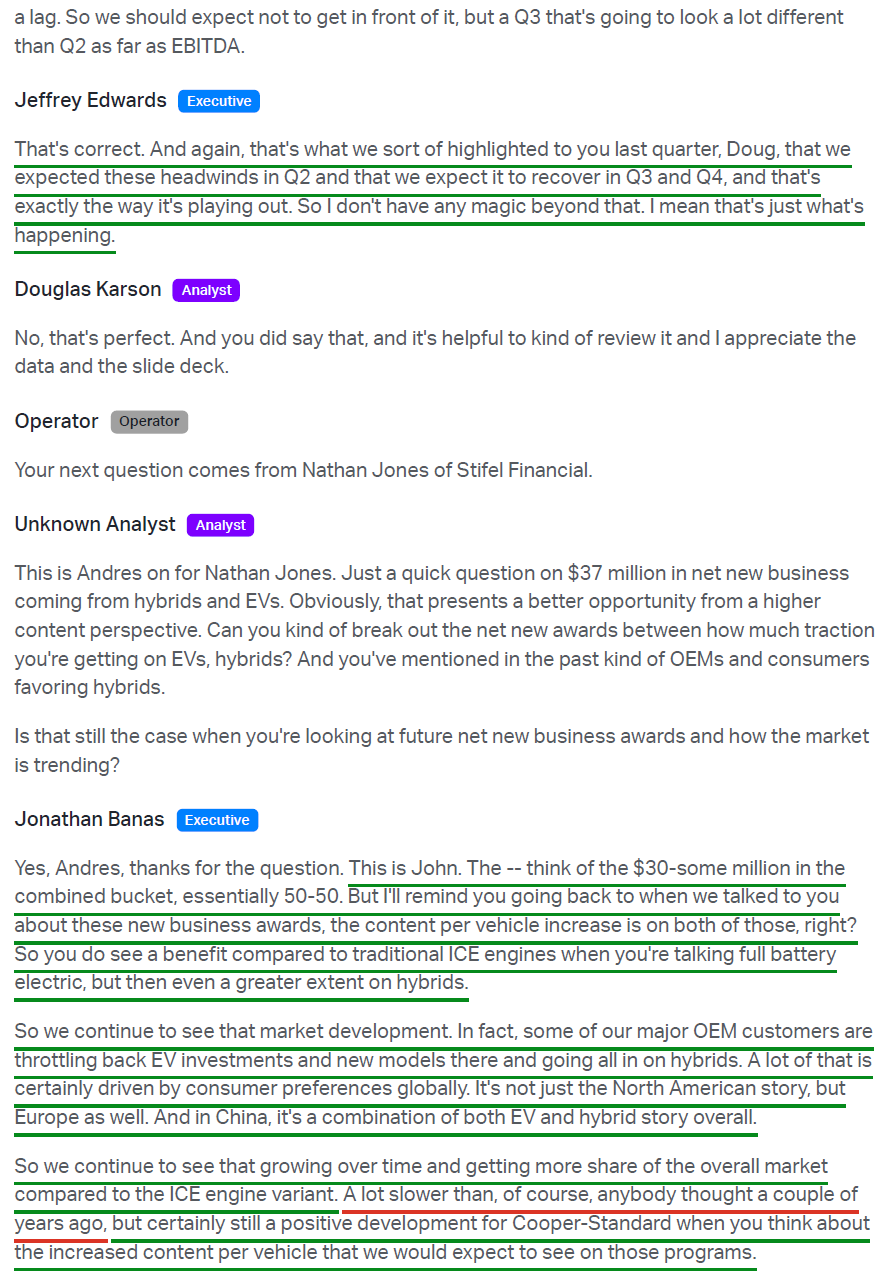
For Cooper Standard, hybrids are the sweet spot, carrying ~80% more content per vehicle than a comparable ICE platform. EVs are accretive too, though to a lesser extent at ~20% higher CPV. That mix shift is already showing up in the order book, with 74% of 2025 new business wins tied to battery electric or hybrid platforms and 28% of first-half new business awards, split roughly 50/50 between the two.
None of this was part of our original underwriting. The thesis was centered on a recovery in North American ICE production volumes, with the growing hybrid trend only showing up afterward as a free flier and quickly becoming one of the strongest tailwinds the company has going for it.
Third, and why we expect some solid upside to CPS’s full-year figures, is the writing on the wall for an F-150 production ramp in 2H.
While Ford is by far Cooper Standard’s largest customer at 27% of revenue, the F-150 is its single most valuable platform, carrying ~$450 of CPV (vs. ~$190 on average across the top 10 platforms) and an estimated ~10% of overall company sales. That concentration worked against CPS last year when the Novelis fire idled ~40% of North American sheet aluminum supply and halted F-150 production, a disruption that carried into the first half of this year. That is now behind them, and everything coming out of Ford management points toward a significant production ramp in the back half.
F-150 retail day supply exited the second quarter at 52, below Ford’s target range of 55 to 65, with the rebuild toward those levels expected as the recovery progresses. Between making up the ~100K units lost to the Novelis disruption and the ~50K of planned growth layered on top, the math puts F-150 production ~150K units above 2025 levels, with the bulk of it landing in the back half. On top of that sits the Oakville expansion, which adds ~100K units of incremental Super Duty capacity and remains on track to launch in the fourth quarter. As Ford put it, “You’ve got the Super Duty and you have the F-Series that are going to be coming back in full force for the second half of the year.”
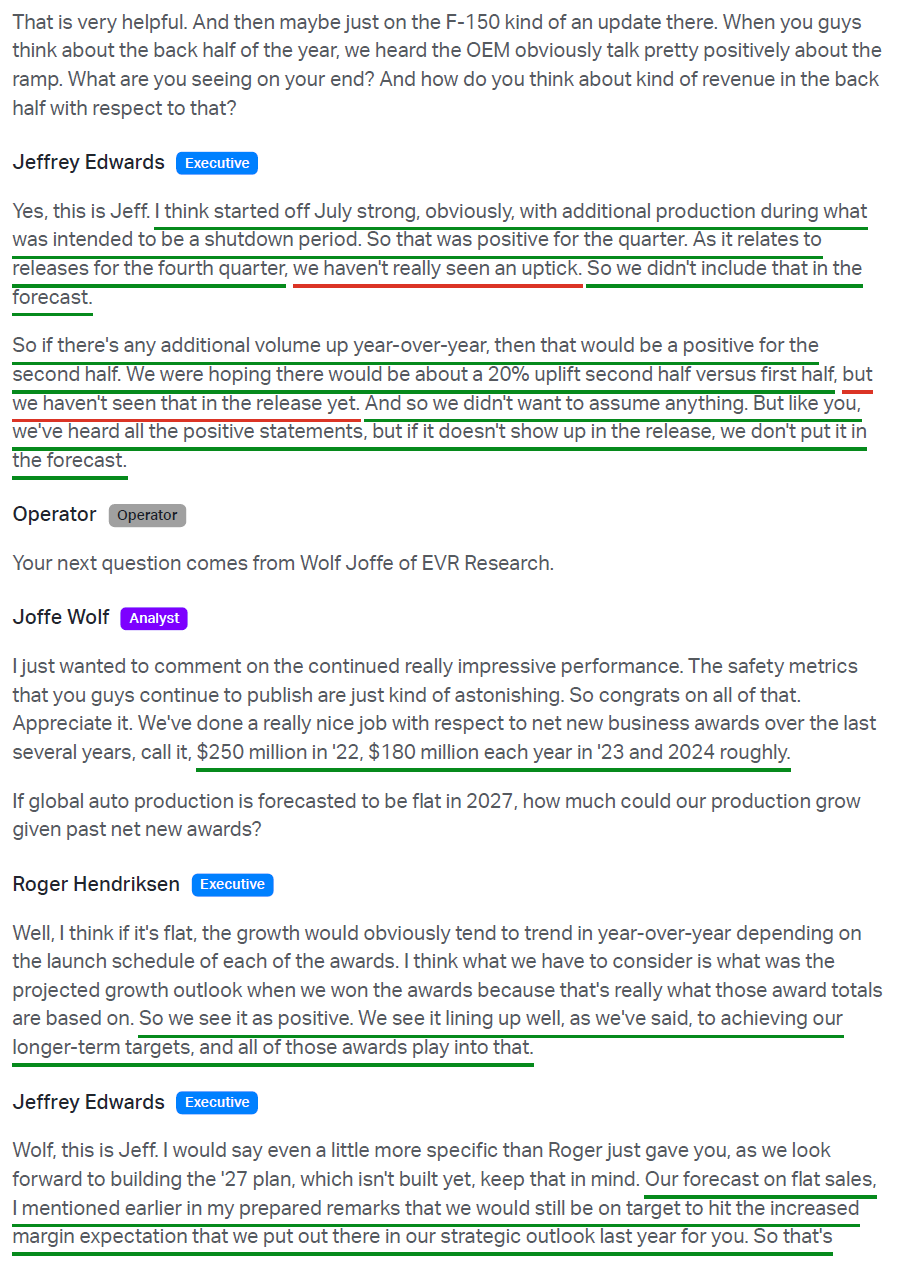
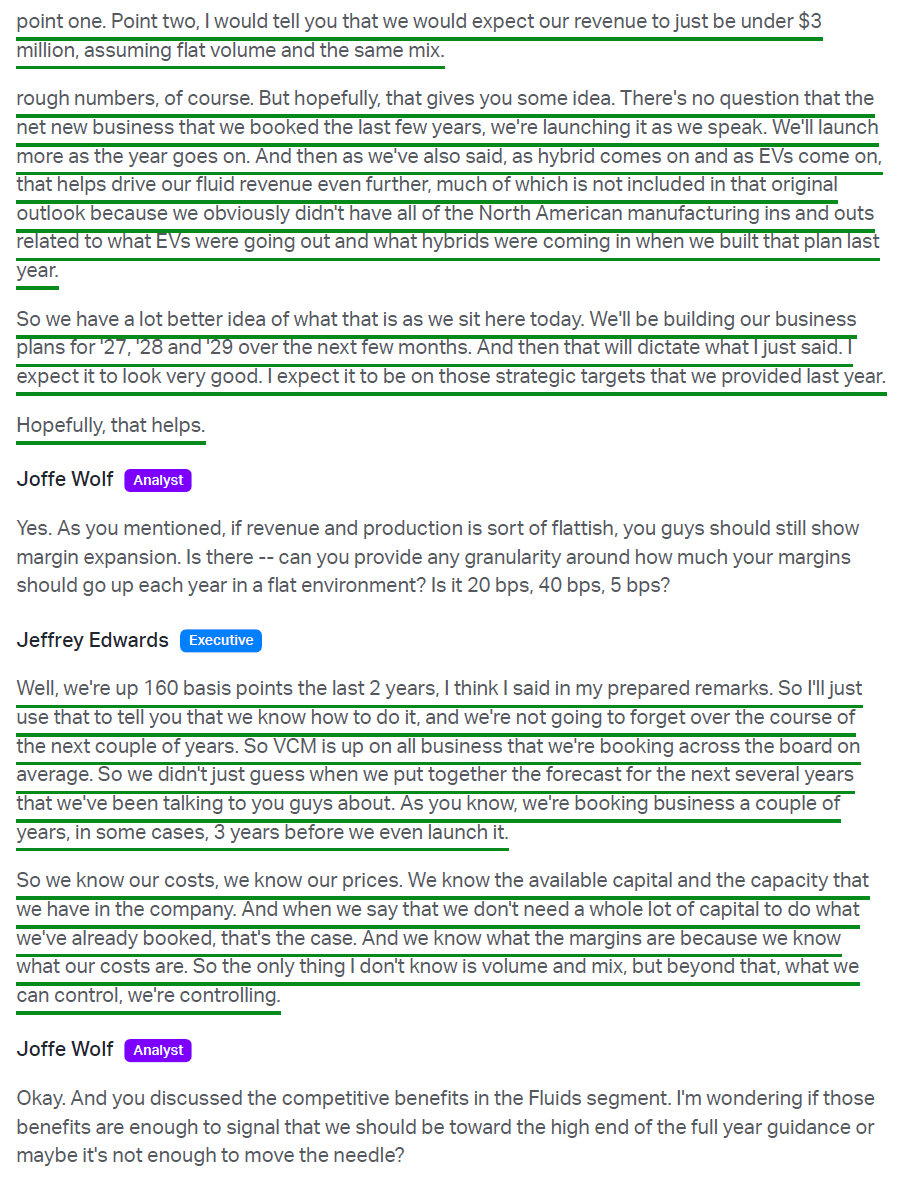
None of this incremental production is reflected in Cooper Standard’s guidance. Management was direct on the call, saying they are hoping for a ~20% uplift in the second half versus the first, but have not yet seen it show up in the releases and, as management put it, “if it doesn’t show up in the release, it doesn’t go in the forecast.” In other words, investors get a free option on incremental production and the earnings upside that comes with it, on top of a guide the company already has strong visibility into reaching.
Keep in mind, all of this is happening before overall volumes have even started to help.
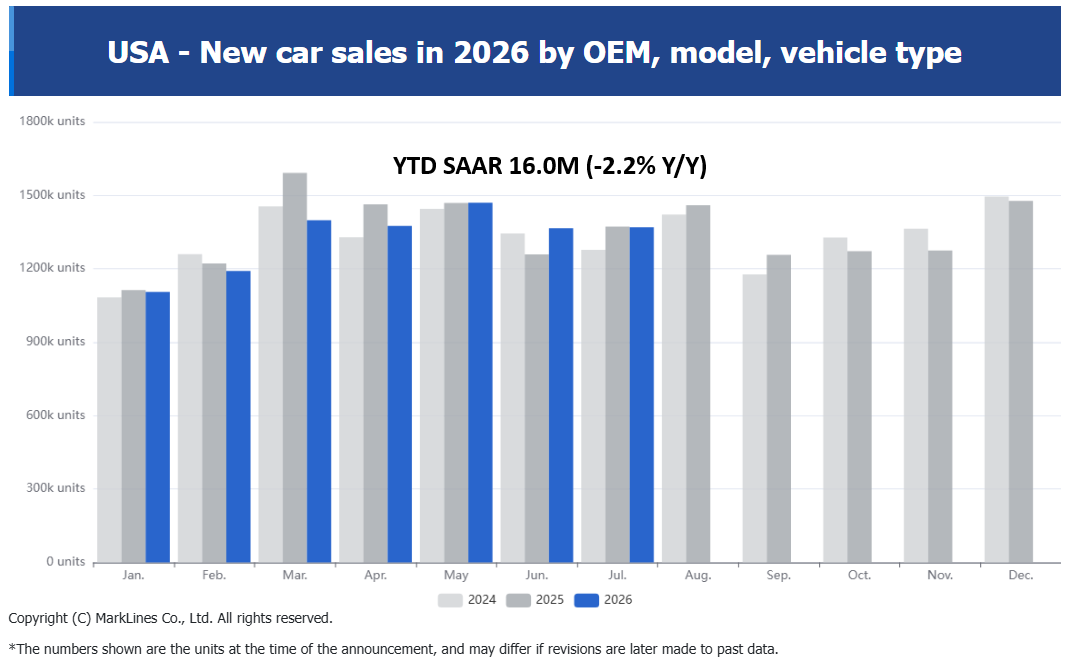
July SAAR came in at 16.3M, down 1.4% year over year, with the YTD pace at 16.0M, down 2.2%. Encouragingly, Ford continues to assume U.S. SAAR of 16 million to 16.5 million units, while GM is baking in the “low 16 million unit range,” suggesting a potential back-half sales acceleration.
The bigger point is that every basis point of margin progress at this company over the past handful of years has been self-generated, with zero assistance from the cycle.
The good news is that the structural case only gets stronger the longer this goes on, with key catalysts including an all-time-high average vehicle age of 14.5 years, the strongest licensed-driver growth in more than 40 years, 70M+ millennials moving through their prime vehicle ownership and family formation years, inventory-to-sales still well below historical averages, and every U.S. auto cycle going back to the 1970s peaking between 17M and 18M SAAR, when the population was ~30% smaller. The beach ball can only stay underwater for so long.
Bottom line, we continue to believe Cooper Standard’s best days are ahead. The market is focused on one quarter of temporary input cost noise while the company’s most important long-term drivers are moving decisively in the other direction. New business is accelerating, hybrids are becoming an increasingly important part of the mix, and F-150 production is poised to recover. Put it all together, and the path to $10+ of earnings power is not only fully intact, but increasingly starting to look conservative.
Q2 Earnings Breakdown
10 Key Points
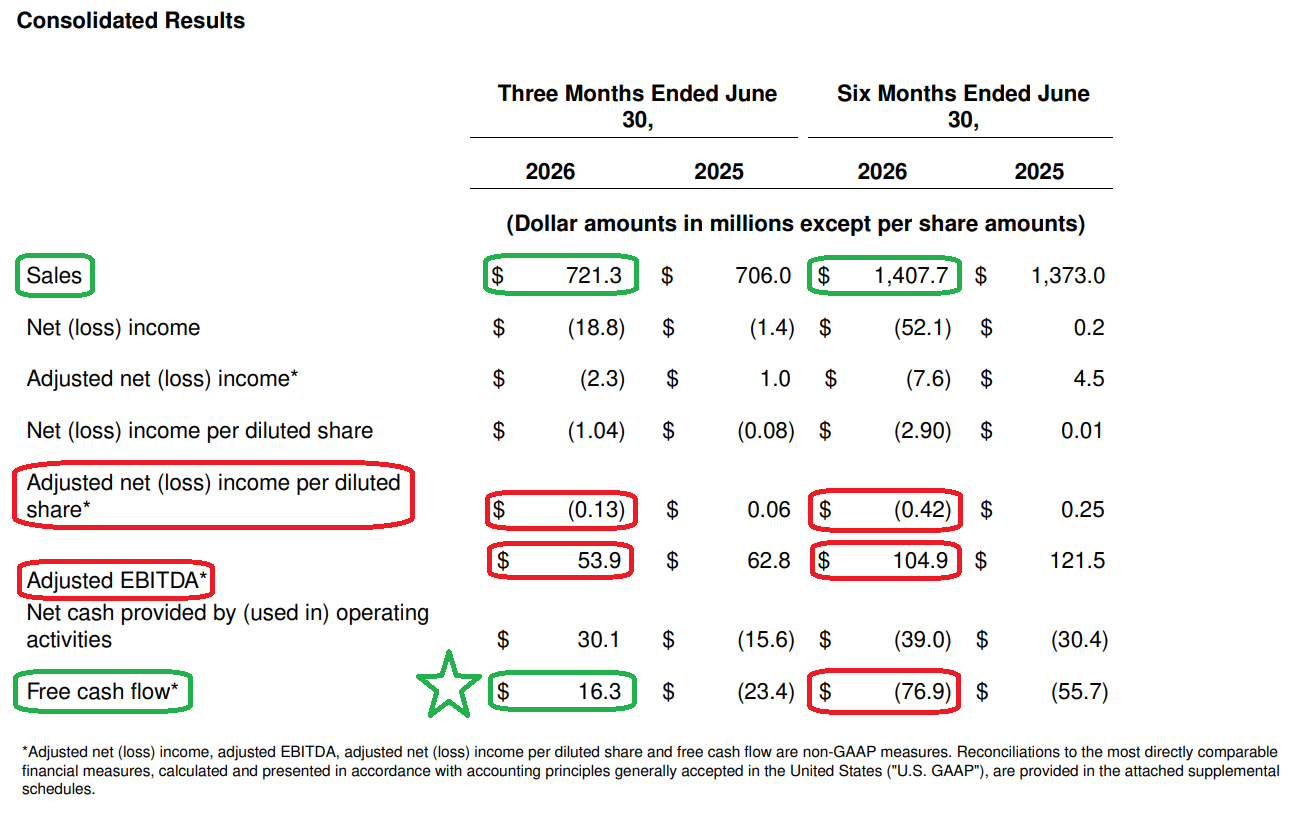
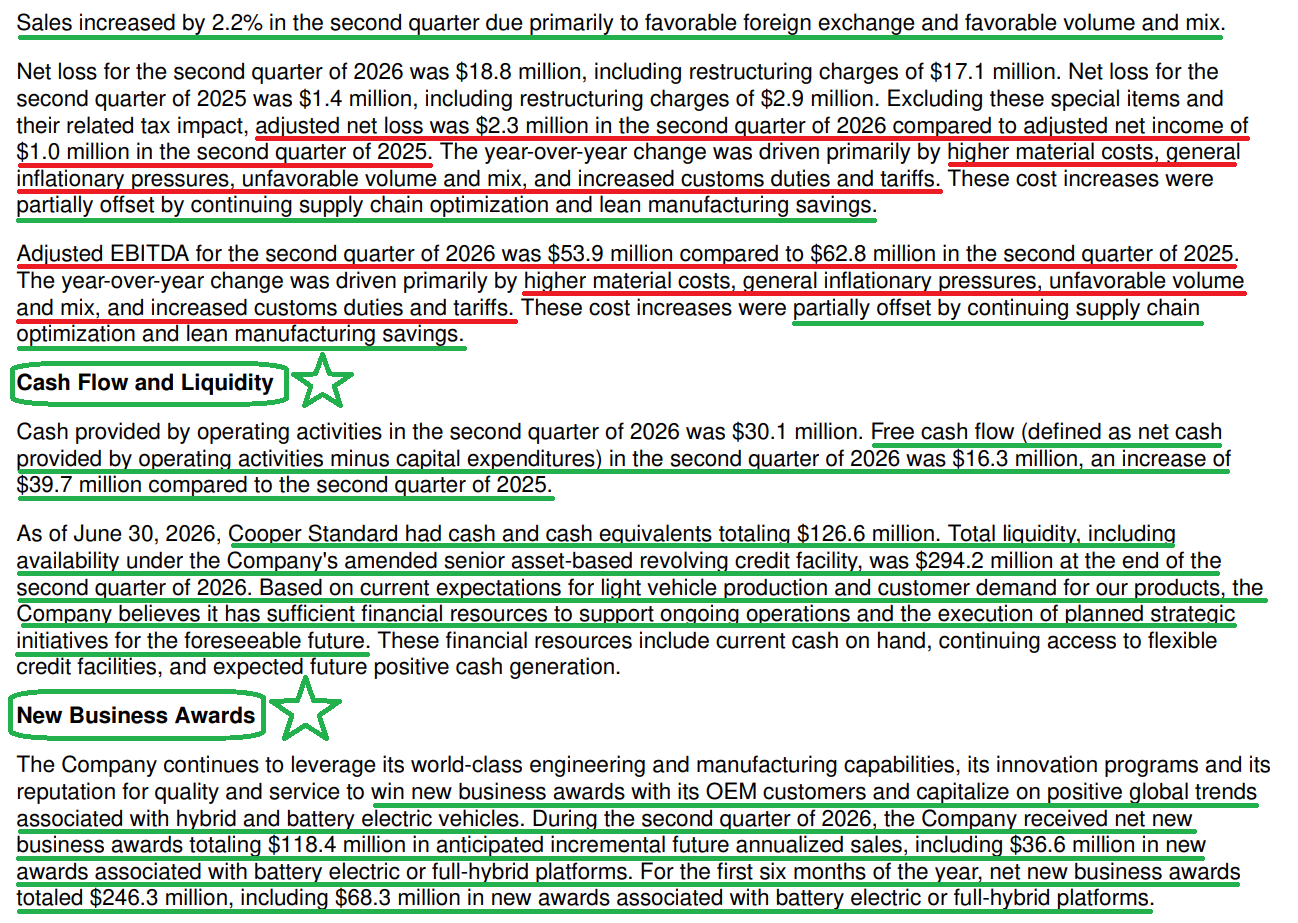
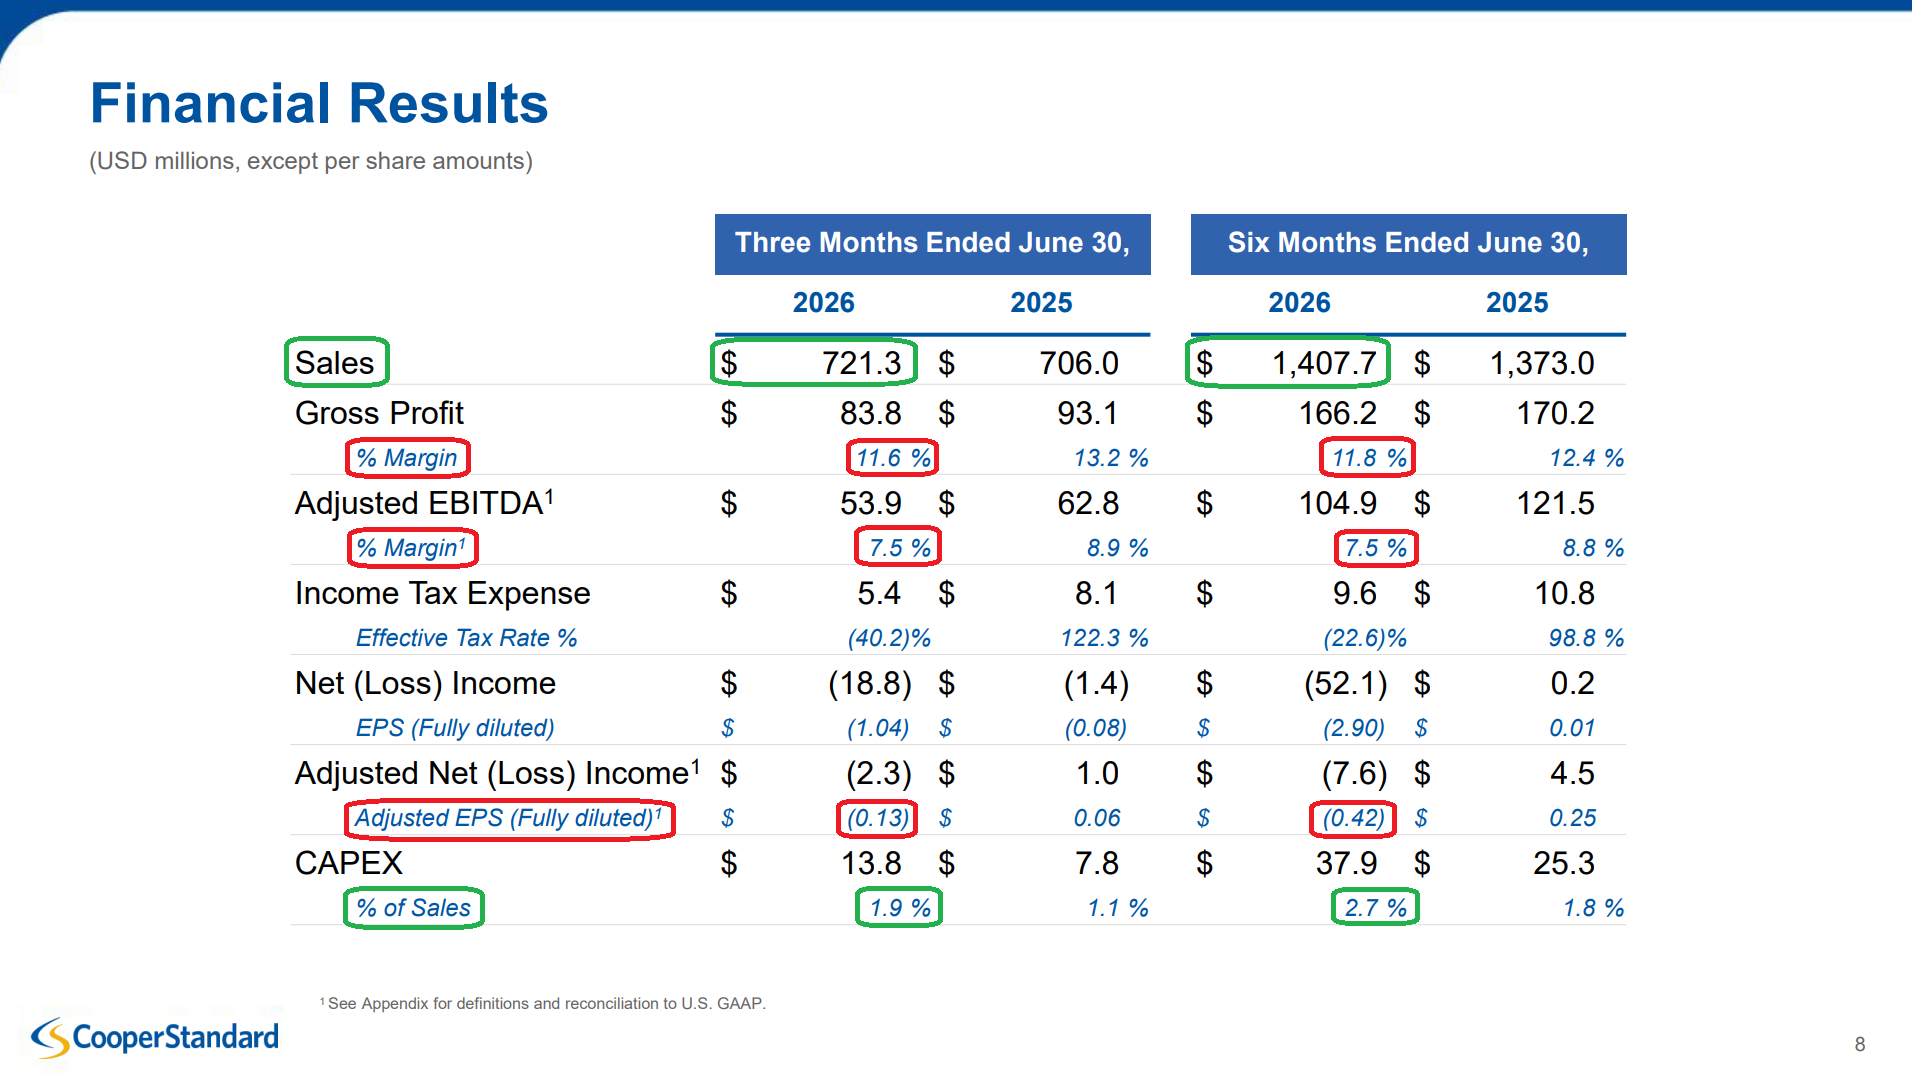
1) Revenue totaled $721.3M (+2.2% Y/Y), beating consensus of ~$710.6M by ~1.5%. The top line was driven primarily by a ~$10M favorable FX tailwind, with a smaller ~$5M lift from favorable volume and mix, net of customer price adjustments and recoveries. First-half sales reached $1.41B (+2.5% Y/Y), also carried mostly by currency.
2) Gross profit came in at $83.8M (-10.0% Y/Y), with gross margins falling ~160 bps to 11.6% from 13.2%. Pressure came from elevated input costs, specifically oil-driven material inflation, general inflation, and higher customs duties and tariffs, the bulk of which management frames as a timing difference recoverable in the back half under its index-based contracts. YTD gross margins stand at 11.8% versus 12.4% a year ago.
3) Adjusted EBITDA totaled $53.9M (7.5% margins), down 14.2% from $62.8M (8.9%) a year ago, with margins falling ~140 bps. Manufacturing and purchasing lean initiatives delivered $15M of savings during the quarter, with favorable FX adding another $2M. Those gains were more than offset by $10M in higher material costs across rubber, metals, and resins, $8M in wages and general inflation, and an additional $8M in higher duties, tariffs, and other costs. YTD adjusted EBITDA of $104.9M (7.5% margins) compares with $121.5M (8.8%), with $31M of manufacturing and supply chain optimization savings plus $3M of restructuring savings banked through six months.
4) Management expects to recover the bulk of the margin pressure in the second half, with ~$21M of the YTD headwind sitting in recoverable buckets, including $11M in duties and tariffs and $10M in materials. Recovery runs through the index-based contracts and enhanced commercial agreements put in place over the past few years, with price increases going into effect across all purchase orders on July 1. This marks the first significant test of those agreements, with management noting they are working as intended and that customers have honored every deal made.
5) Fluid handling systems delivered revenue of $345.3M, up 7.1% from $322.4M a year ago, with adjusted EBITDA of $27.7M (8.0% margins) versus $27.0M (8.4%) in the prior year. Volume and mix drove the top line while adding +$11.8M to segment EBITDA, with FX (-$4.9M) and higher costs (-$6.2M) absorbing most of the gain. On the competitive front, the Fluids group has been awarded mid-production conquest business nearly ten times over the past ten months, totaling ~$40M in annual sales effective this year, taken directly from a competitor experiencing difficulties. These awards convert to revenue immediately rather than on the typical two-to-three-year ramp, with management noting the sealing team has seen the same dynamic a couple of times over the past twelve months. The 2030 target of doubling the business to $2.0B+ in revenue remains on track, along with 16%+ adjusted EBITDA margins and 30%+ return on invested capital.
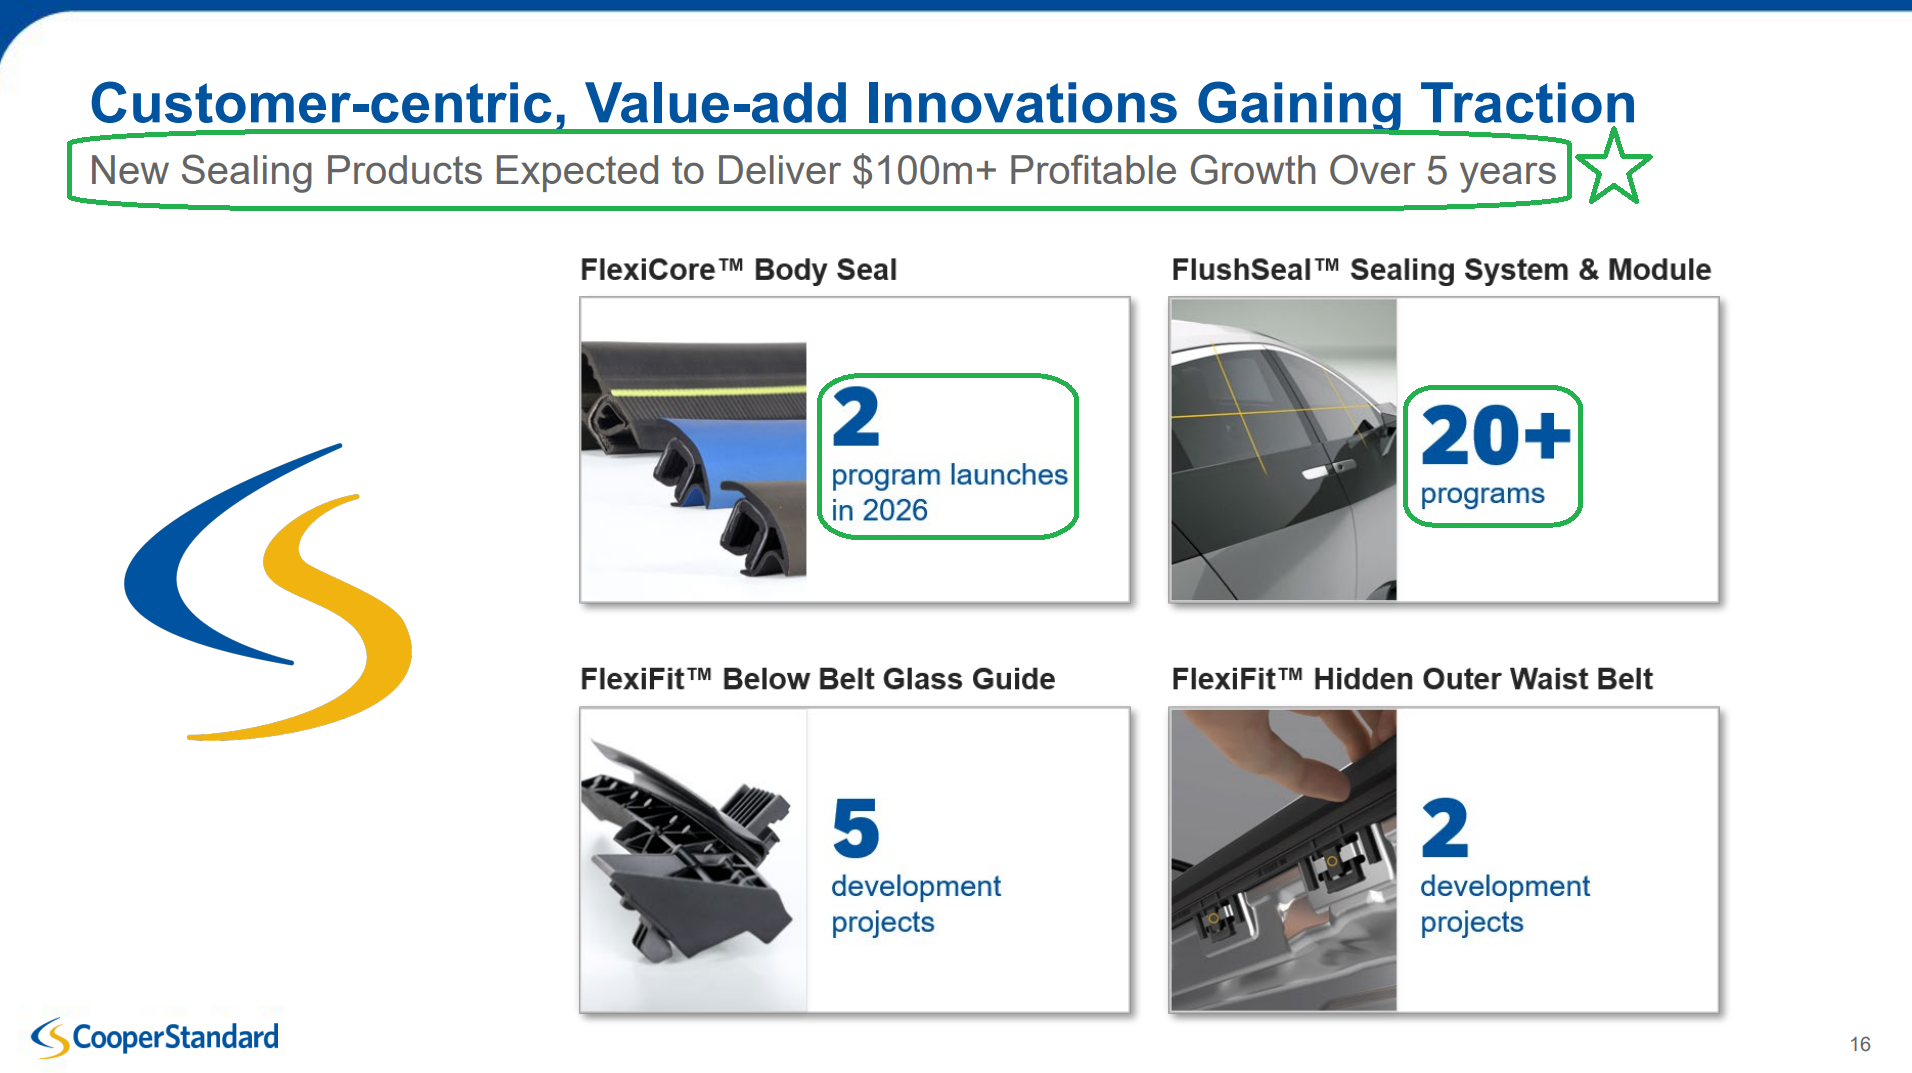
6) Sealing systems delivered revenue of $354.0M, down 2.9% from $364.4M a year ago, with adjusted EBITDA of $26.1M (7.4% margins) versus $40.3M (11.1%) in the prior year, off ~370 bps. Volume and mix were the primary drag at -$12.3M, with cost increases adding another -$3.1M, partially offset by +$1.2M of FX. On the innovation side, FlushSeal is already in production on more than 20 vehicle programs, with FlexiCore body seals, an award-winning technology, launching on two programs later this year. FlexiFit below-belt glass guide has five development projects underway, with FlexiFit hidden outer waist belt at two, both of which management expects to convert into new business awards shortly. These new sealing products are expected to deliver $100M+ of profitable growth over the next five years. CPS remains the global leader in the segment, with the 2030 target of $1.8B+ in revenue and 13%+ adjusted EBITDA margins intact.
7) CPS secured $118.4M of net new business awards during the quarter, up ~54% from ~$77.1M in Q2 2025, including $36.6M tied to battery electric or full-hybrid platforms, roughly 31% of the total and split about 50/50 between EV and hybrid. That brings first-half awards to $246.3M (+87% Y/Y), already ~83% of all of FY25’s record $298M in just six months and running well ahead of plan against the $400M+ full-year target. The 1H mix breaks down as ~34% innovation products, ~28% battery electric or hybrid programs, and ~20% tied to high-growth Chinese OEMs. These wins carry higher margins than the programs they are replacing, with management confirming available capacity to launch much of the backlog over the coming years with minimal capital investment.
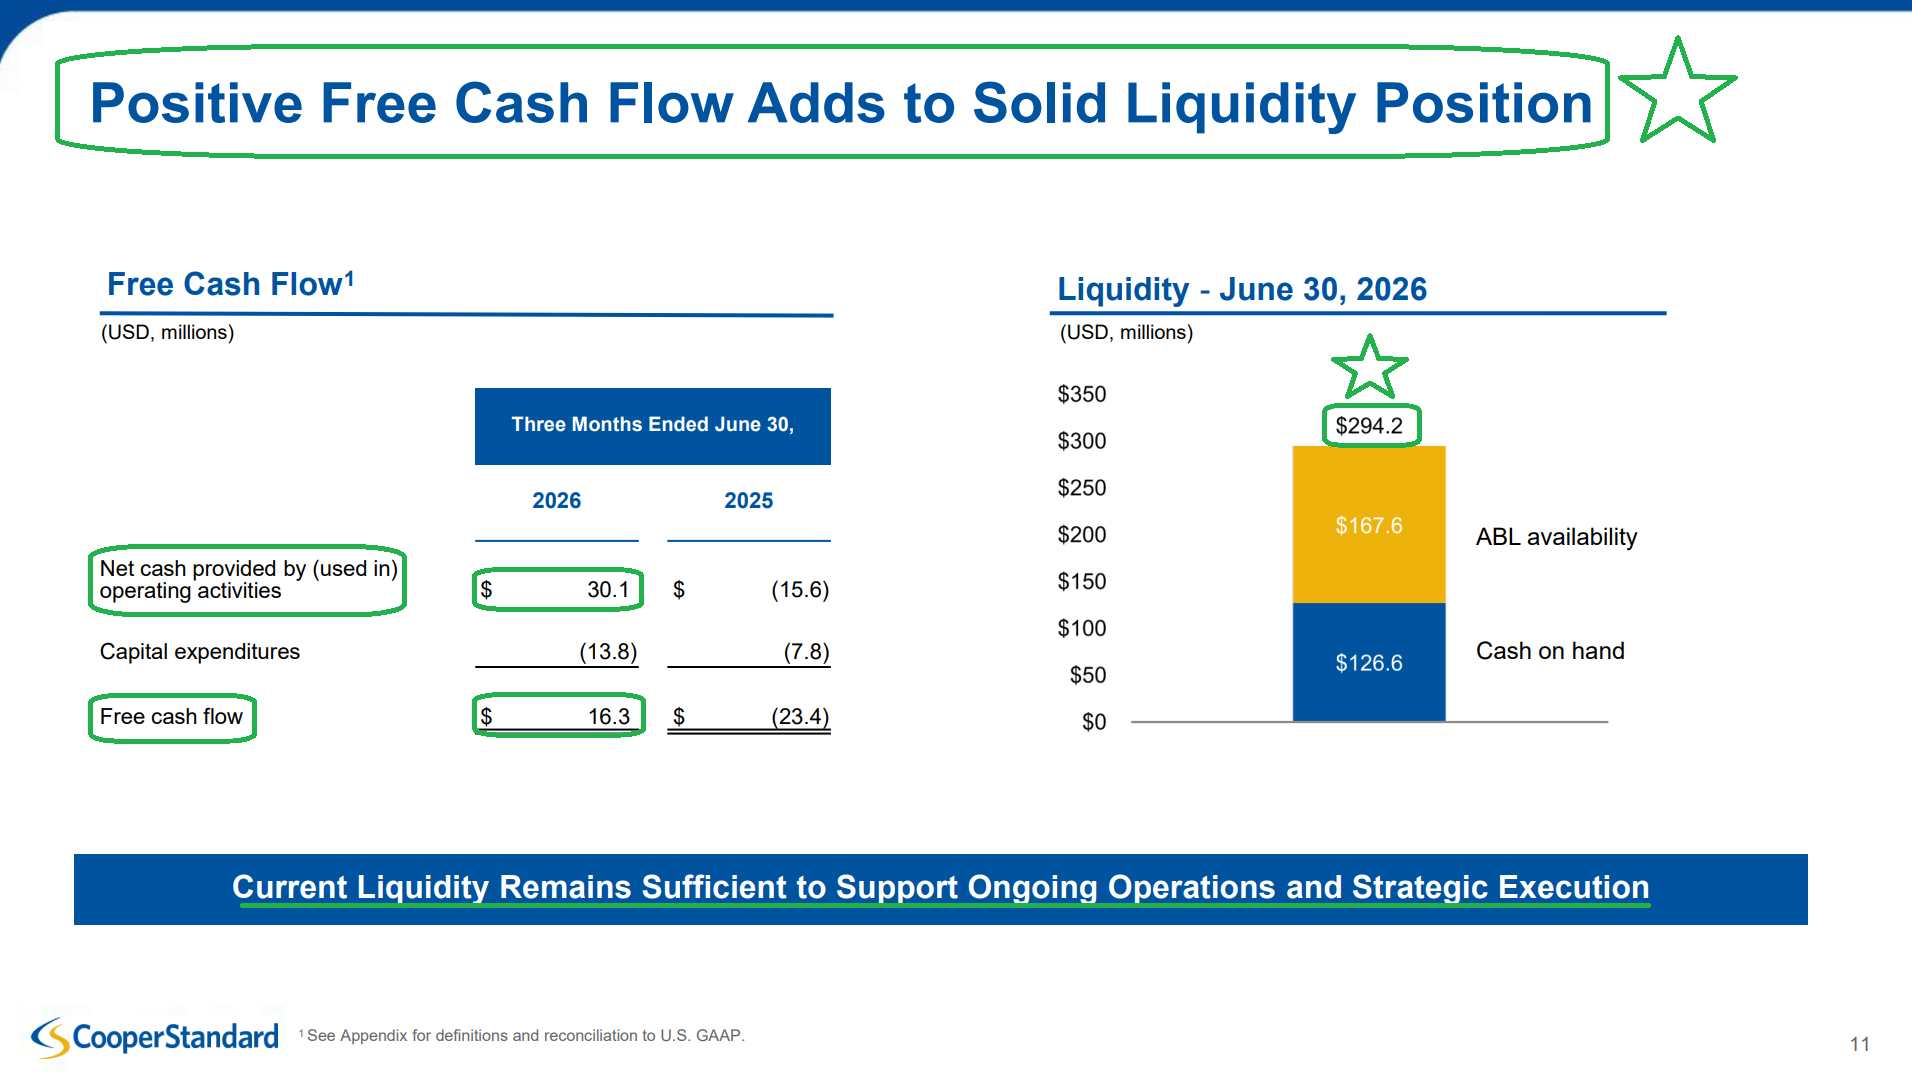
8) Operating cash flow swung positive to $30.1M from an outflow of $15.6M a year ago, driven by the Q1 refinancing and continued working capital discipline. Capex totaled $13.8M (1.9% of sales) versus $7.8M (1.1%) last year on launch-related and automation investment, still well inside the 2% to 3% run rate and a fraction of the bloated 5% to 6% averages of the past. Free cash flow came in at $16.3M, a ~$39.7M swing from -$23.4M in the prior year, with 1H free cash flow still an outflow of $76.9M versus -$55.7M given the seasonally heavy Q1. Management reiterated positive free cash flow for the full year, which would mark the fourth consecutive year, with the back half implying ~$100M of free cash flow generation as recoveries land.
9) CPS ended the quarter with $126.6M of cash and total liquidity of $294.2M, including $167.6M of undrawn availability on the ABL. Net debt stands at $1.02B against TTM adjusted EBITDA of $193.1M (which still carries the Novelis-impacted Q4 2025 quarter of $34.9M along with the tariff-pressured first half), putting net leverage at 5.3x with interest coverage at 1.7x. Following the March refinancing, CPS has no material maturities until 2031, with net cash interest guidance cut $15M at the midpoint to $90M-$100M (~$0.83 per share pre-tax on ~18.1M diluted shares), leaving the balance sheet in position to support execution without near-term pressure.
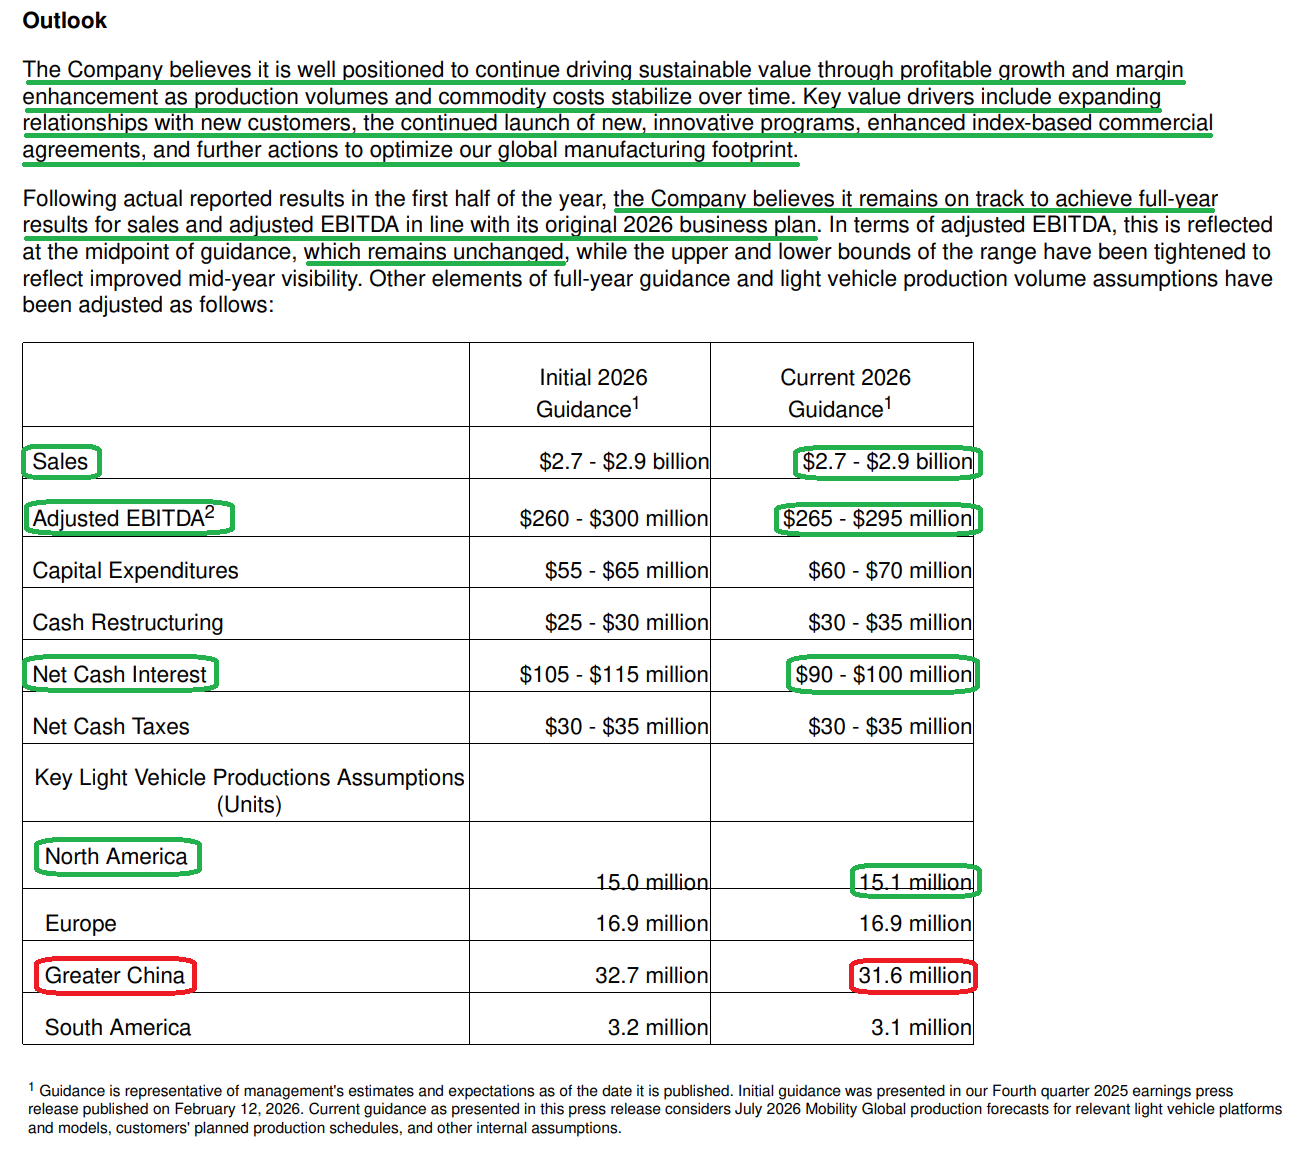
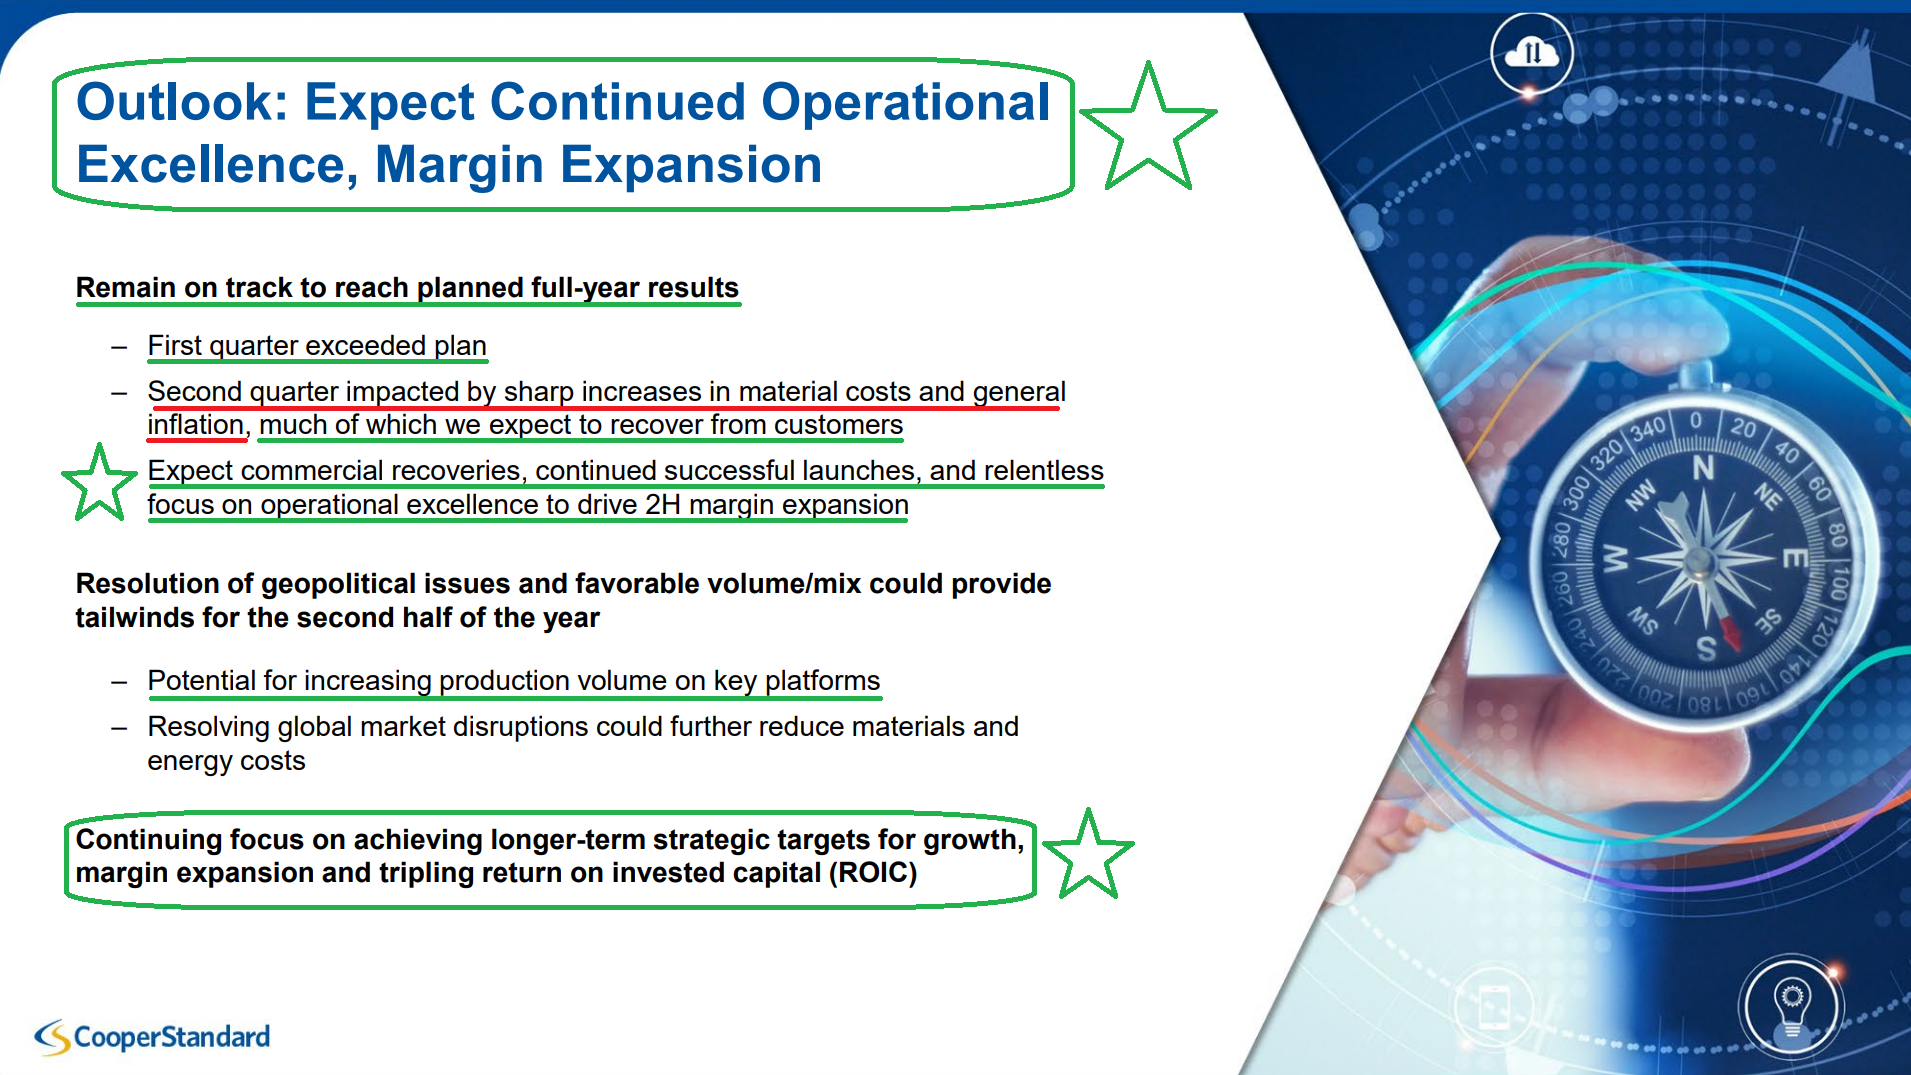
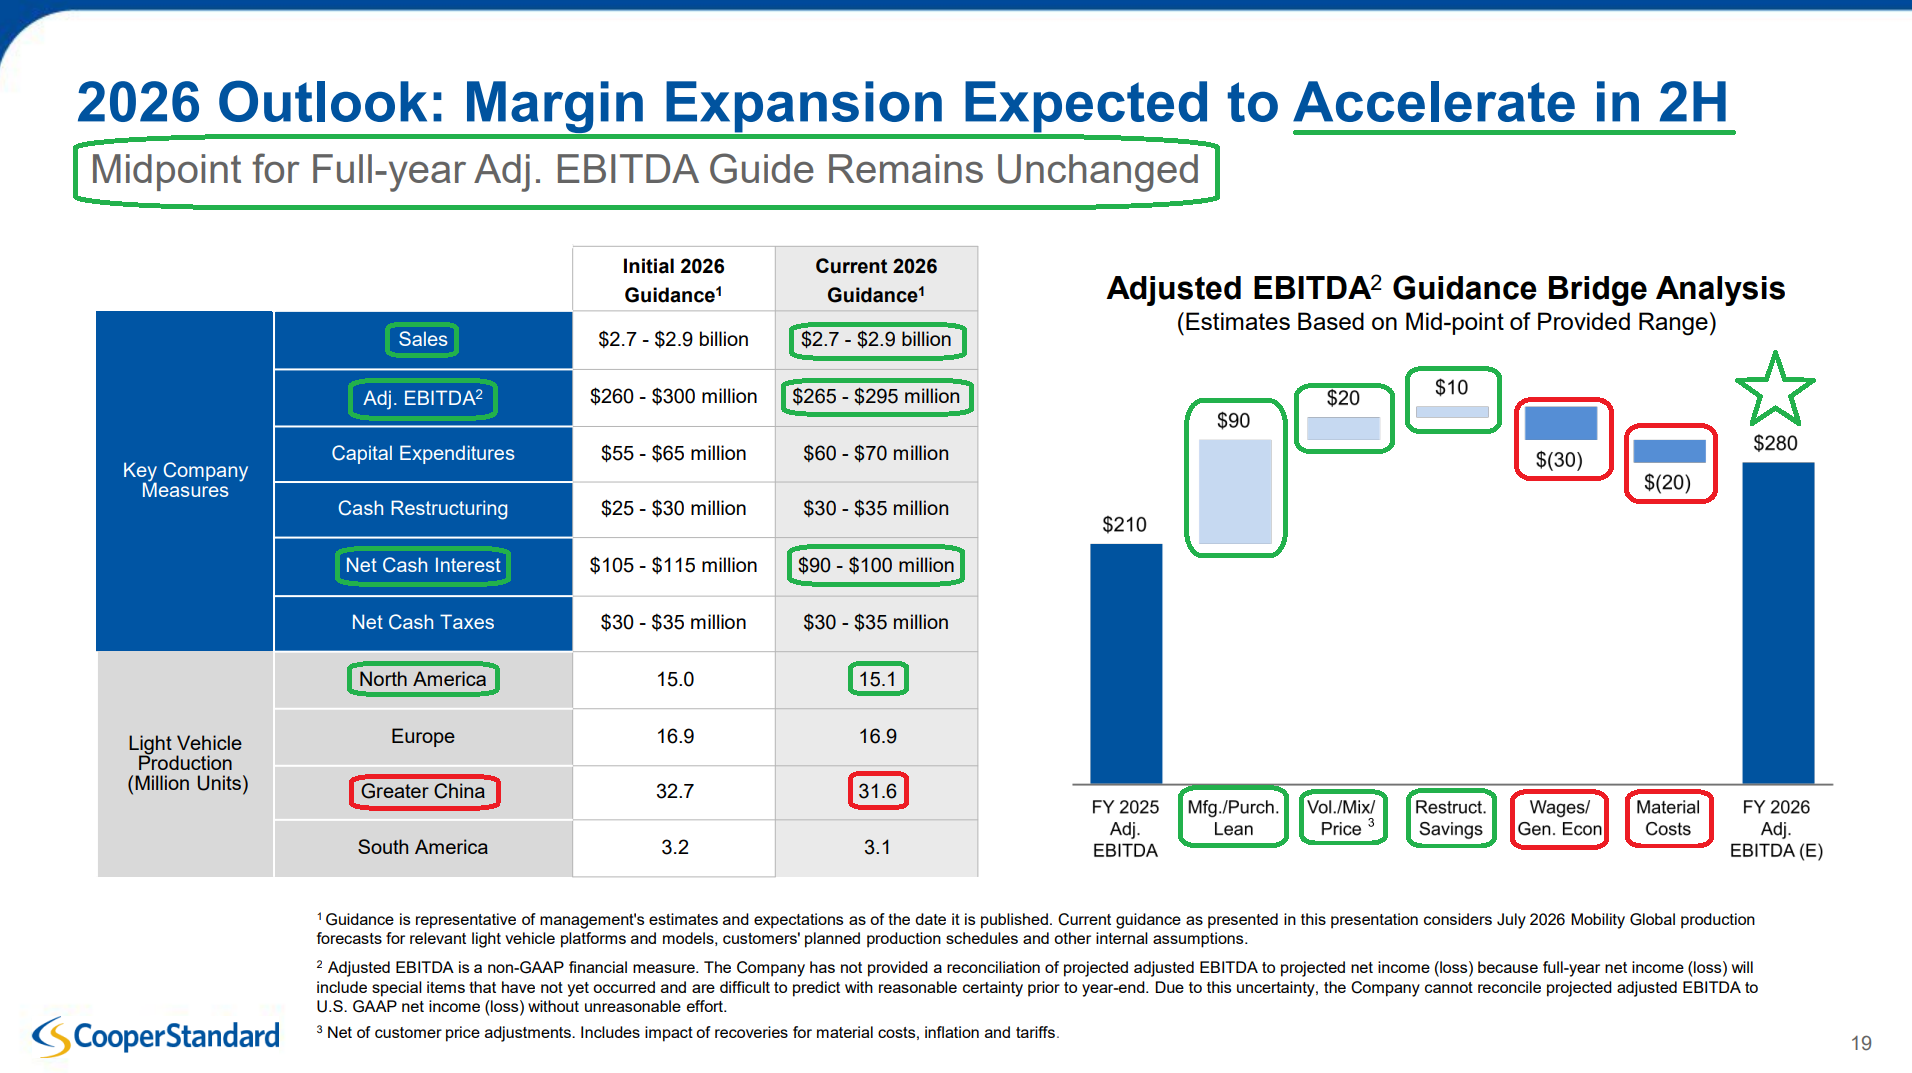
10) Management held the midpoint of full-year adjusted EBITDA guidance at ~$280M while narrowing the range to $265M-$295M from $260M-$300M, with sales guidance unchanged at $2.7B-$2.9B. Production assumptions were trimmed, with Greater China cut to 31.6M from 32.7M and South America to 3.1M from 3.2M, while North America moved up to 15.1M from 15.0M, with Europe held at 16.9M. At the midpoint of both sales and adjusted EBITDA, the implied back half calls for ~12.6% adjusted EBITDA margins each quarter, underpinned by the July 1 price increases, another ~$50M+ of incremental cost savings, and continued launches.
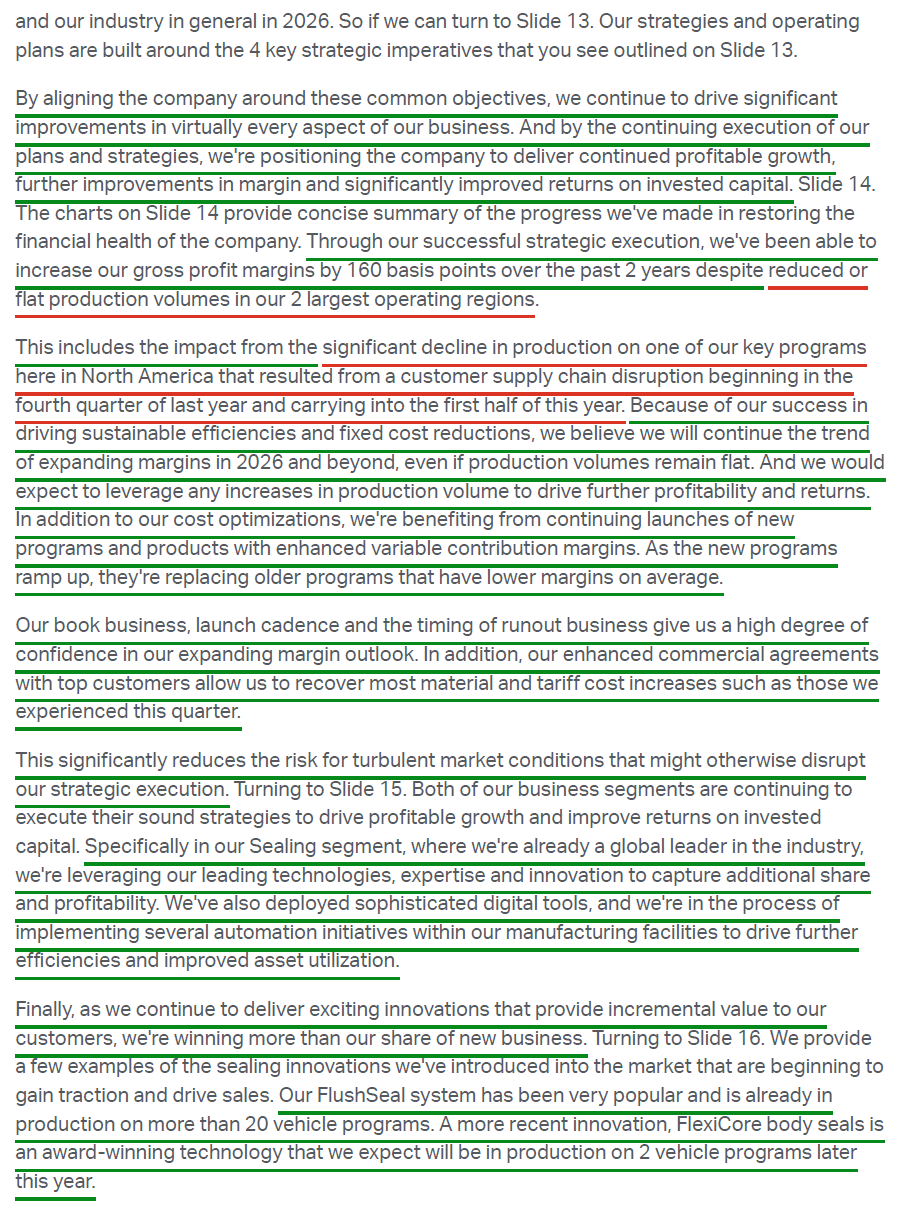
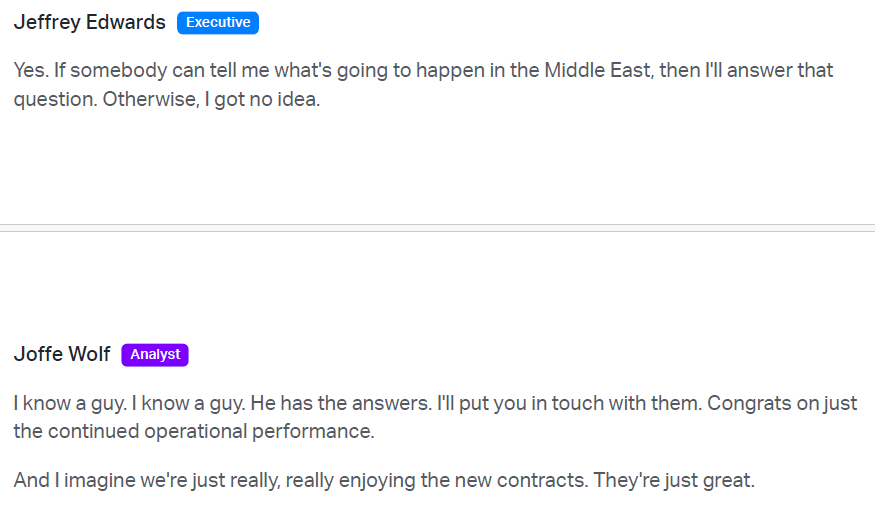
Earnings Call Highlights
Stifel Analyst Note
Baxter Update
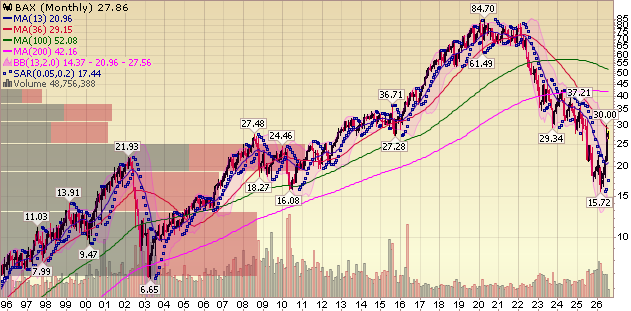
For newer readers, here’s a quick overview of the key drivers behind our thesis on Baxter, a century-old medtech leader where temporary headwinds and operational missteps have created an opportunity for a Danaher-trained CEO to reset execution and restore normalized earnings power:
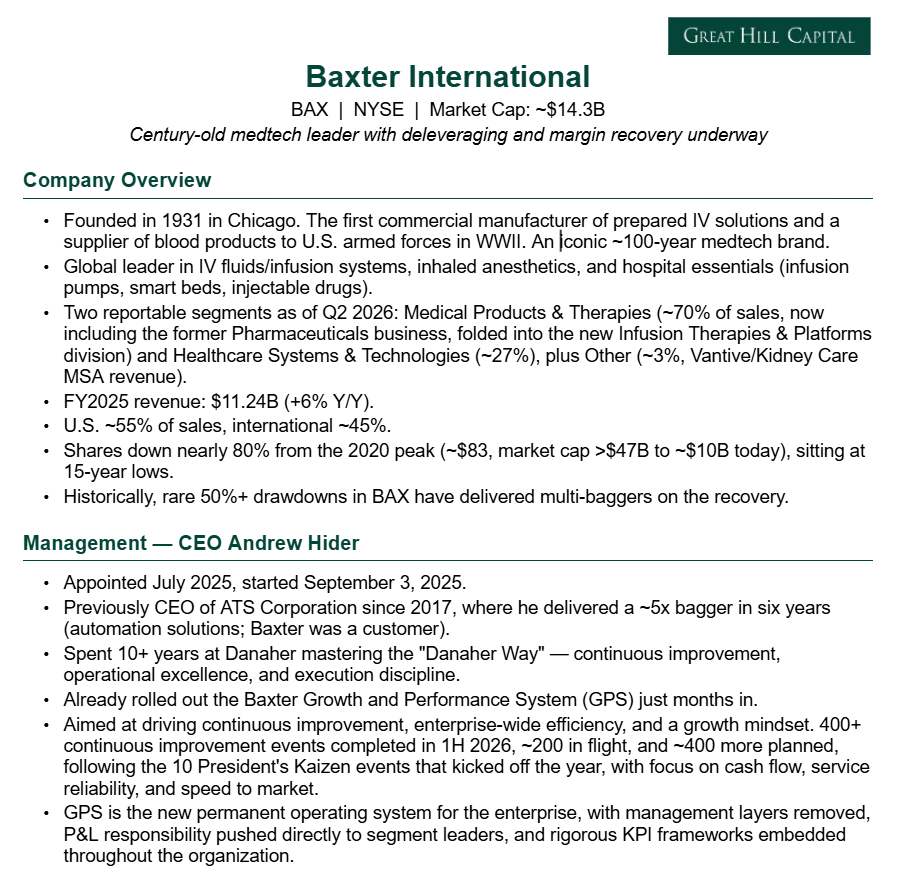
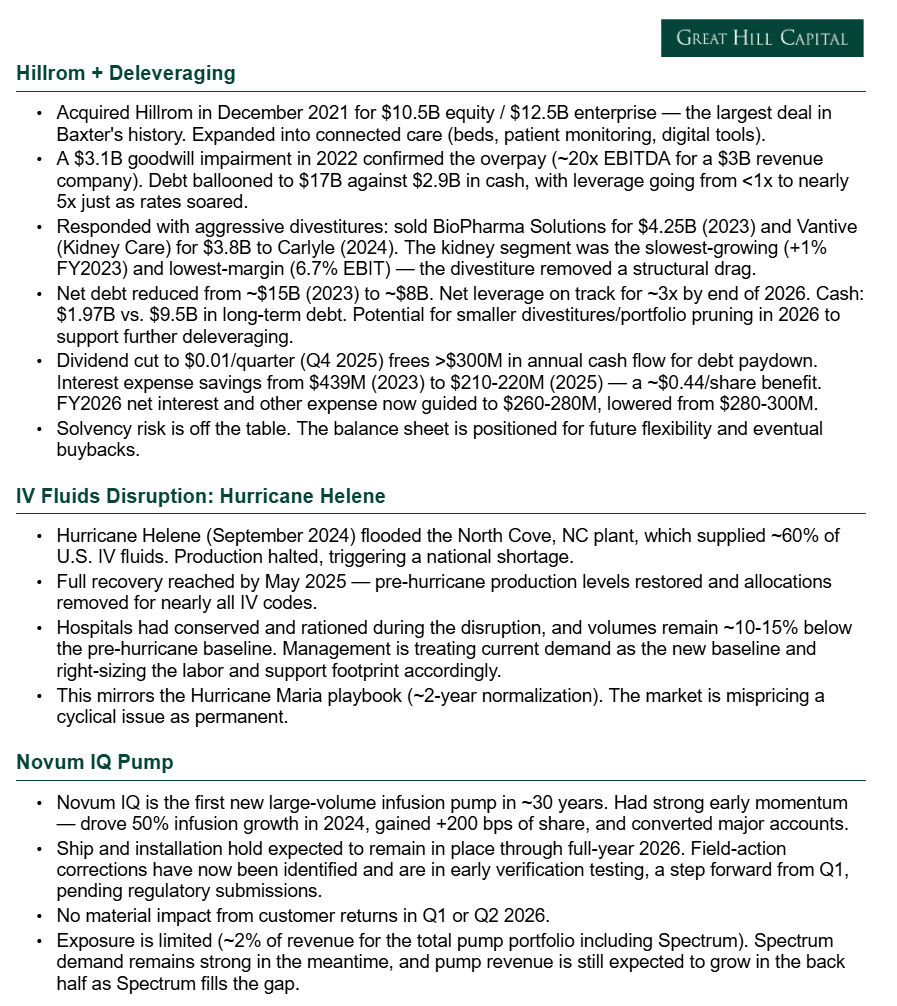
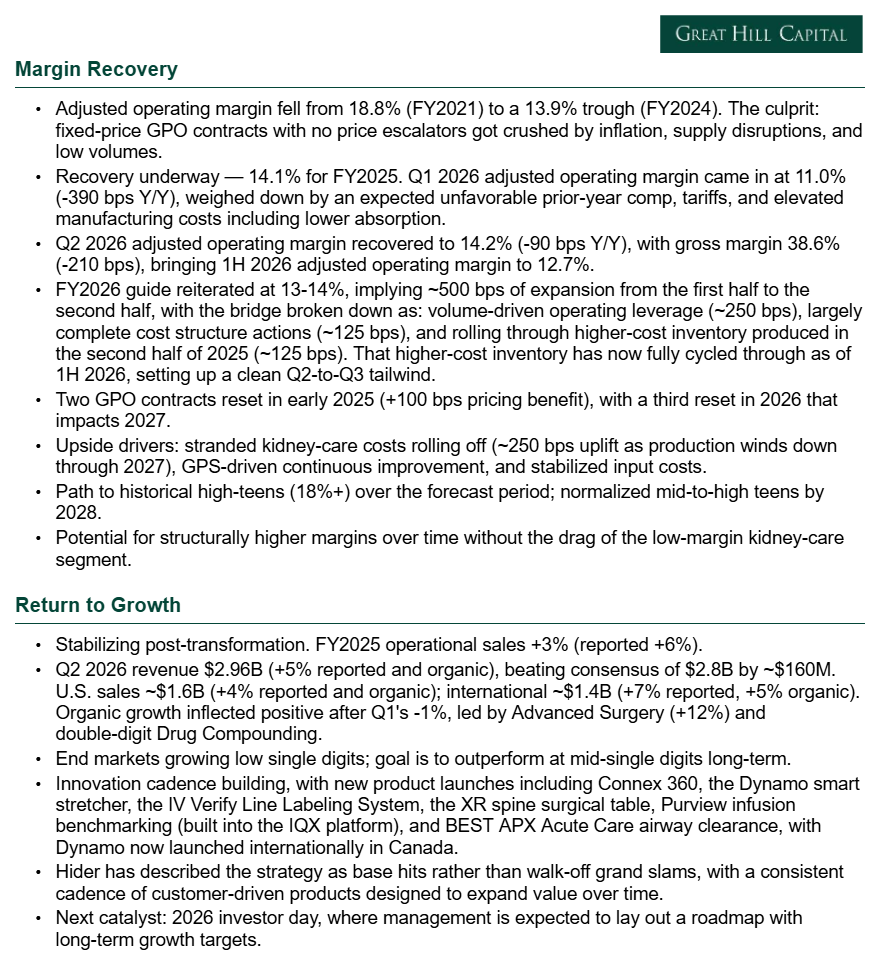
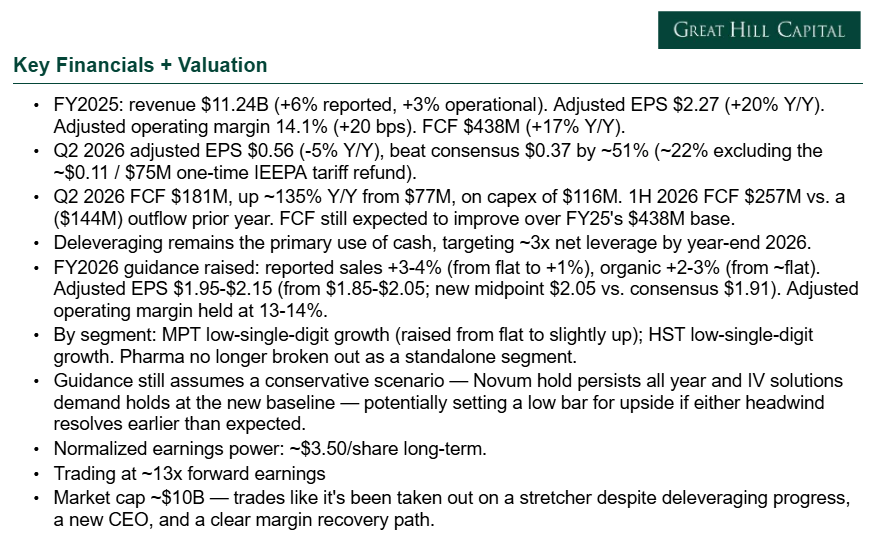
Q2 Earnings Breakdown
10 Key Points
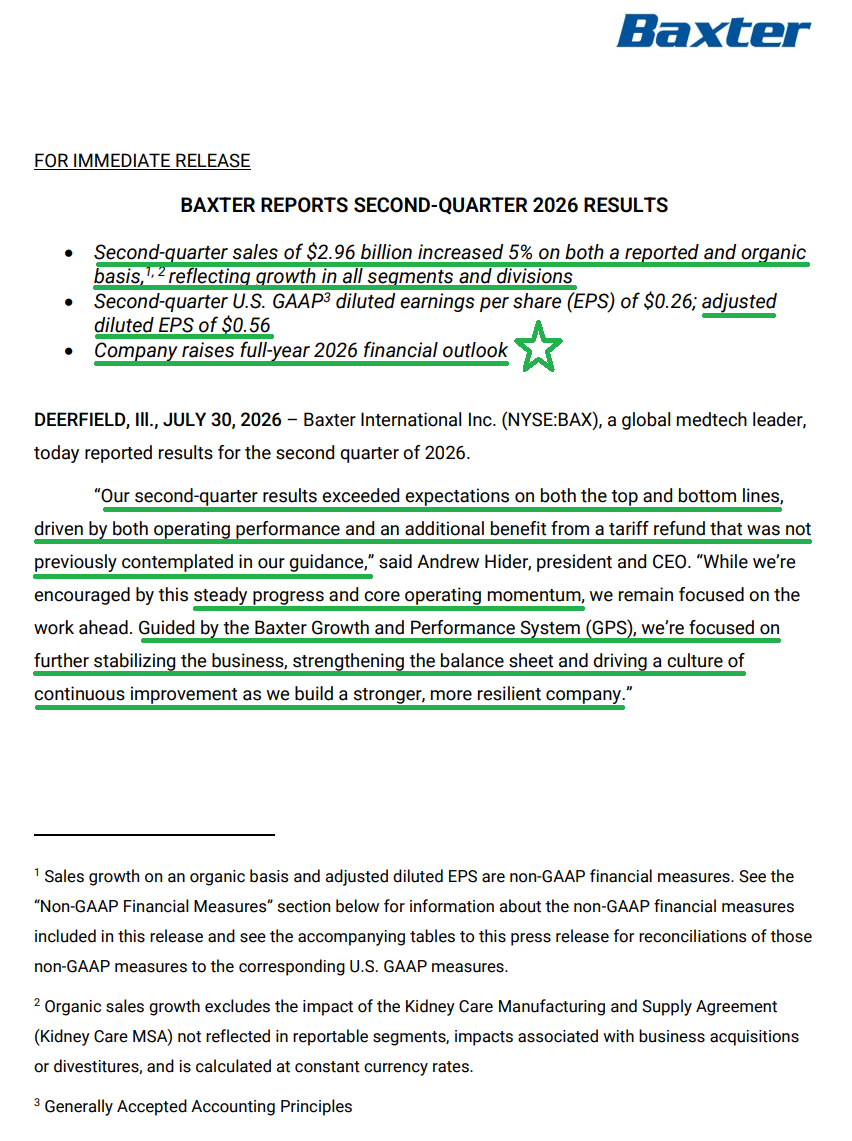
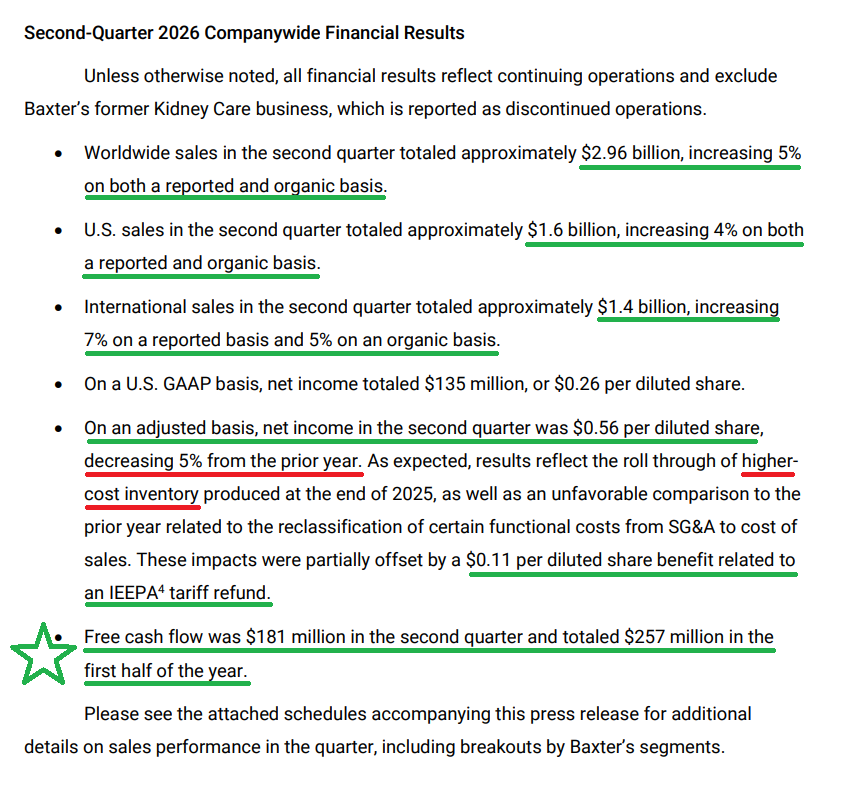
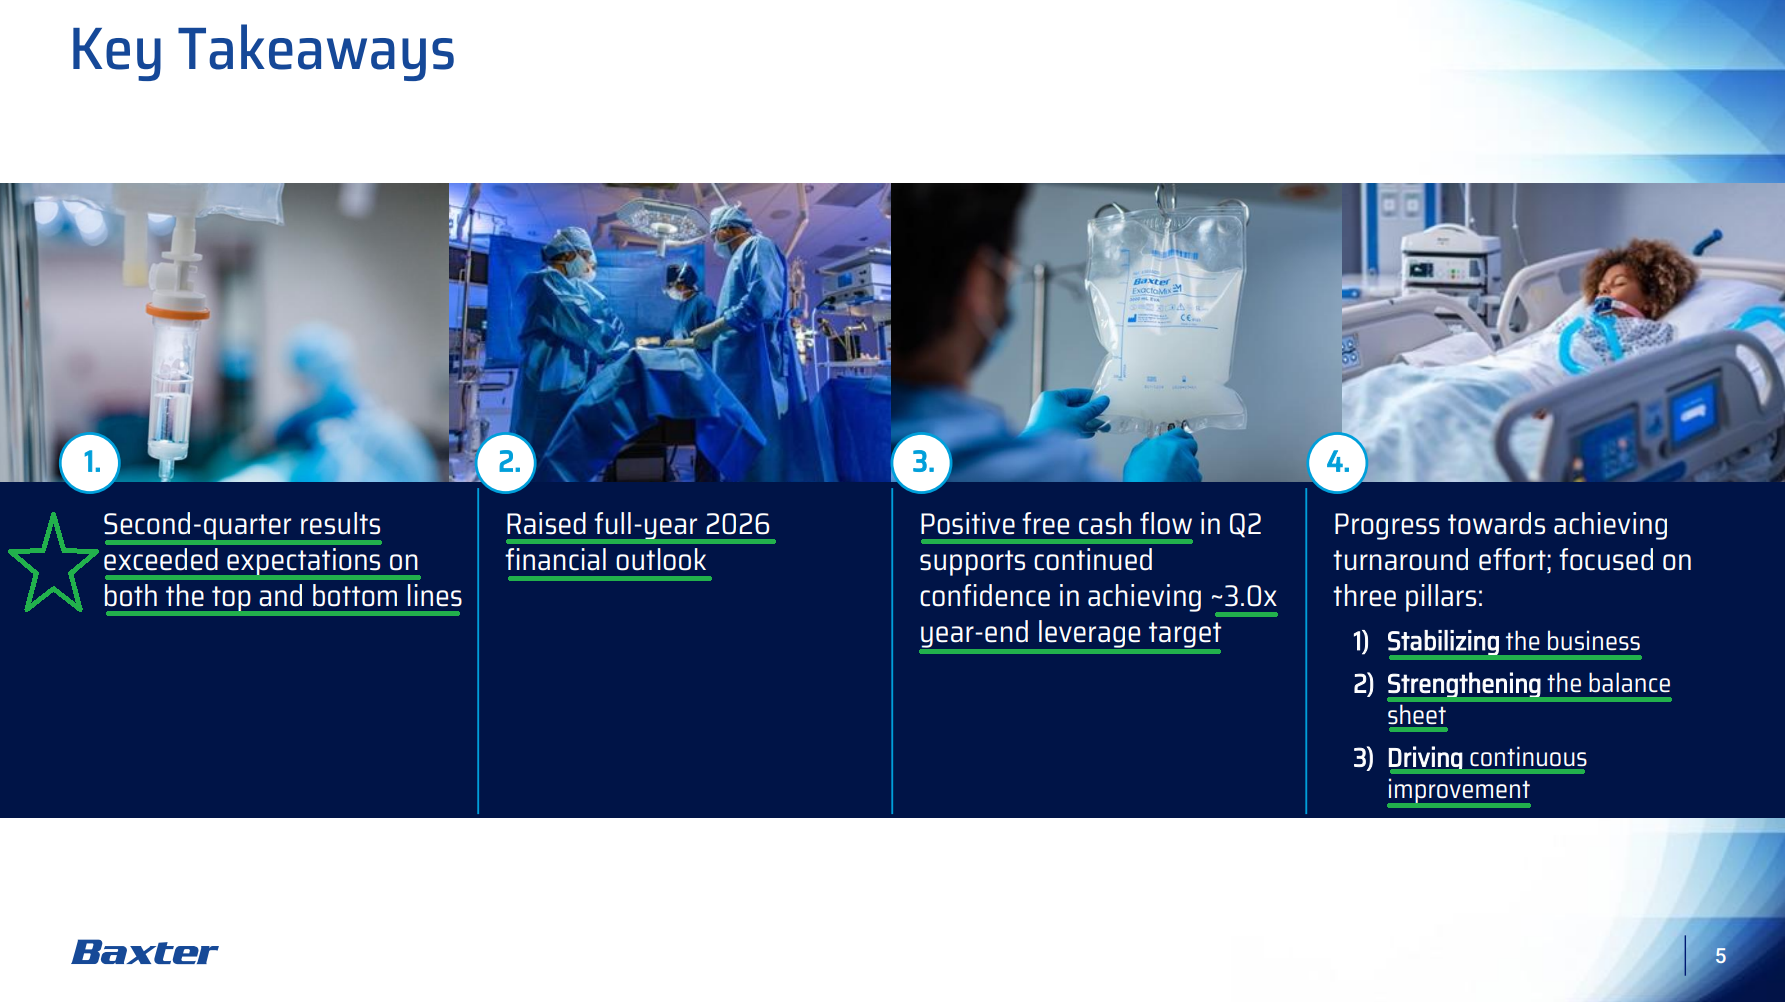
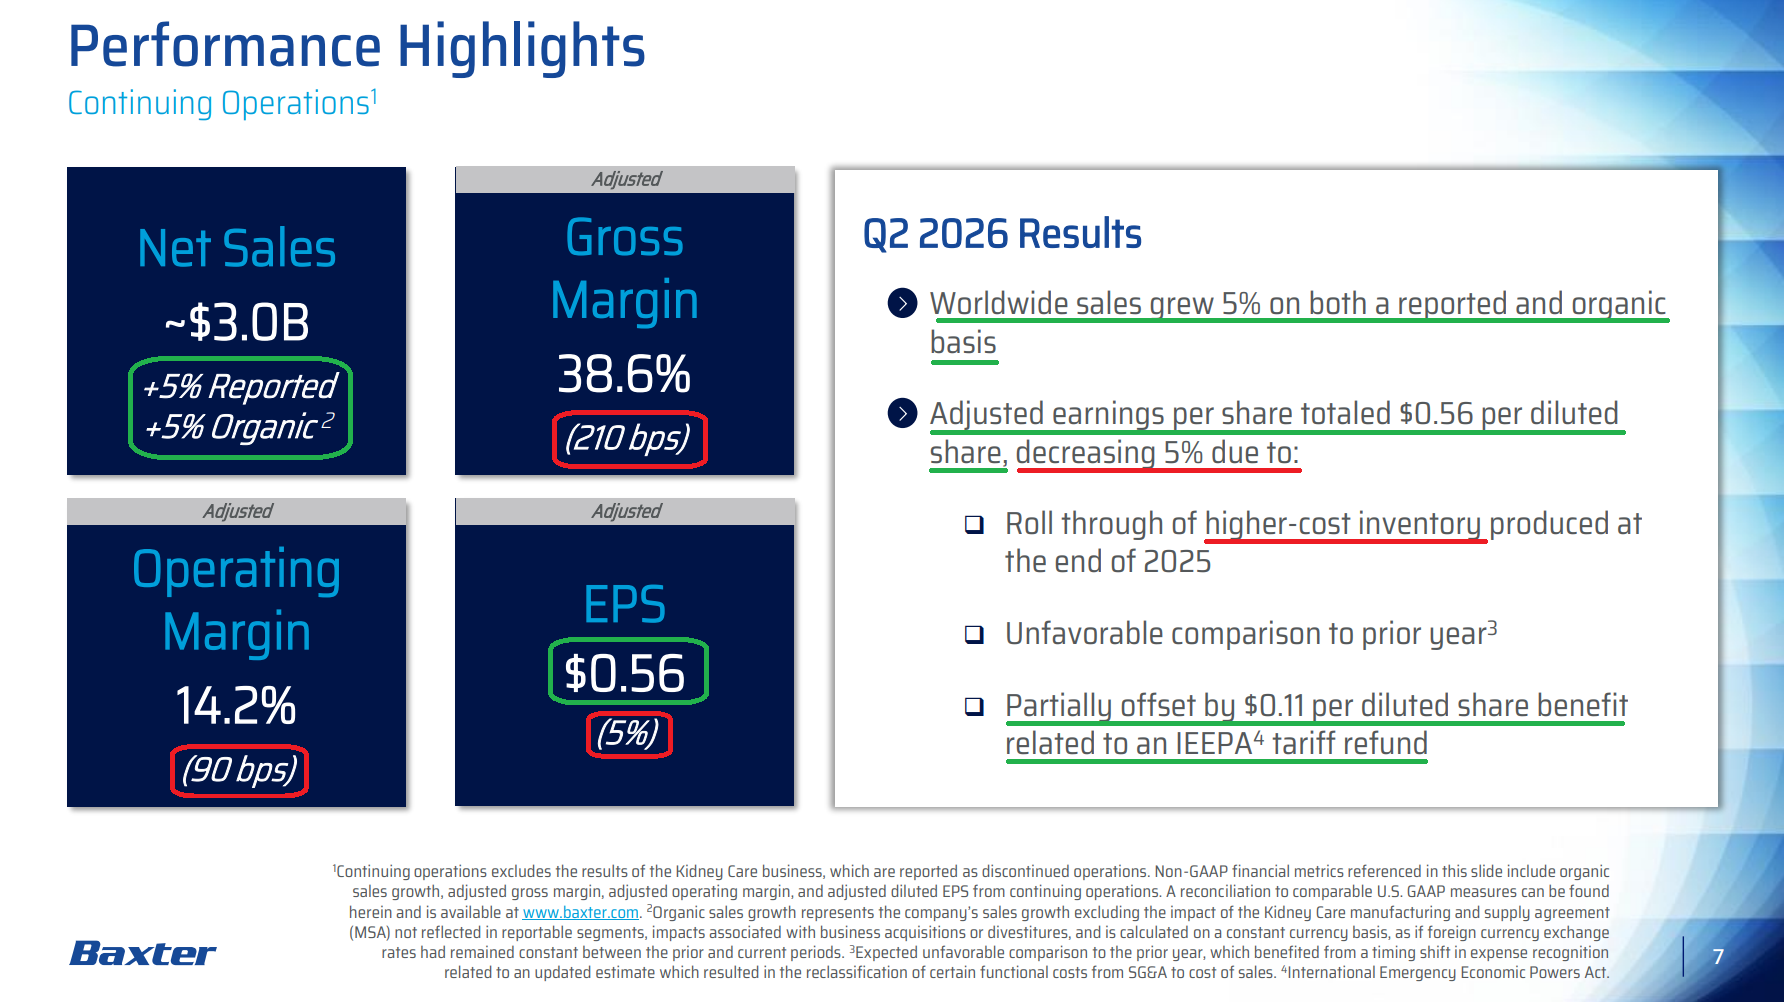
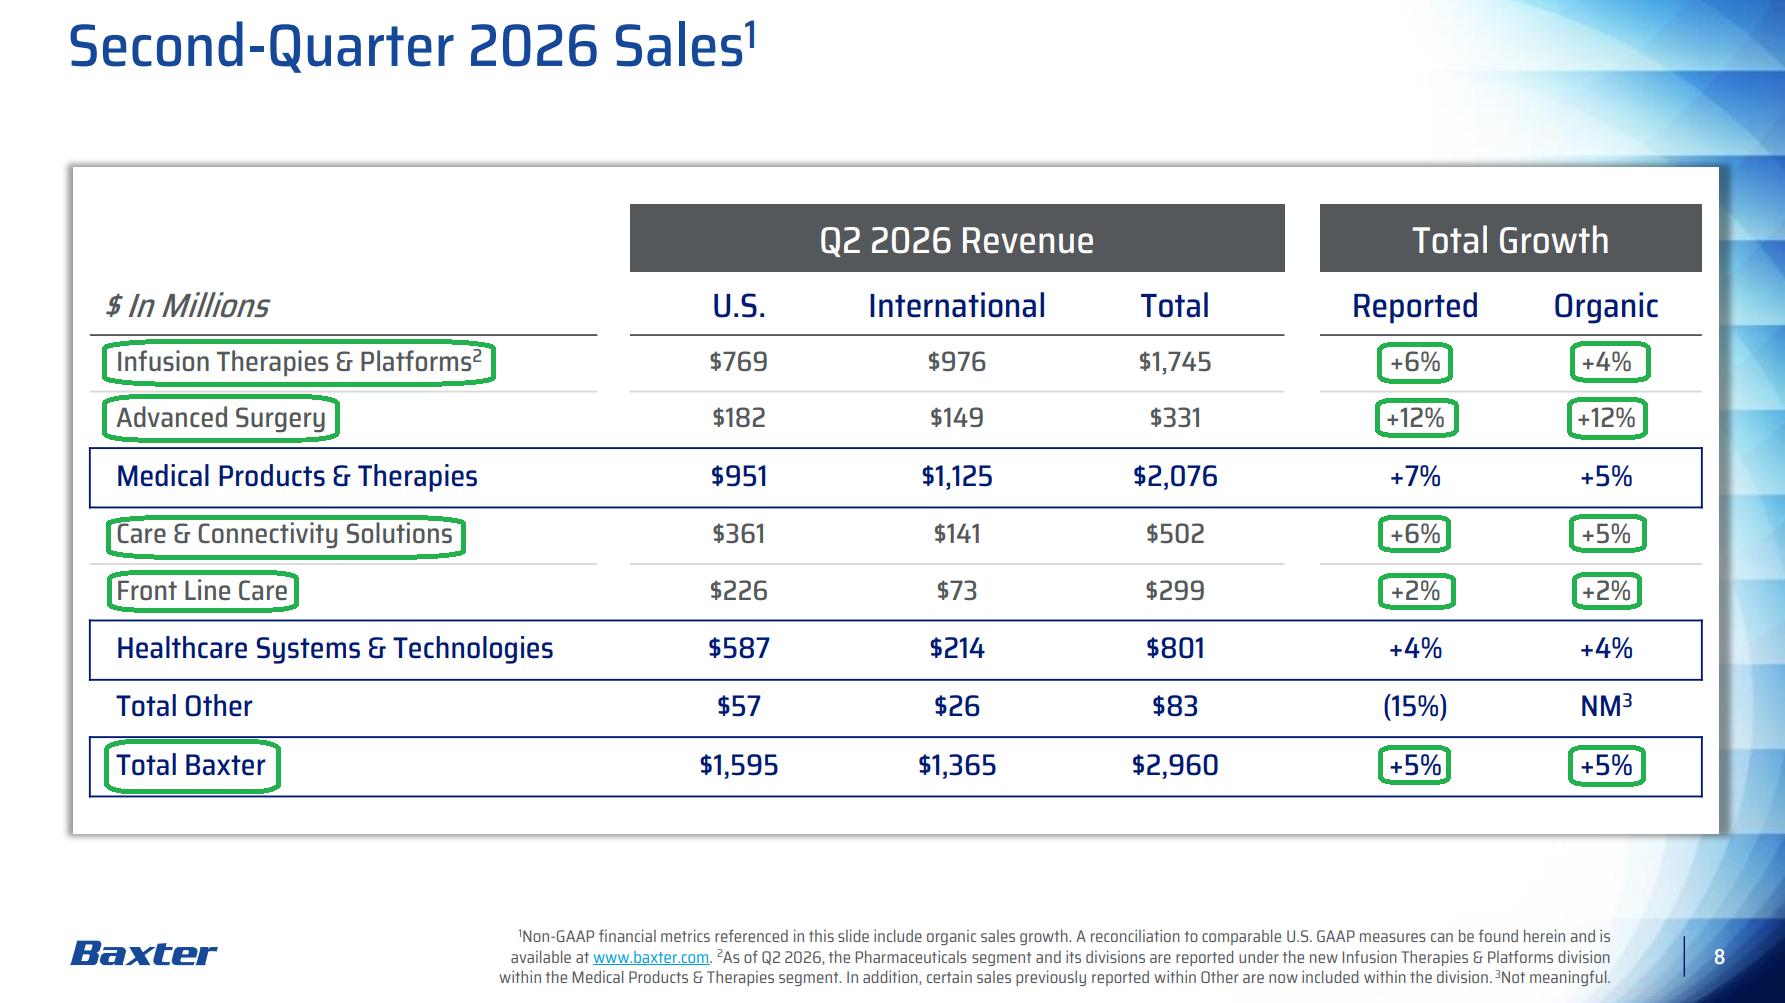
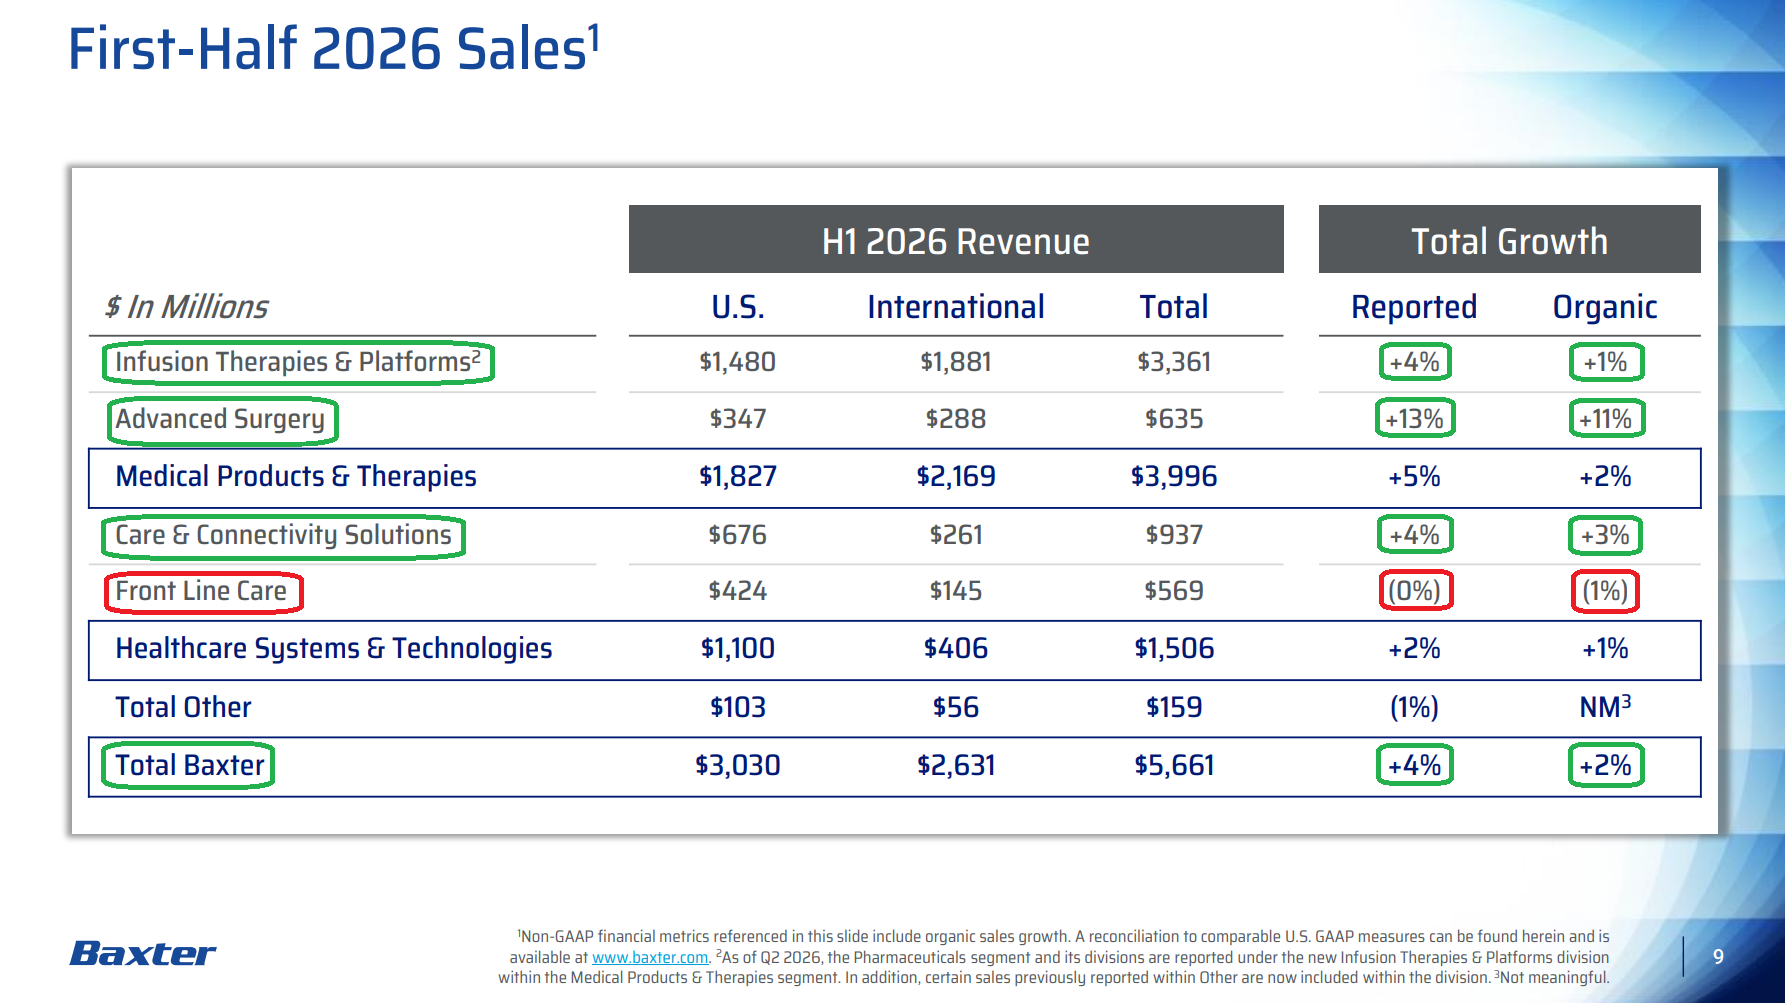
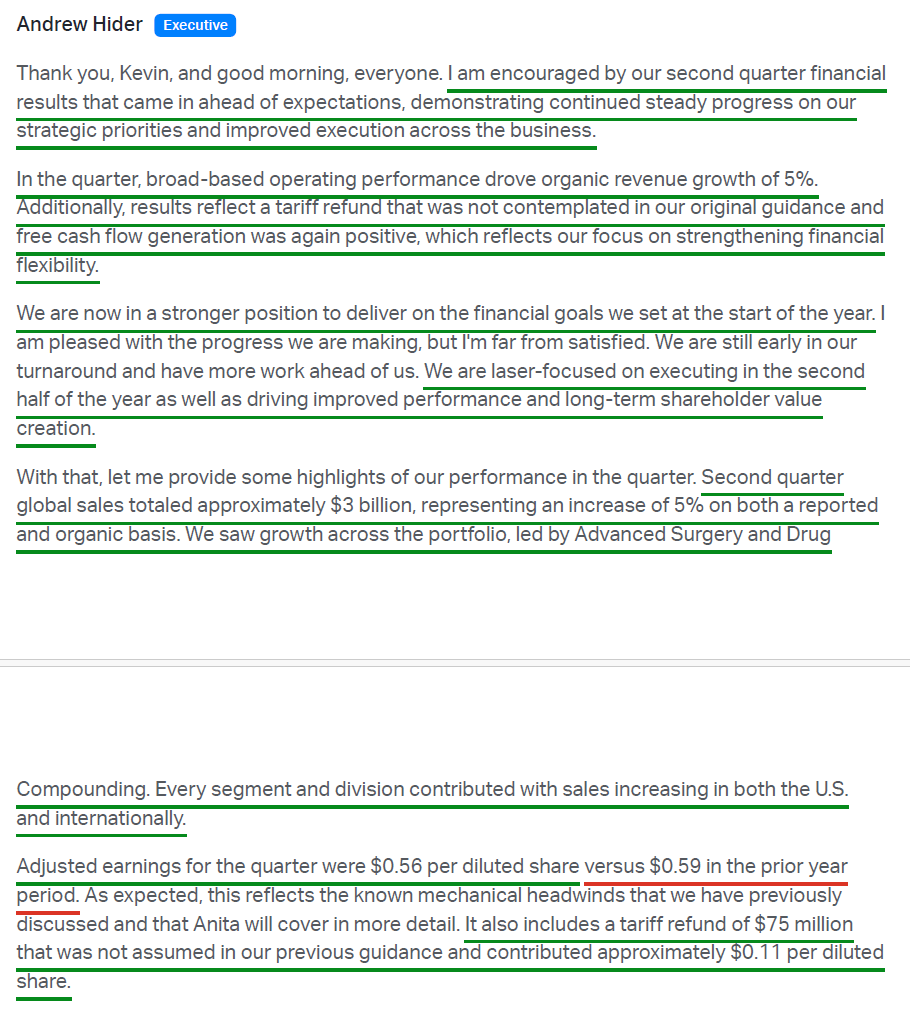
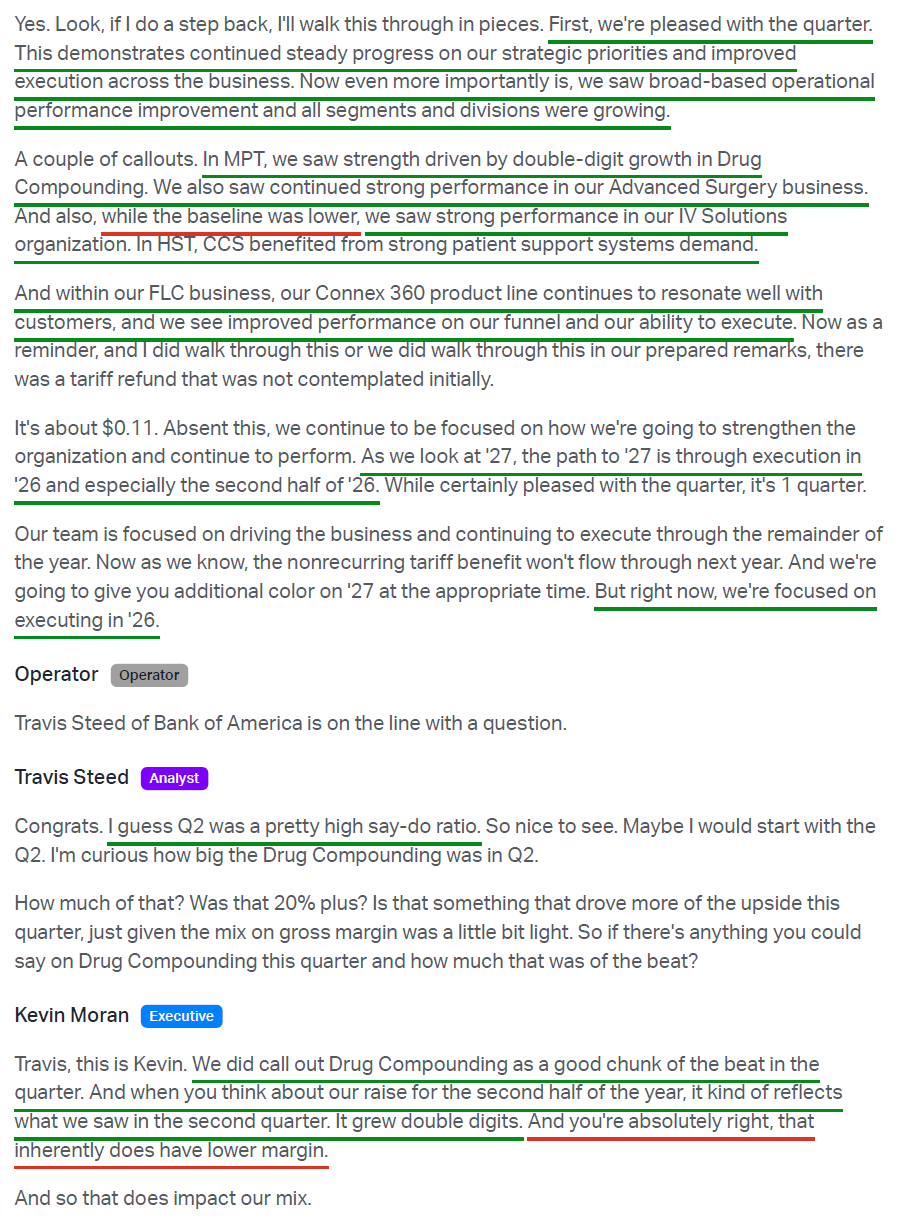
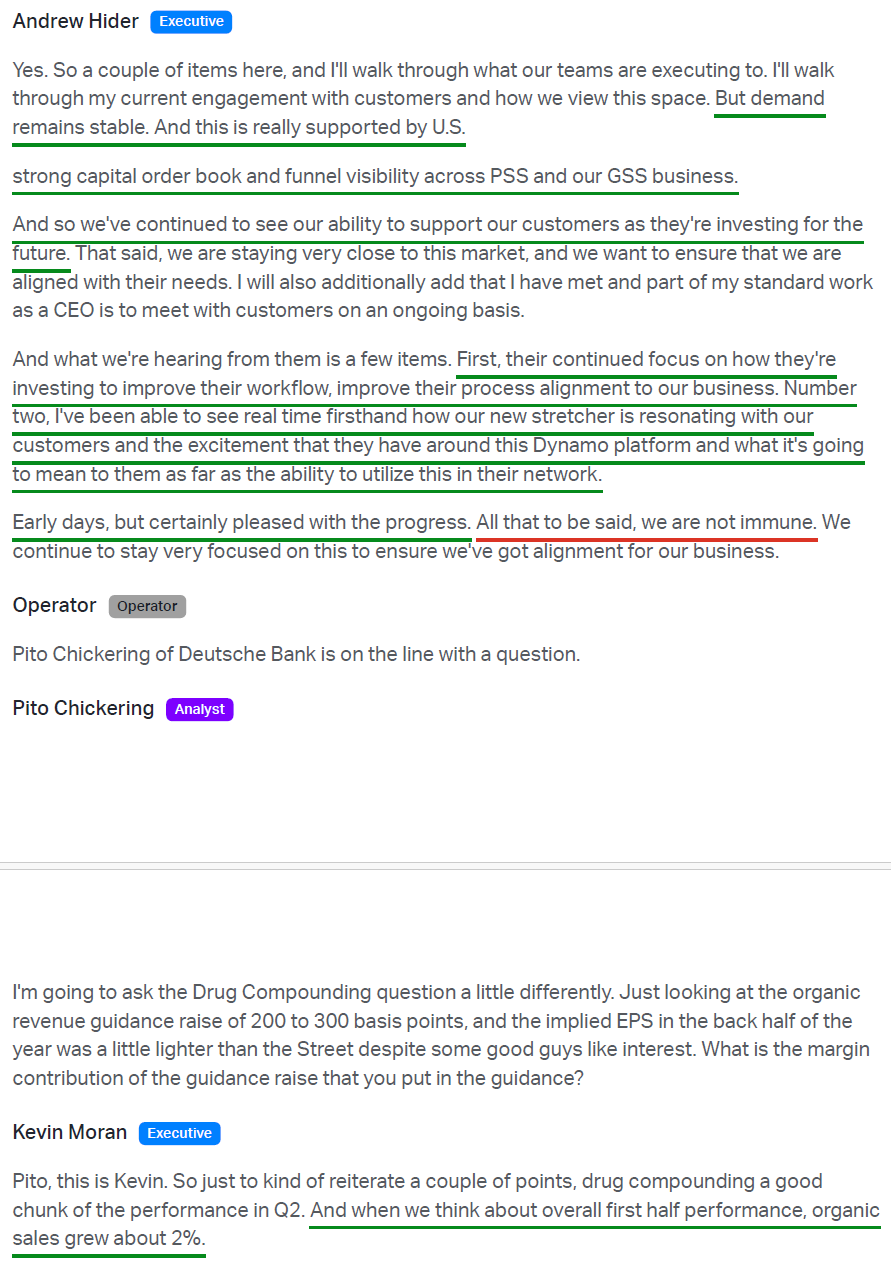
1) Revenue of $2.96B (+5% reported and +5% organic) came in ~$160M ahead of consensus of $2.8B, with growth broad-based across every segment and division. U.S. sales of $1.60B grew 4% on both a reported and organic basis, while international sales of $1.37B increased 7% reported and 5% organic.
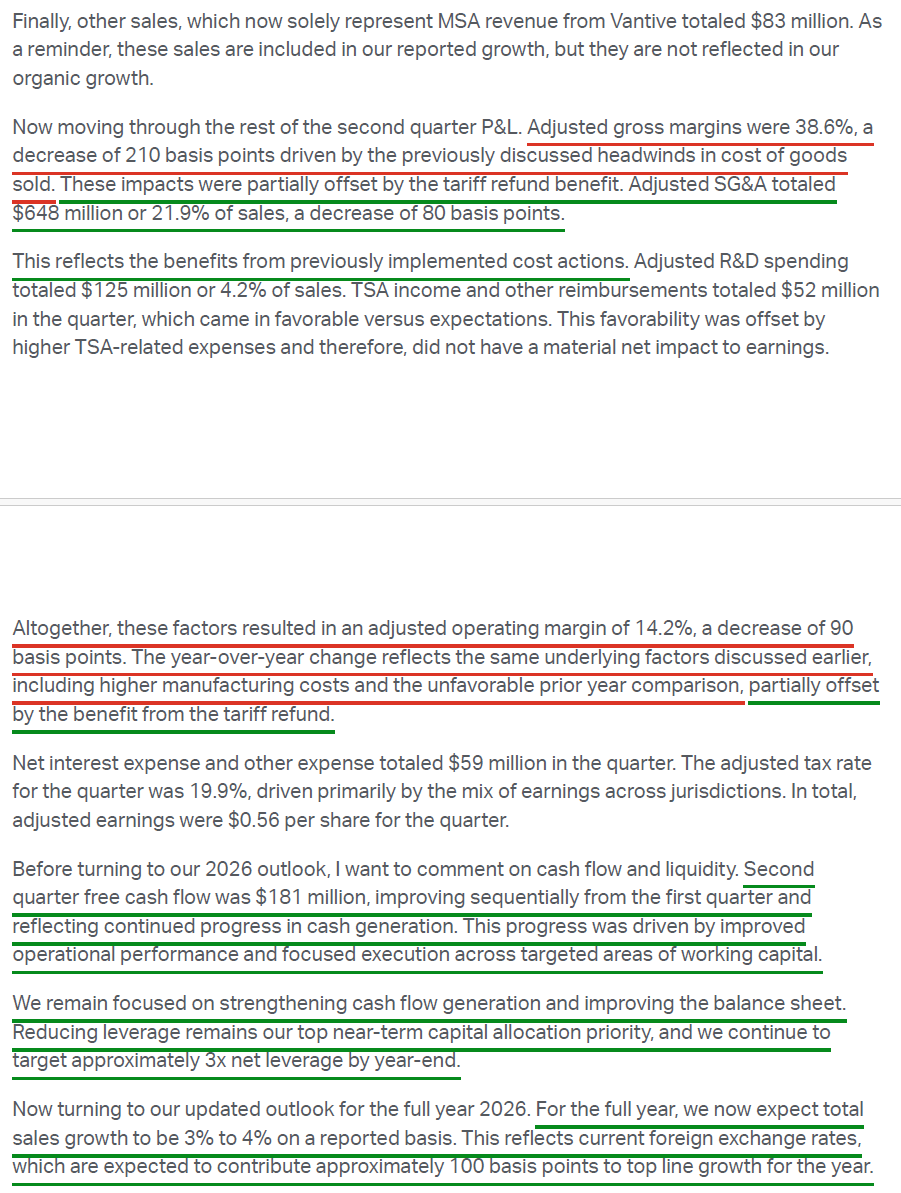
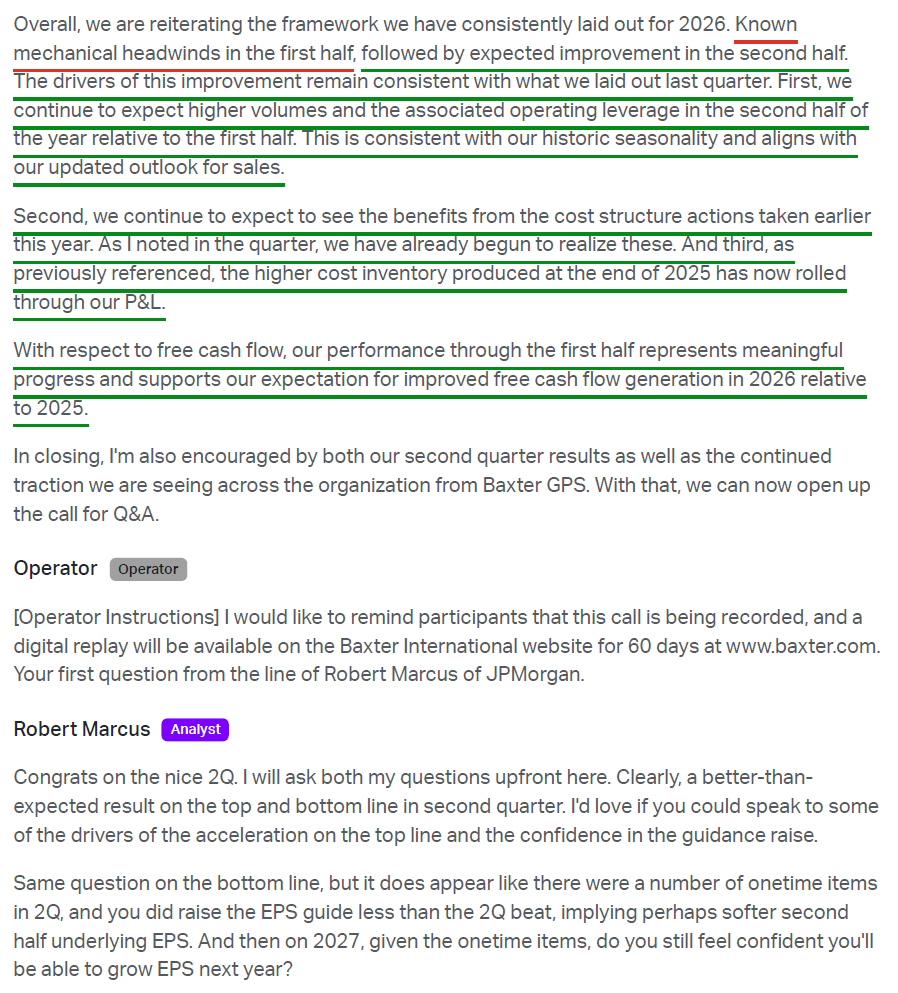
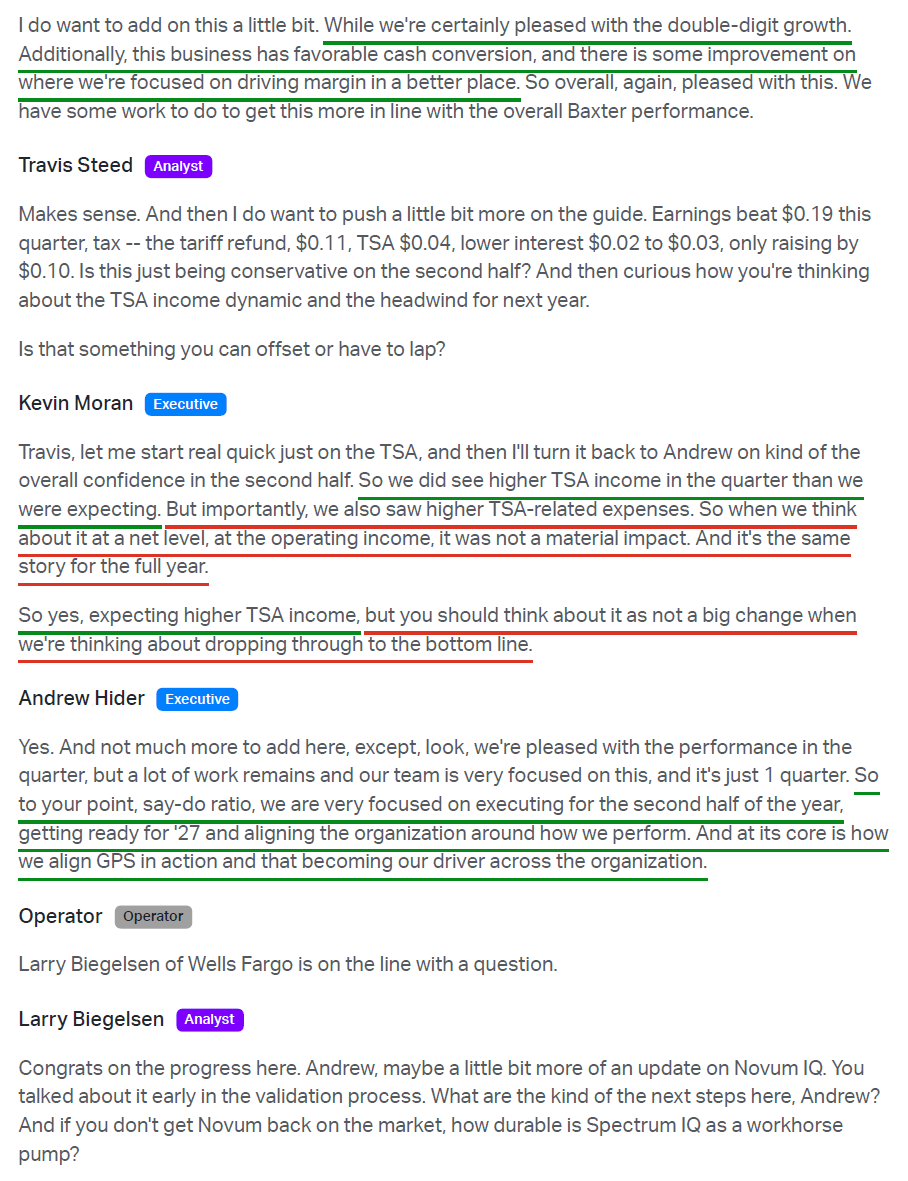
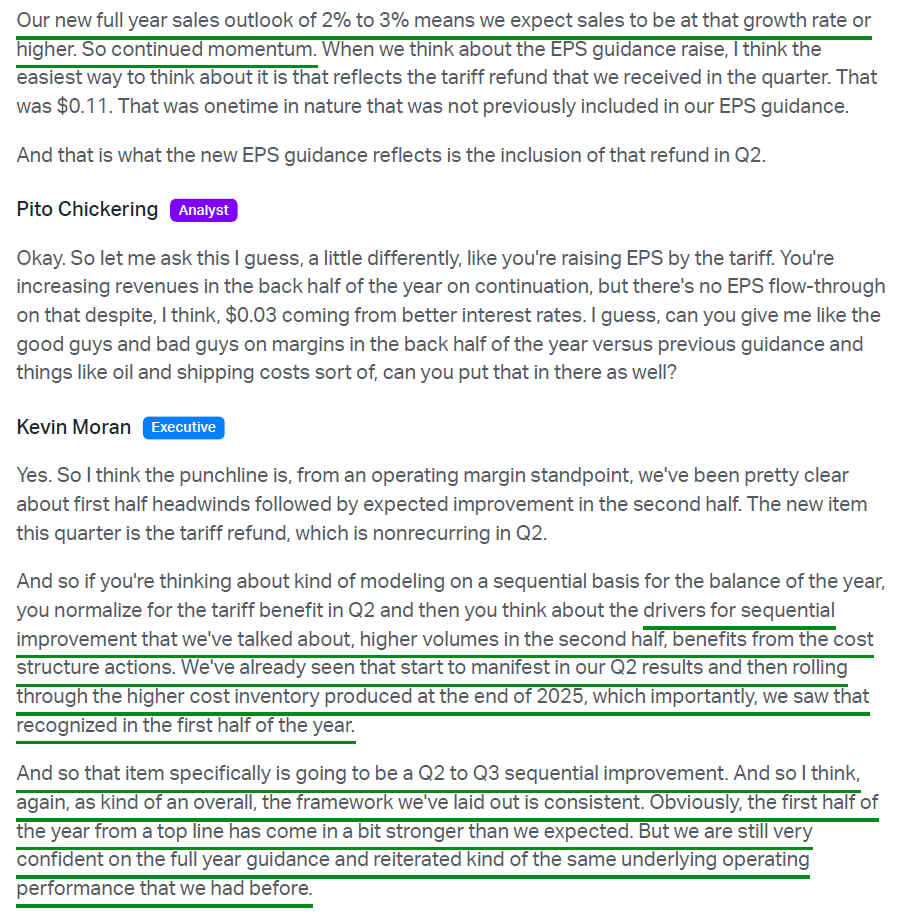
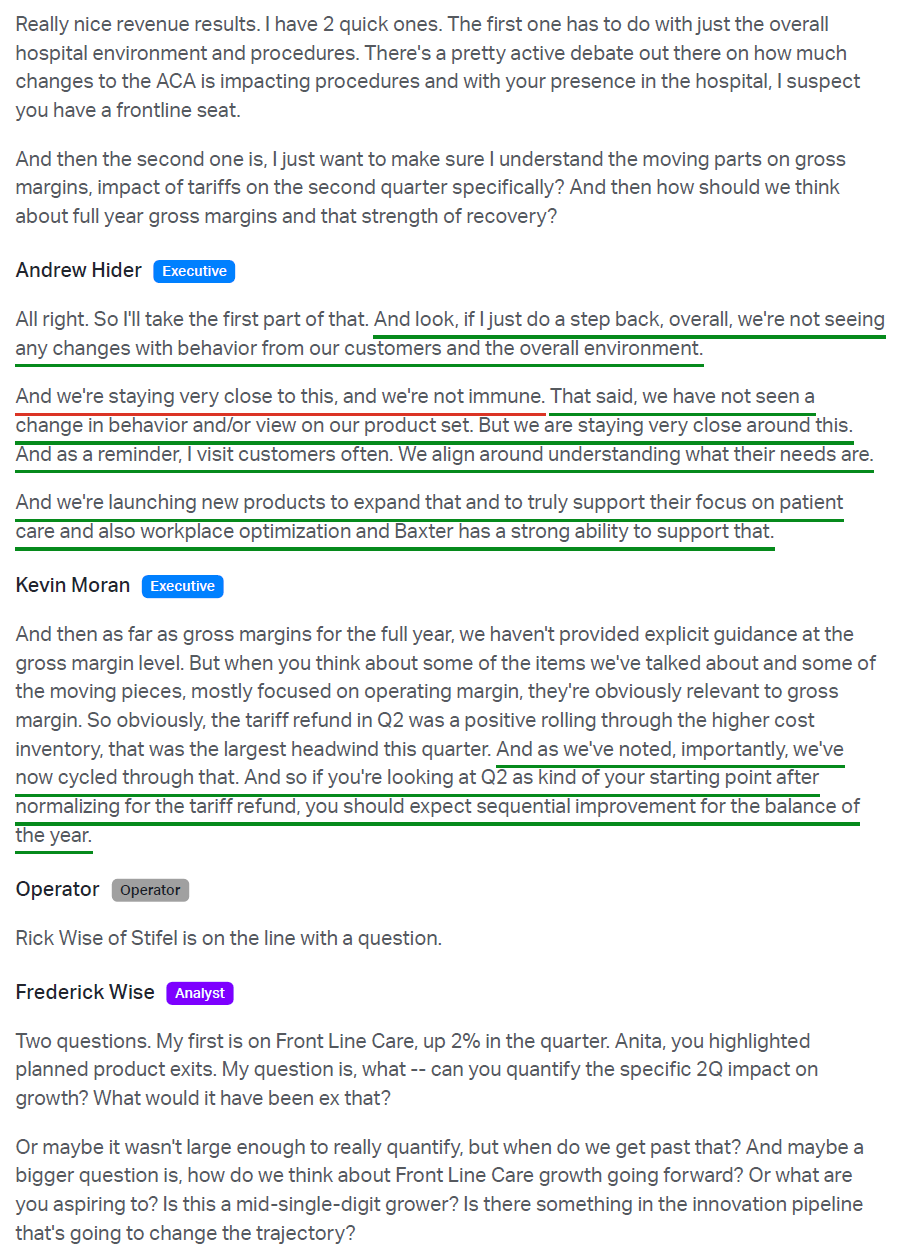
2) Adjusted gross margin of 38.6% (-210 bps) and adjusted operating margin of 14.2% (-90 bps) brought YTD margins to 37.7% gross and 12.7% operating. Compression came from the roll-through of higher-cost 2025 inventory and the unfavorable prior-year cost-timing comparison, with lower absorption, tariffs, and lower-margin Drug Compounding mix adding further pressure. Offsets came from the IEEPA tariff refund and SG&A leverage, with adjusted SG&A of $648M (21.9% of sales, -80 bps) reflecting cost actions already flowing through. Management still expects back-half expansion on volume leverage, cost savings, and the now fully cycled-through inventory, with full-year adjusted operating margin guidance held at 13% to 14%.
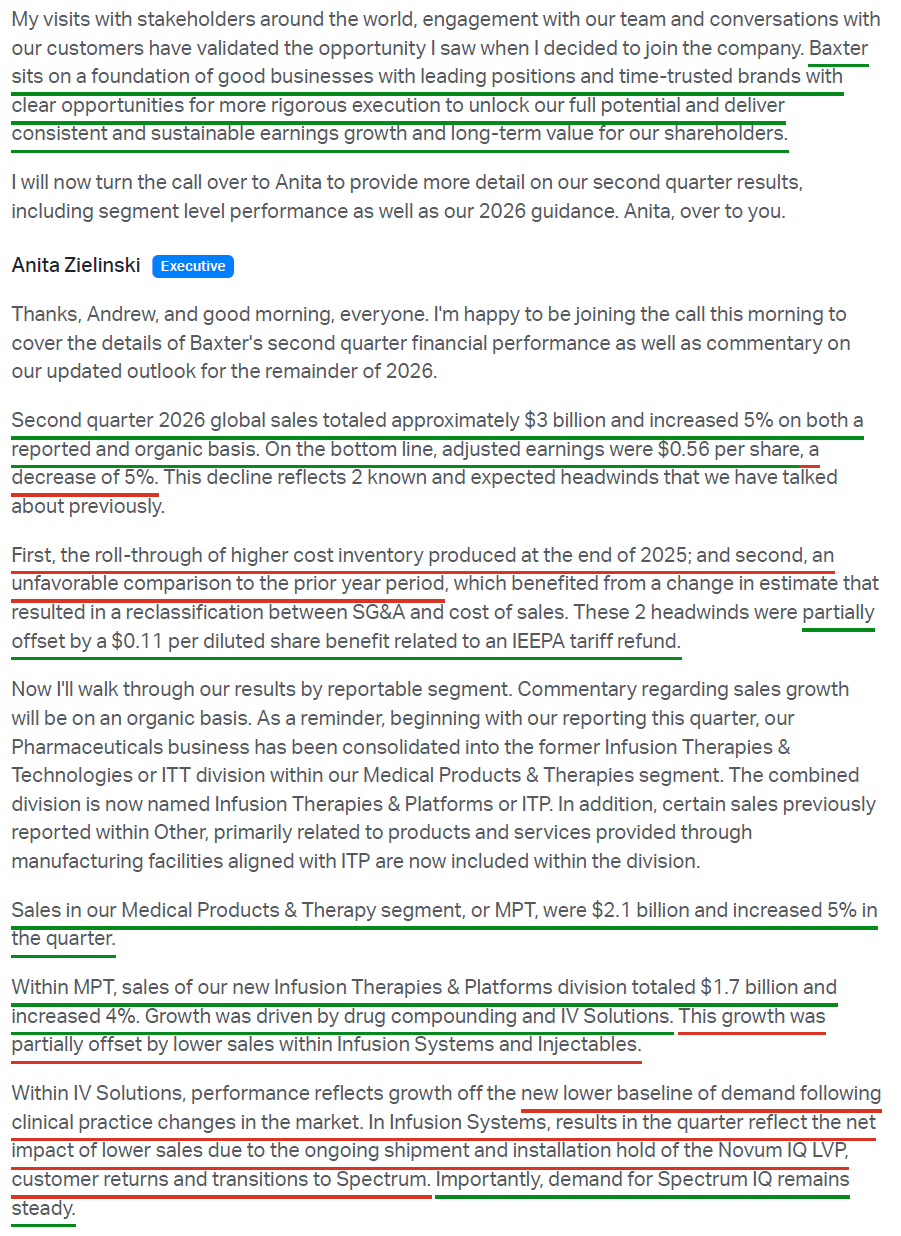
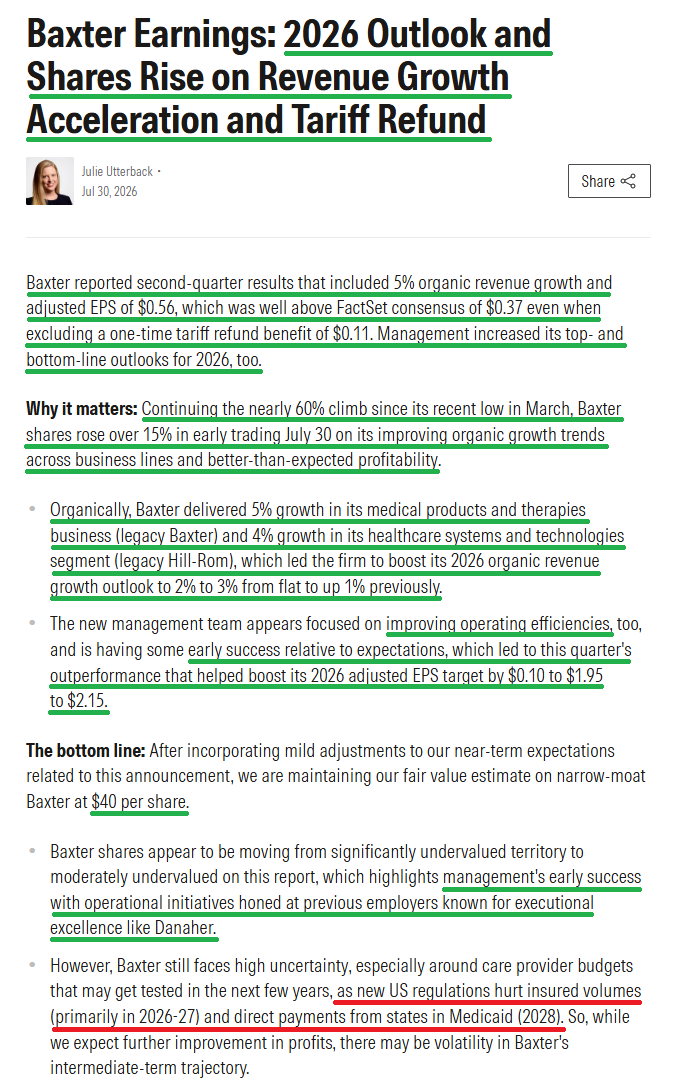
3) Adjusted EPS of $0.56 (-5% Y/Y) came in well above consensus of $0.37, with the ~$0.11 ($75M) one-time IEEPA tariff refund backed out still leaving a clear beat of ~22%. The Y/Y decline was expected, driven by the same higher-cost inventory and prior-year cost-timing headwinds that pressured margins.
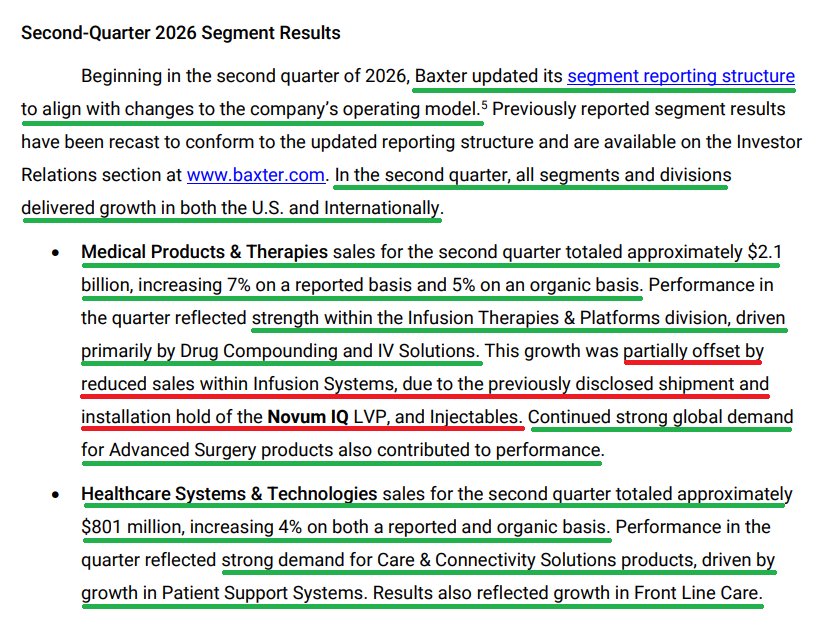
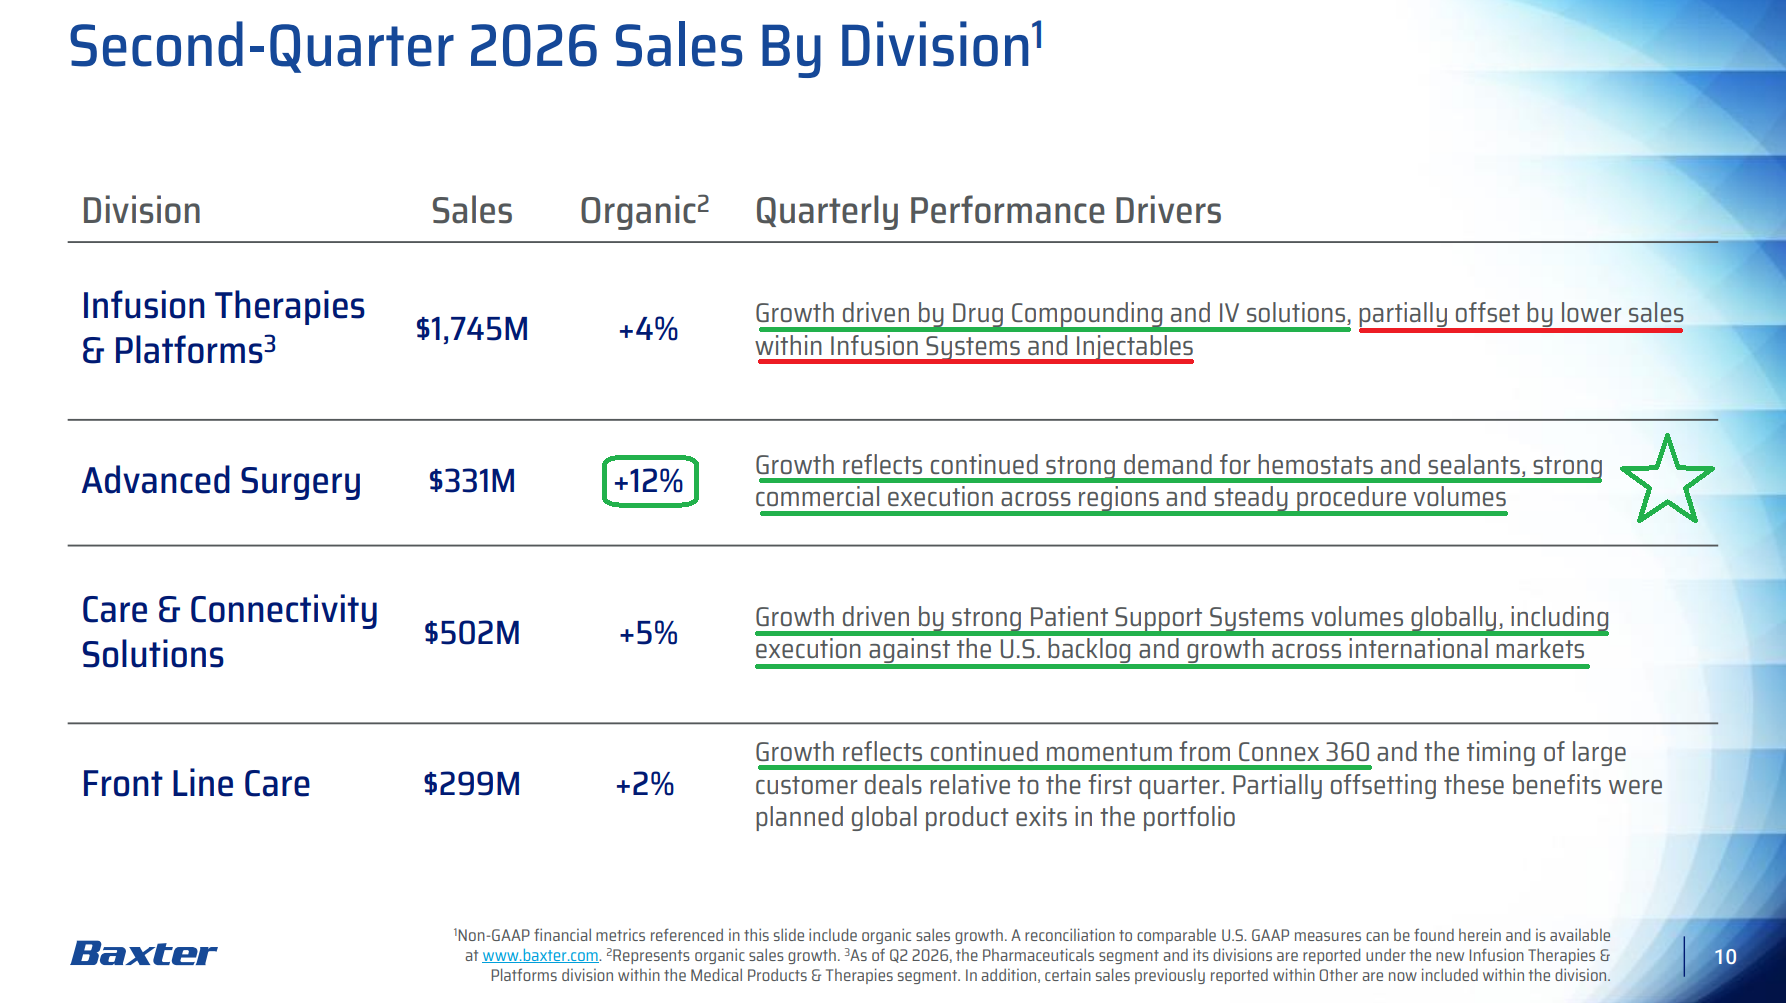
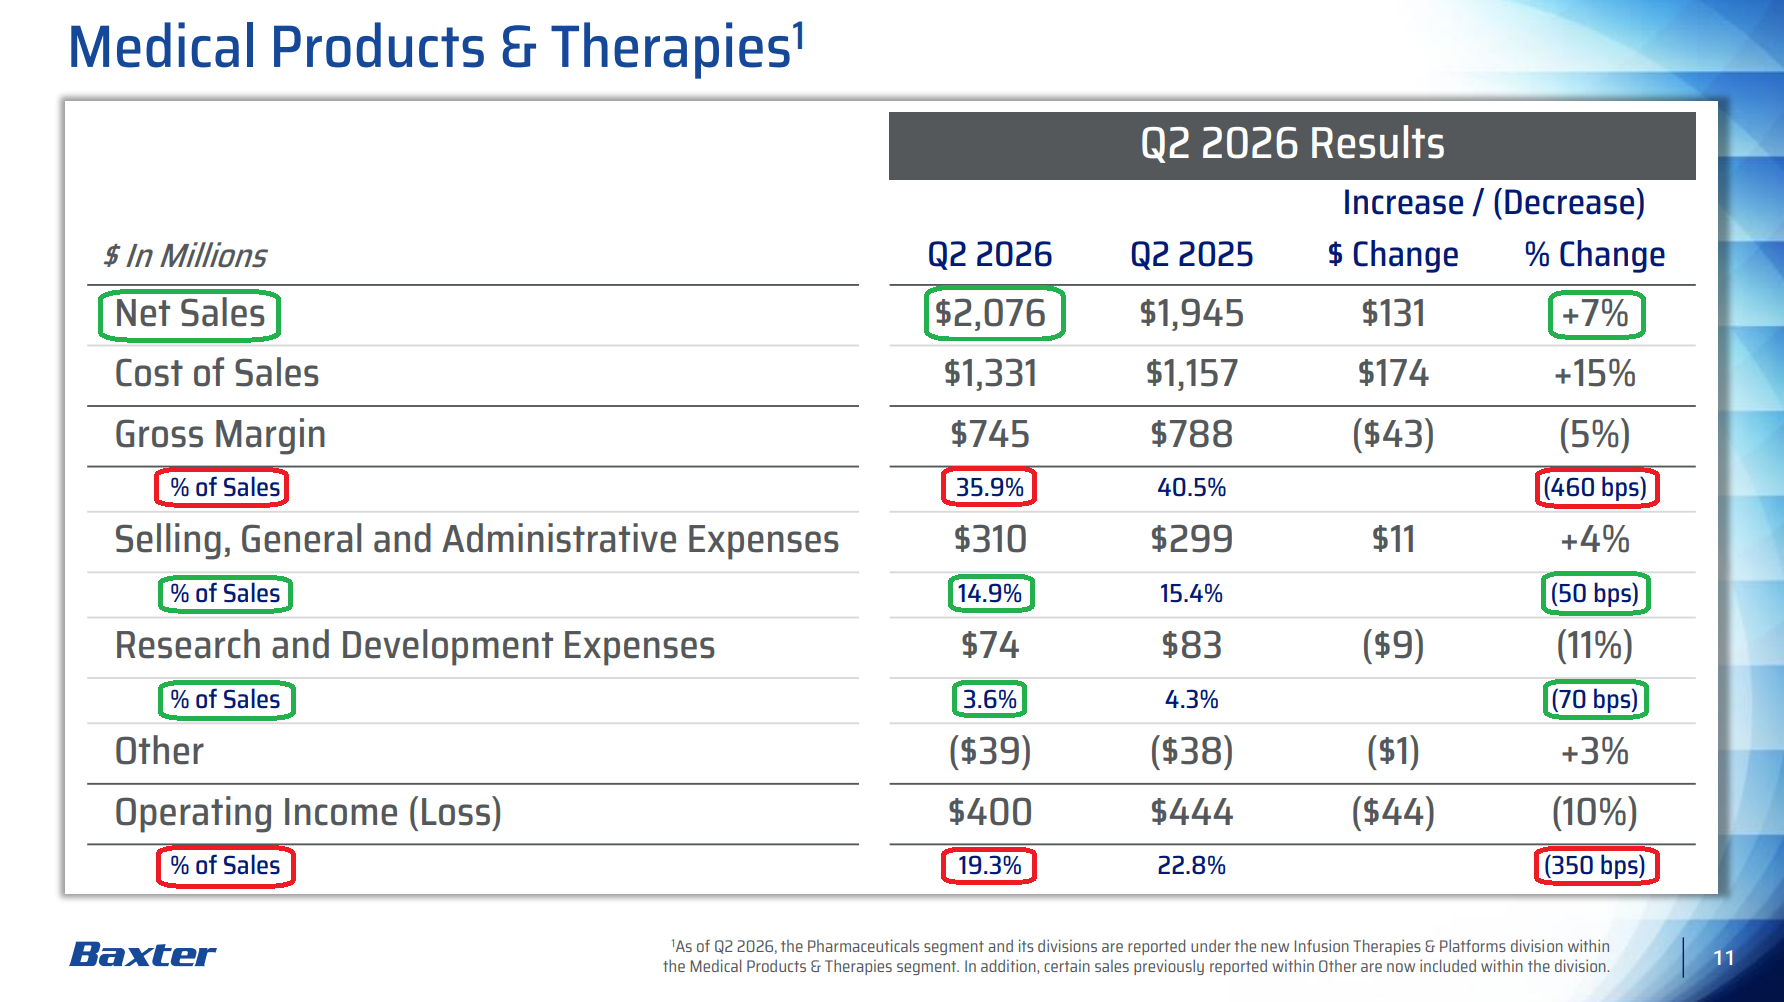
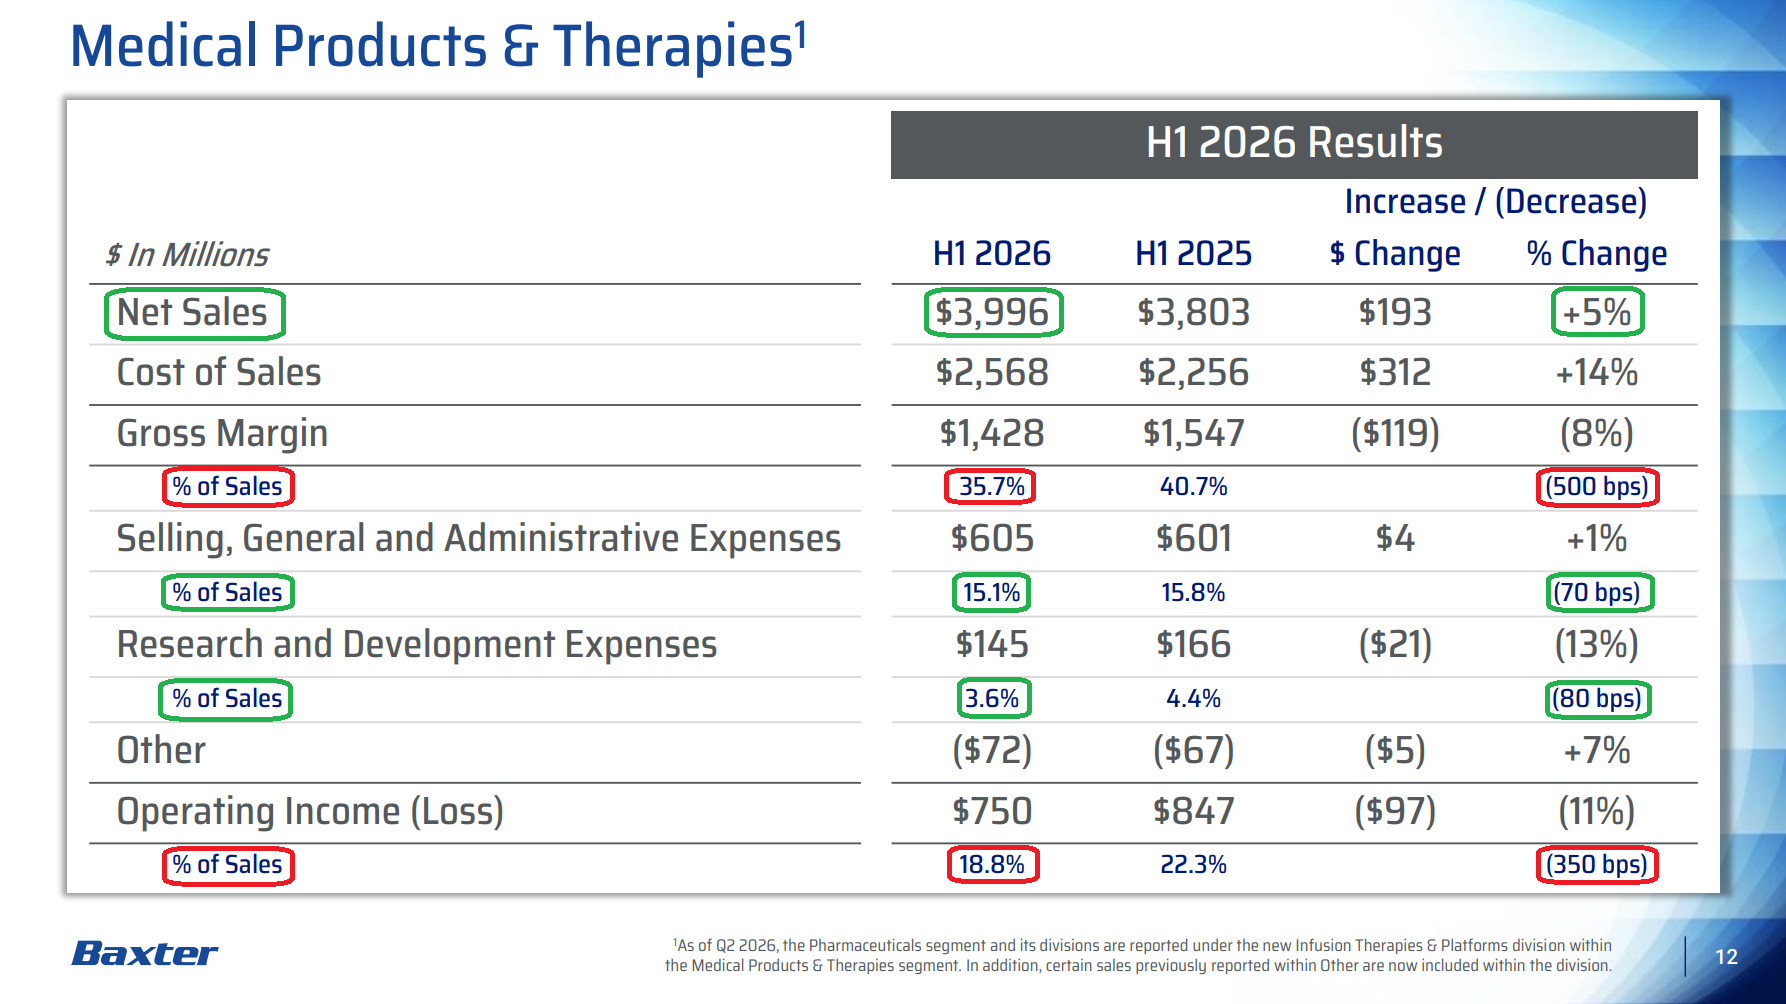
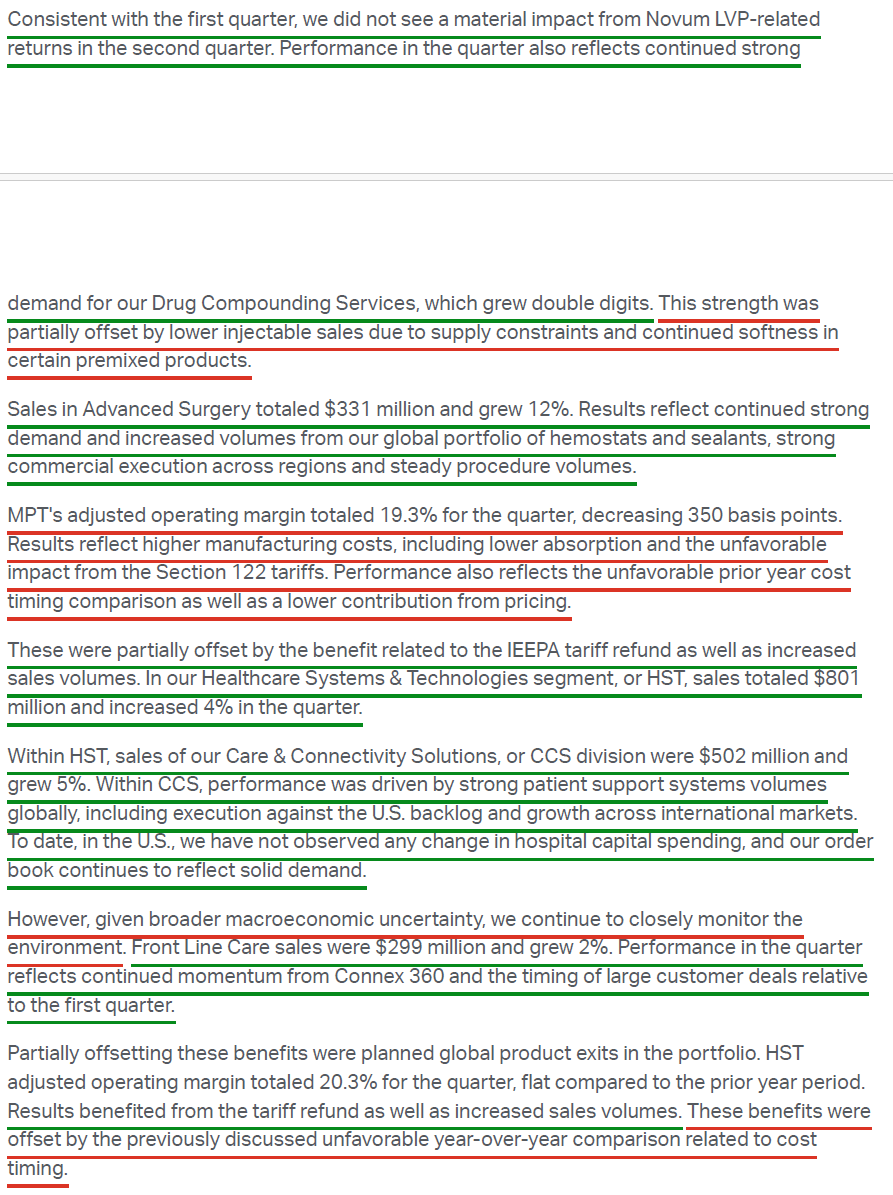
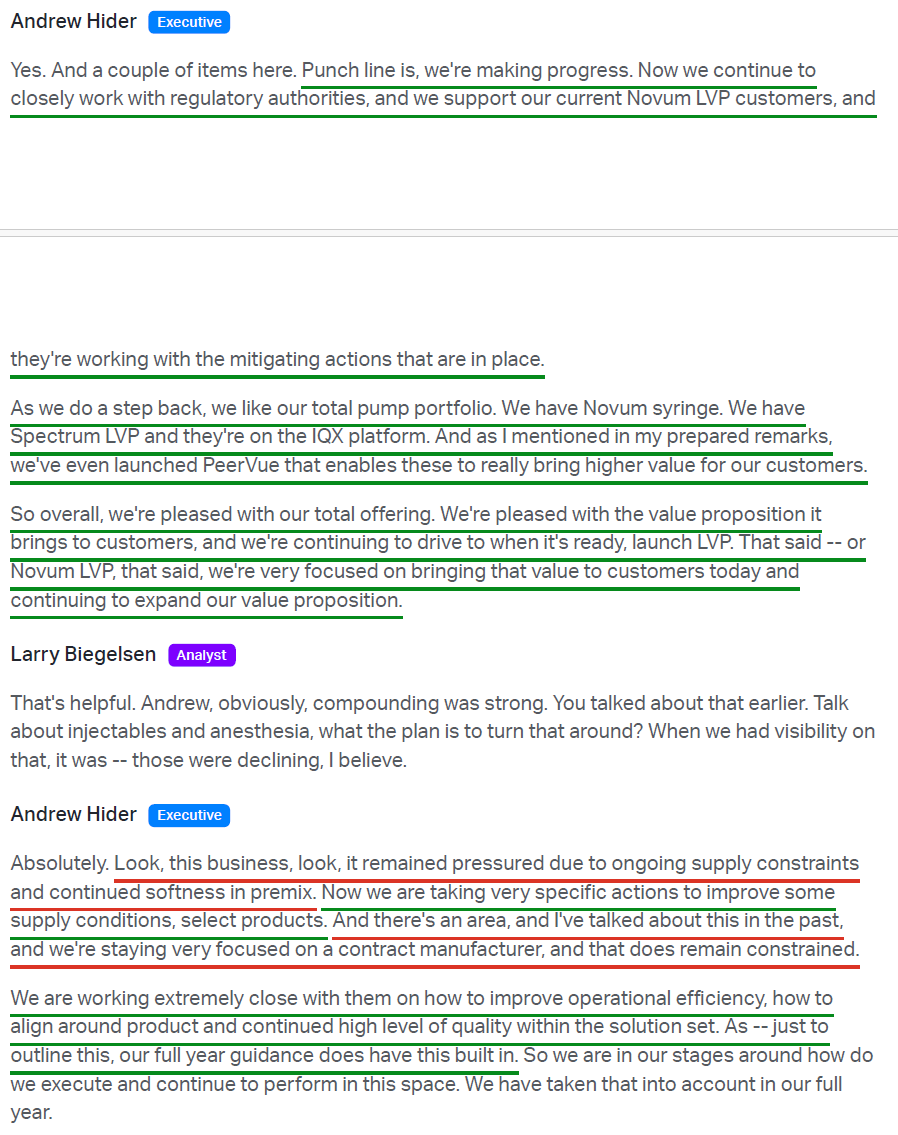
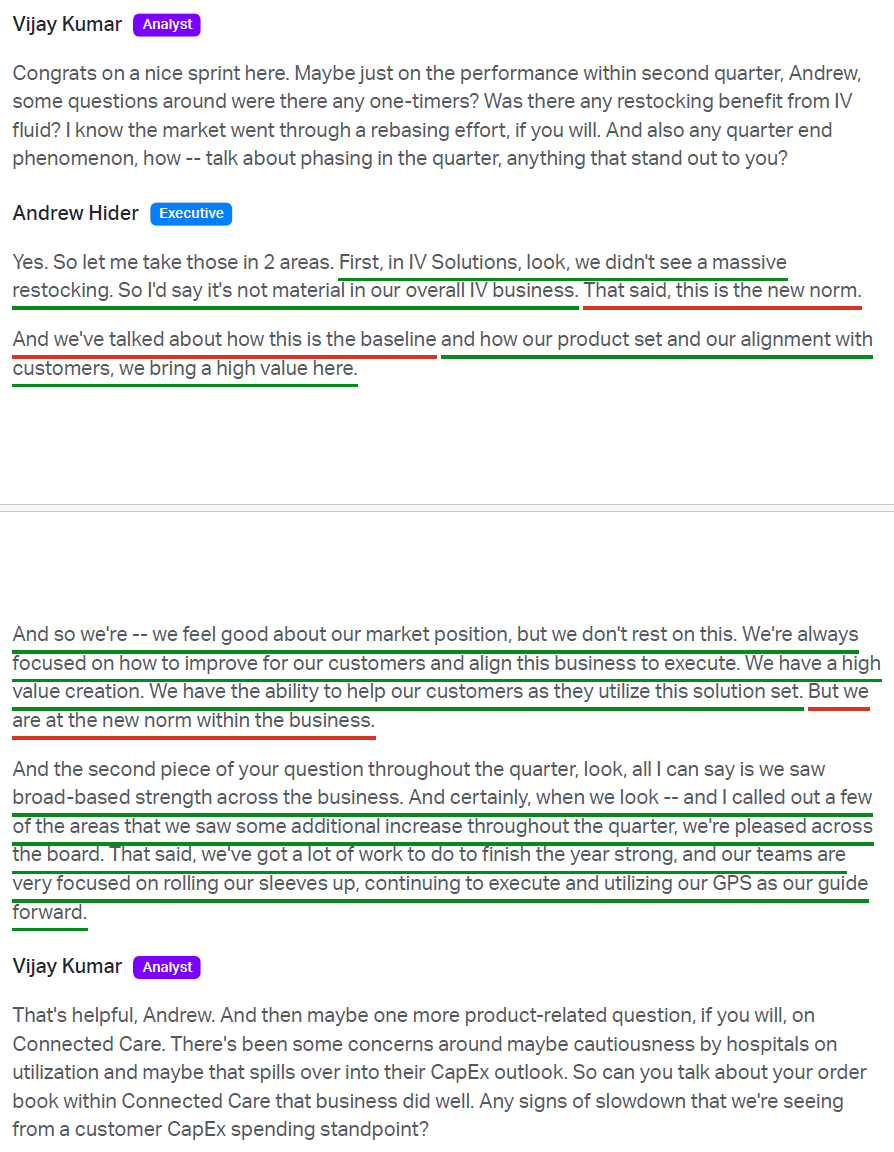
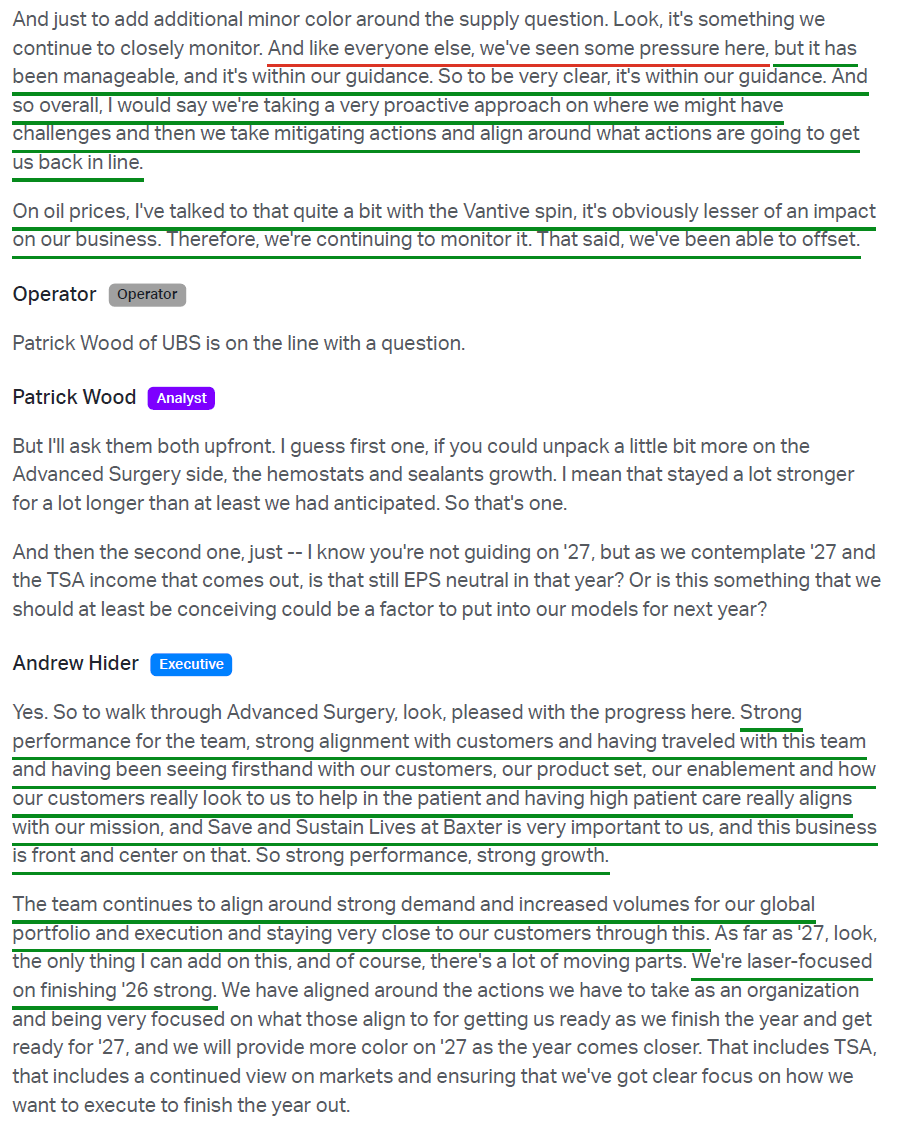
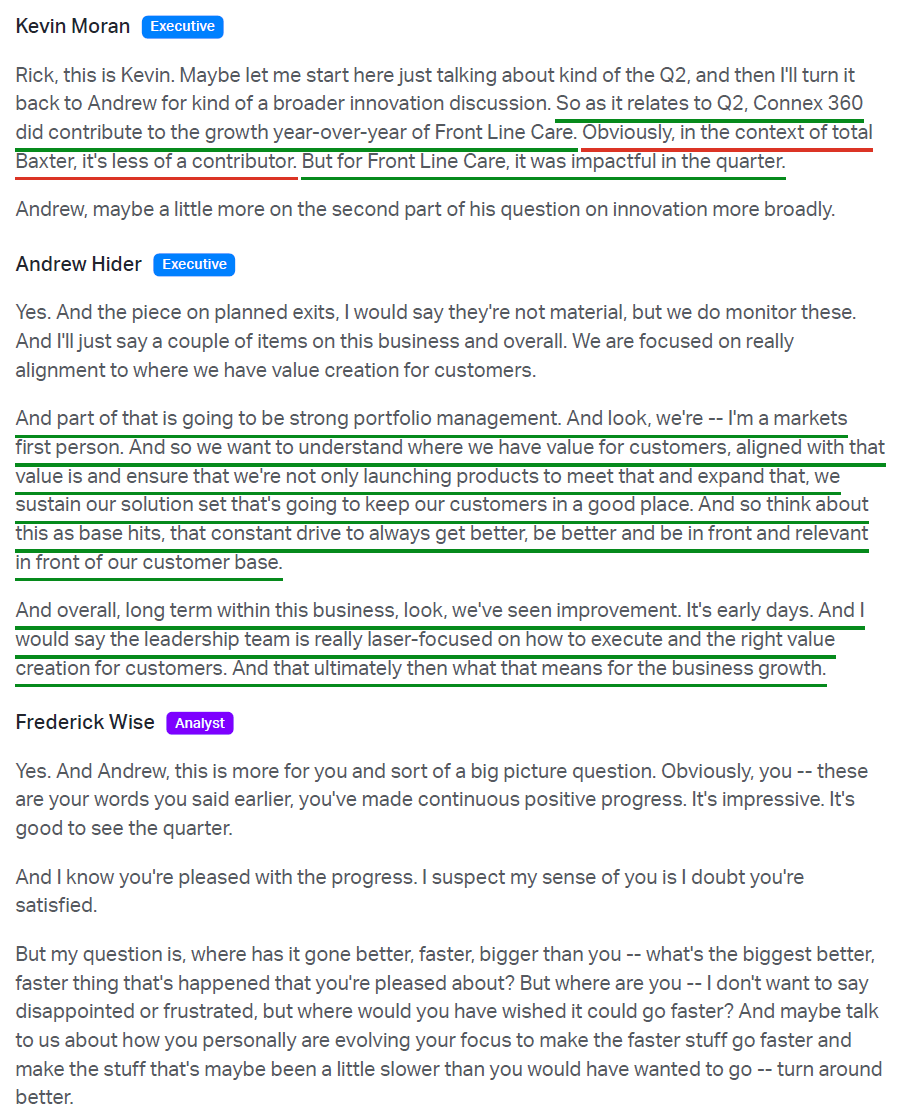
4) Medical Products & Therapies revenue of $2.08B grew 7% reported and 5% organic, with operating income of $400M versus $444M a year ago and adjusted operating margin of 19.3% (-350 bps). Infusion Therapies & Platforms posted $1.75B (+4% organic) on double-digit growth in Drug Compounding and strength in IV Solutions, partially offset by lower Infusion Systems sales tied to the Novum hold and continued softness in Injectables from contract manufacturing supply constraints and weak premix. Advanced Surgery grew 12% to $331M on sustained global demand for hemostats and sealants, strong commercial execution, and steady procedure volumes. On IV Solutions, growth is coming off the new lower baseline rather than any restocking benefit, with management seeing no change in customer behavior.
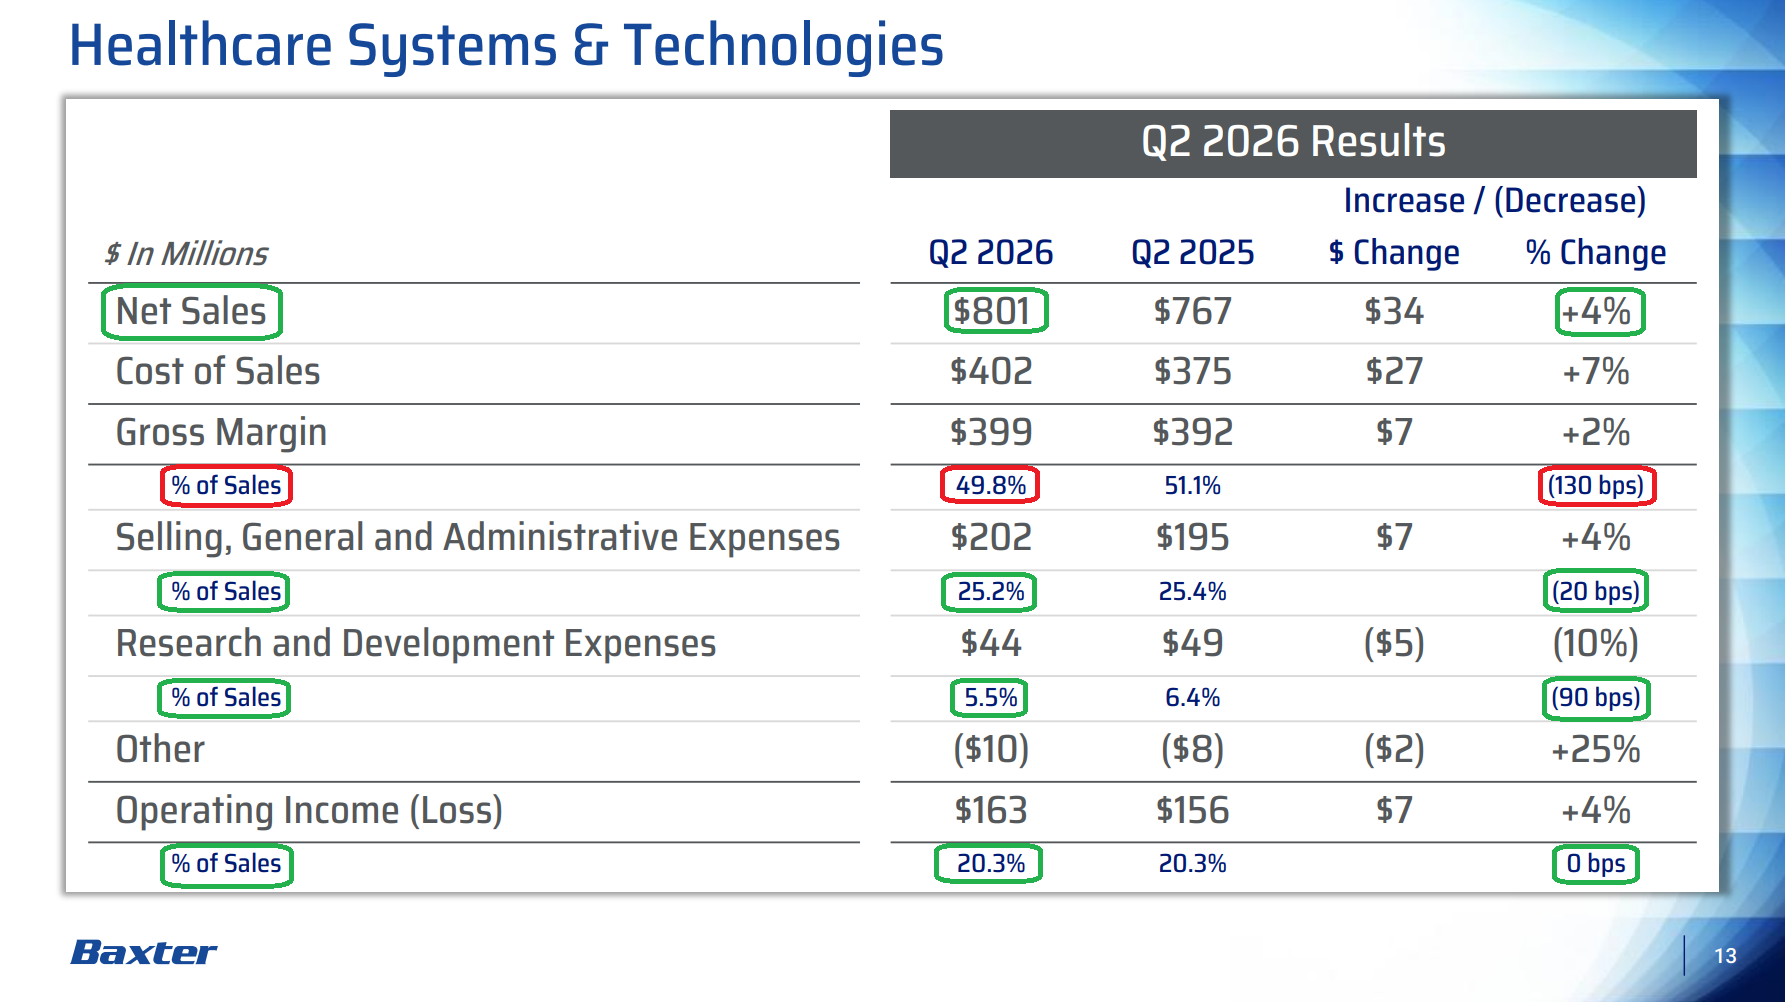
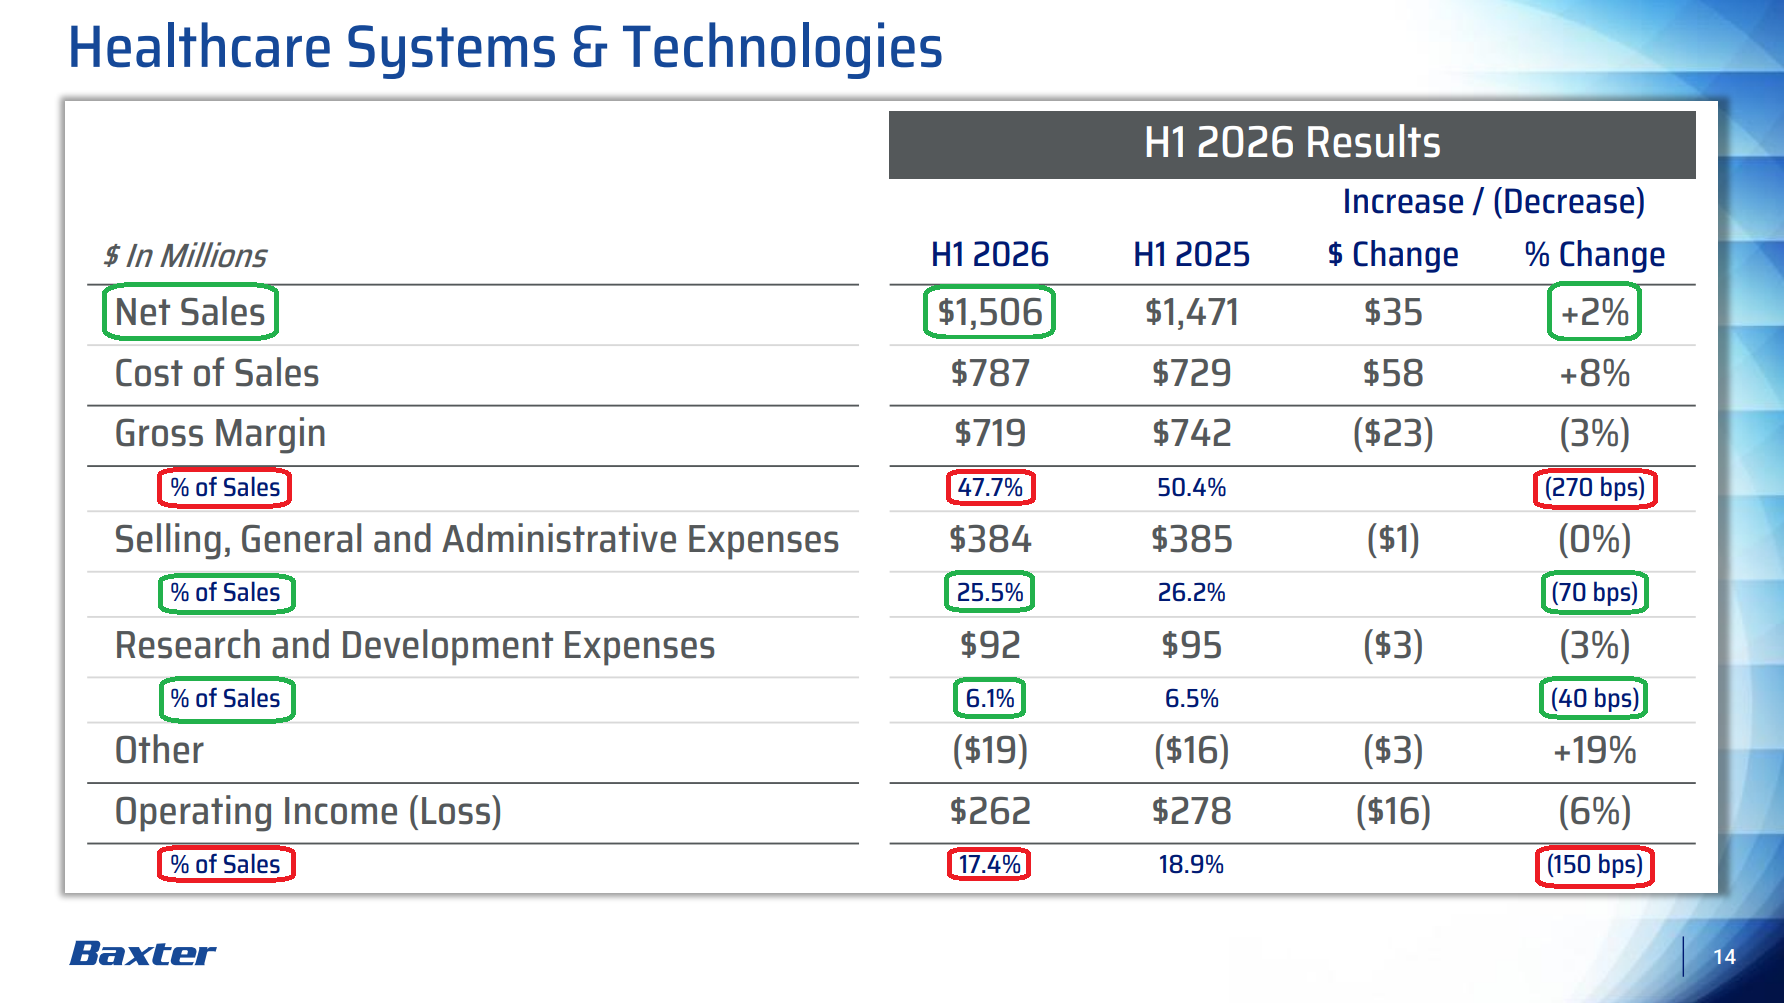
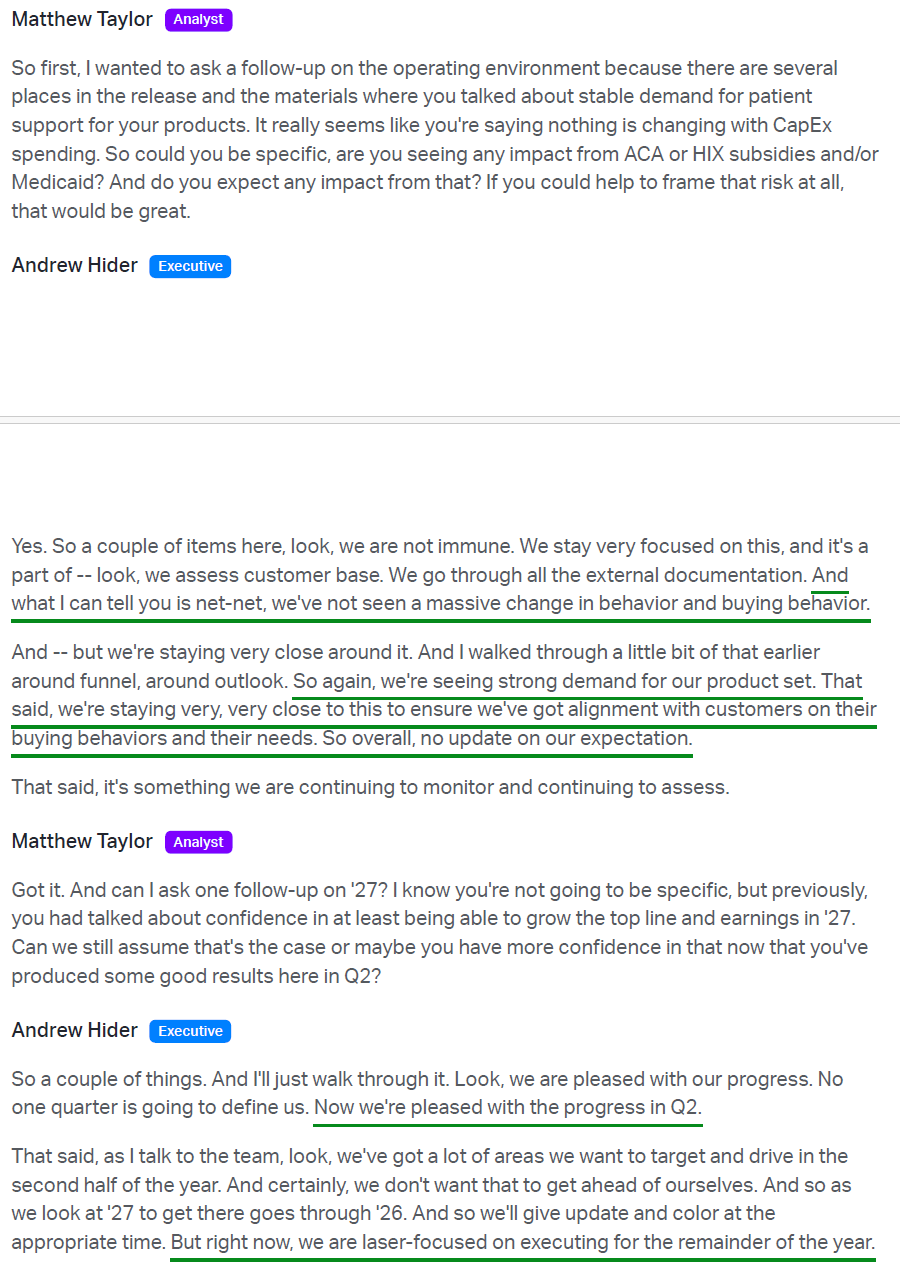
5) Healthcare Systems & Technologies revenue of $801M grew 4% on both a reported and organic basis, with operating income of $163M and adjusted operating margin of 20.3%, flat Y/Y. Care & Connectivity Solutions grew 5% to $502M on strong Patient Support Systems volumes globally, including execution against the U.S. backlog and international growth, with Dynamo, the smart hospital stretcher, building a commercial funnel and launching in Canada, its first international expansion. Front Line Care grew 2% to $299M on Connex 360 momentum and the timing of large customer deals relative to Q1, partially offset by planned global product exits that management called immaterial. The bigger callout is that management still hasn’t seen any change in U.S. hospital capital spending, with the order book reflecting solid demand despite noise around ACA exchange subsidies and Medicaid.
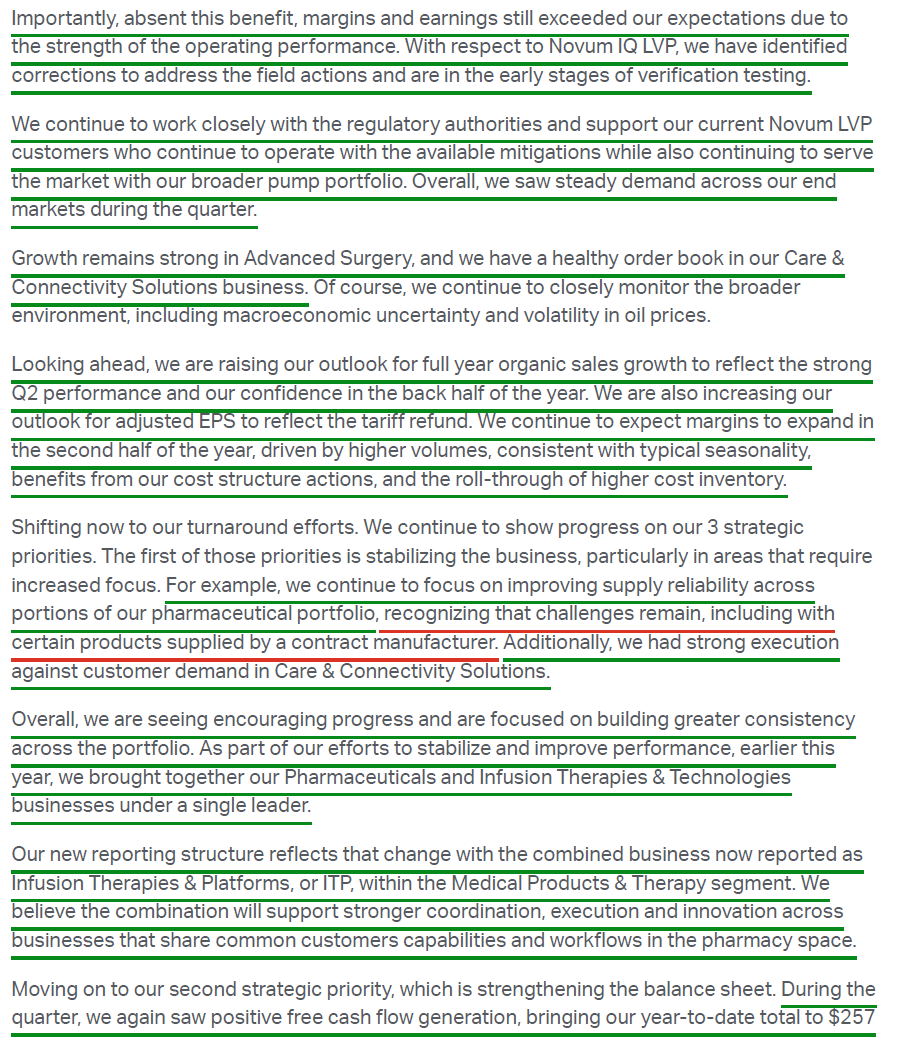
6) Baxter has identified corrections to address the Novum IQ LVP field actions and is now in early verification testing, a step forward from last quarter, when corrections were still being finalized. Regulatory work continues while current Novum LVP customers operate under the available mitigations, with no material impact from Novum-related returns again this quarter. Spectrum IQ remains the workhorse absorbing the gap with steady demand, alongside Novum syringe on the IQX platform and the new PeerVue digital benchmarking launch, which further differentiates the offering. Full-year guidance still assumes the ship and installation hold and related customer uncertainty persist, with the Infusion Systems comparison easing in the back half as Baxter laps the hold.
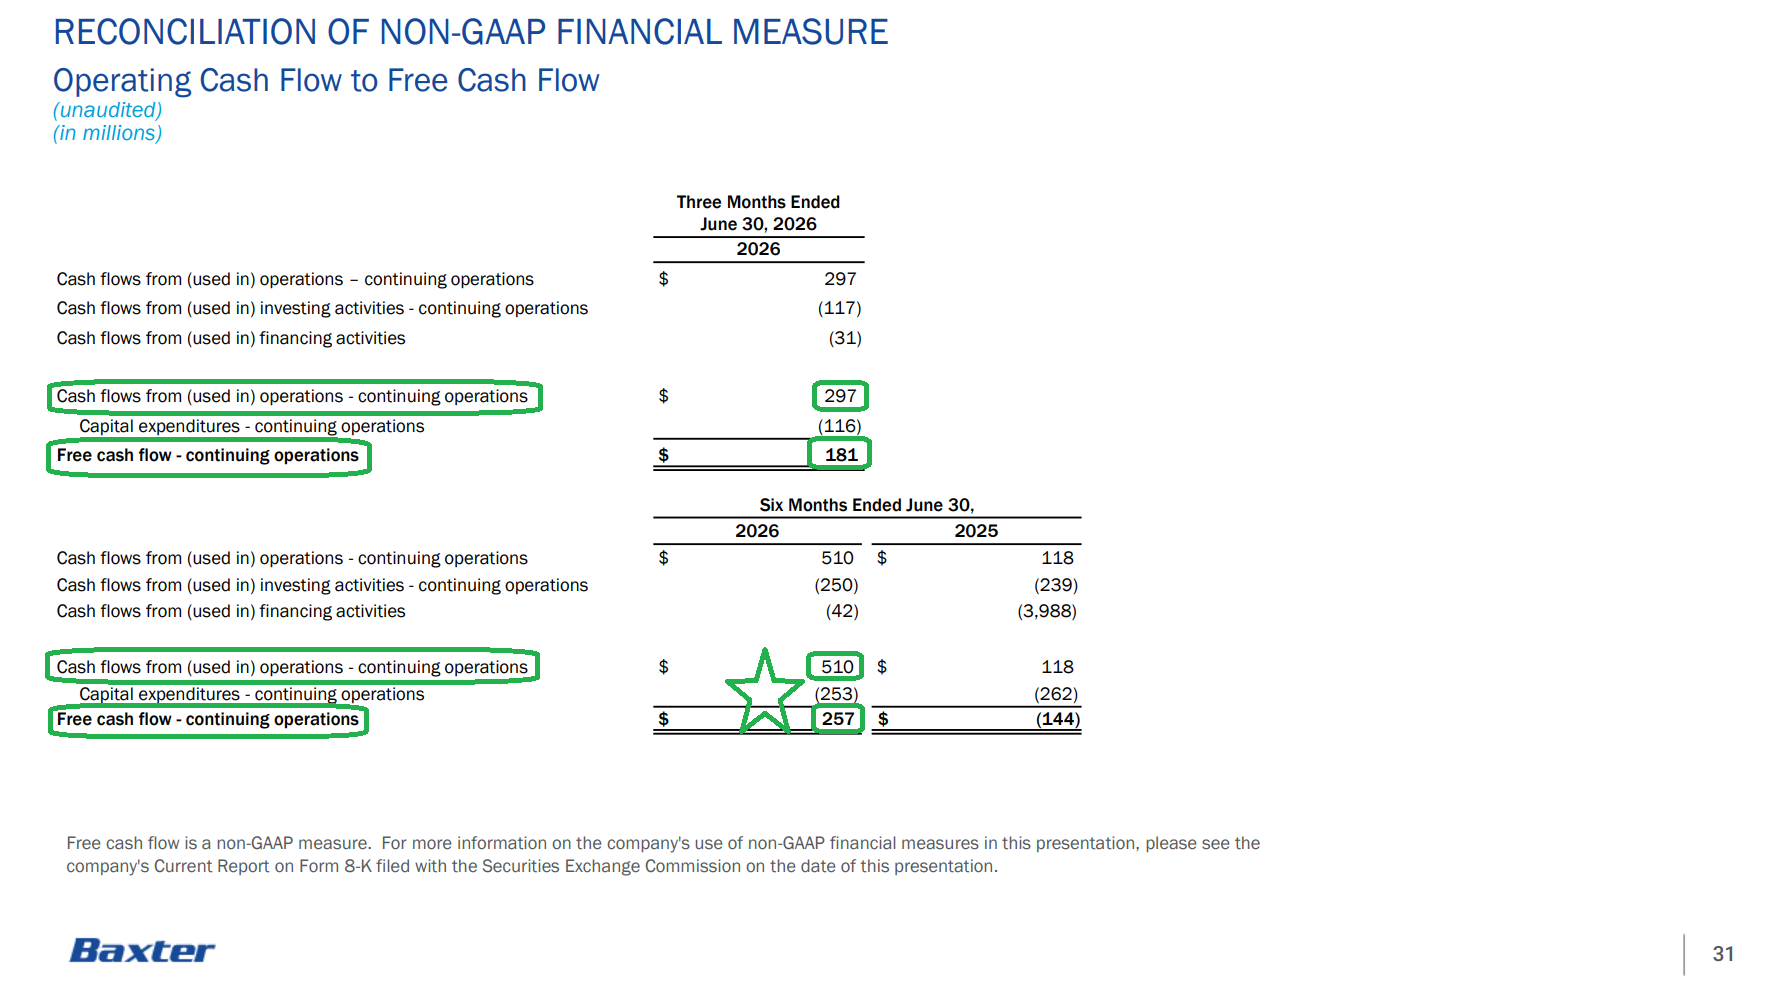
7) Free cash flow of $181M in the quarter was up ~135% Y/Y from $77M and improved sequentially from Q1, swinging first-half FCF to +$257M from a ($144M) outflow in 1H25. The improvement came from better operational performance and execution on targeted areas of working capital, which remains the primary lever. Baxter still expects full-year free cash flow to improve on FY25’s $438M base as it works back toward its historical ~80% conversion rate.
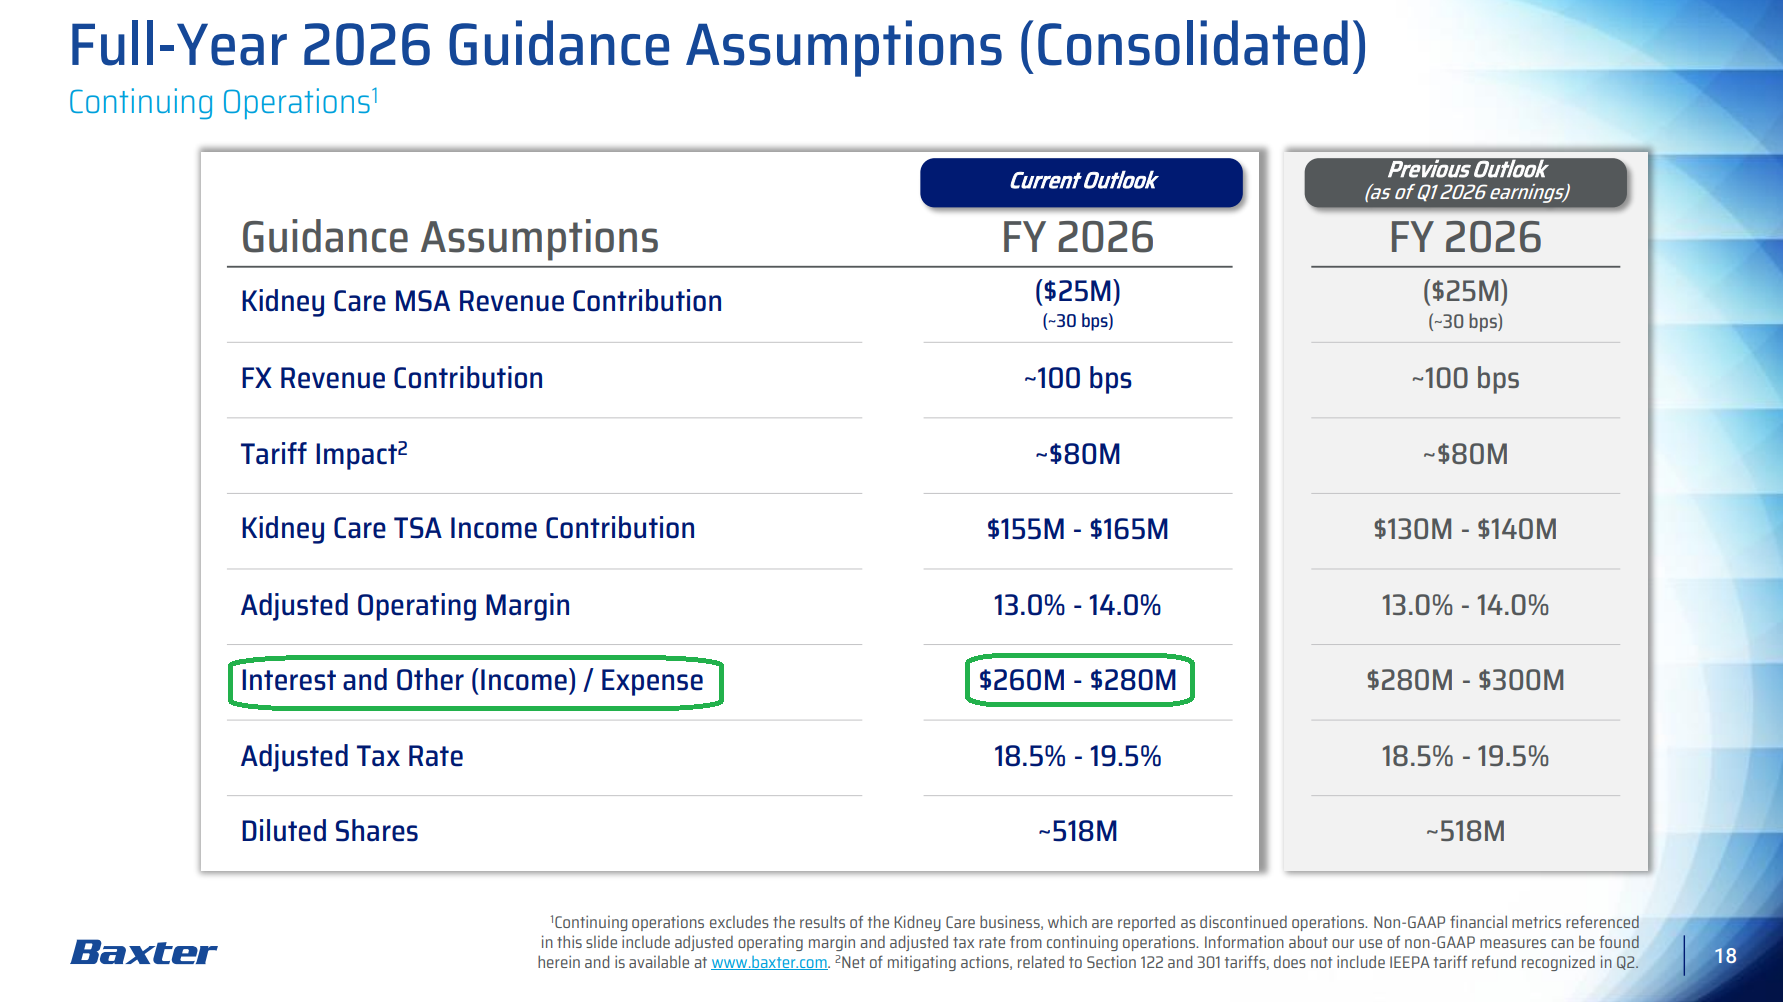
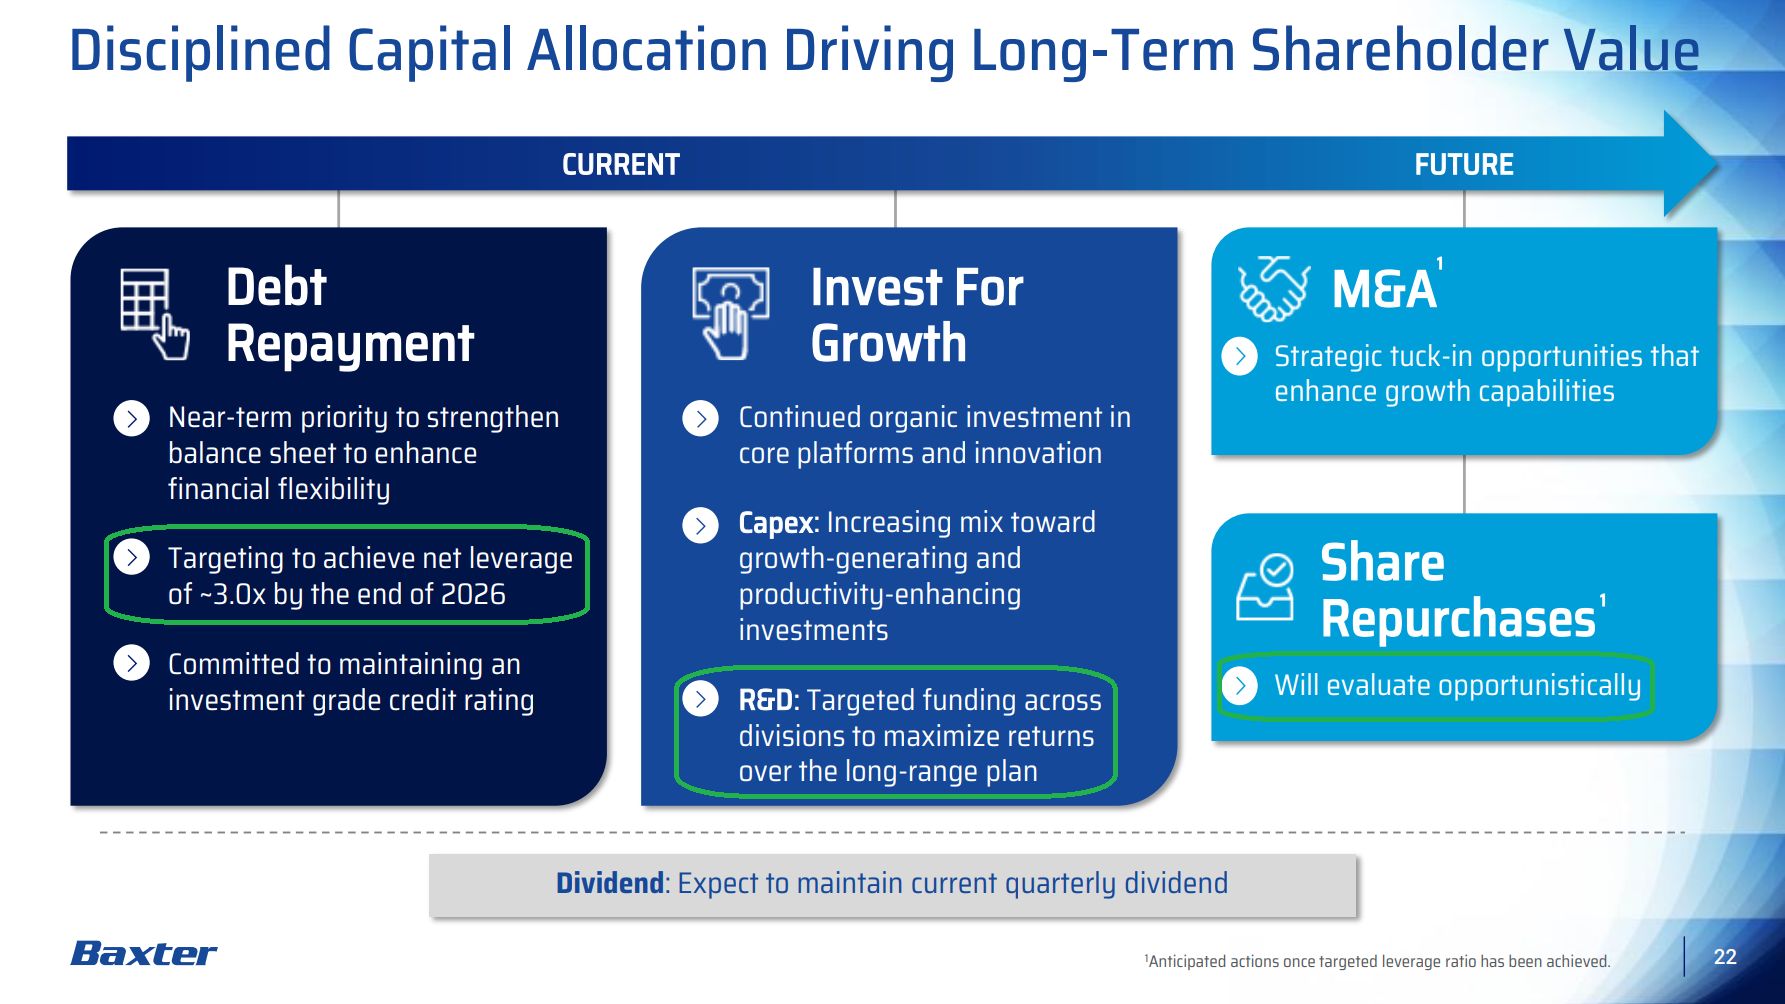
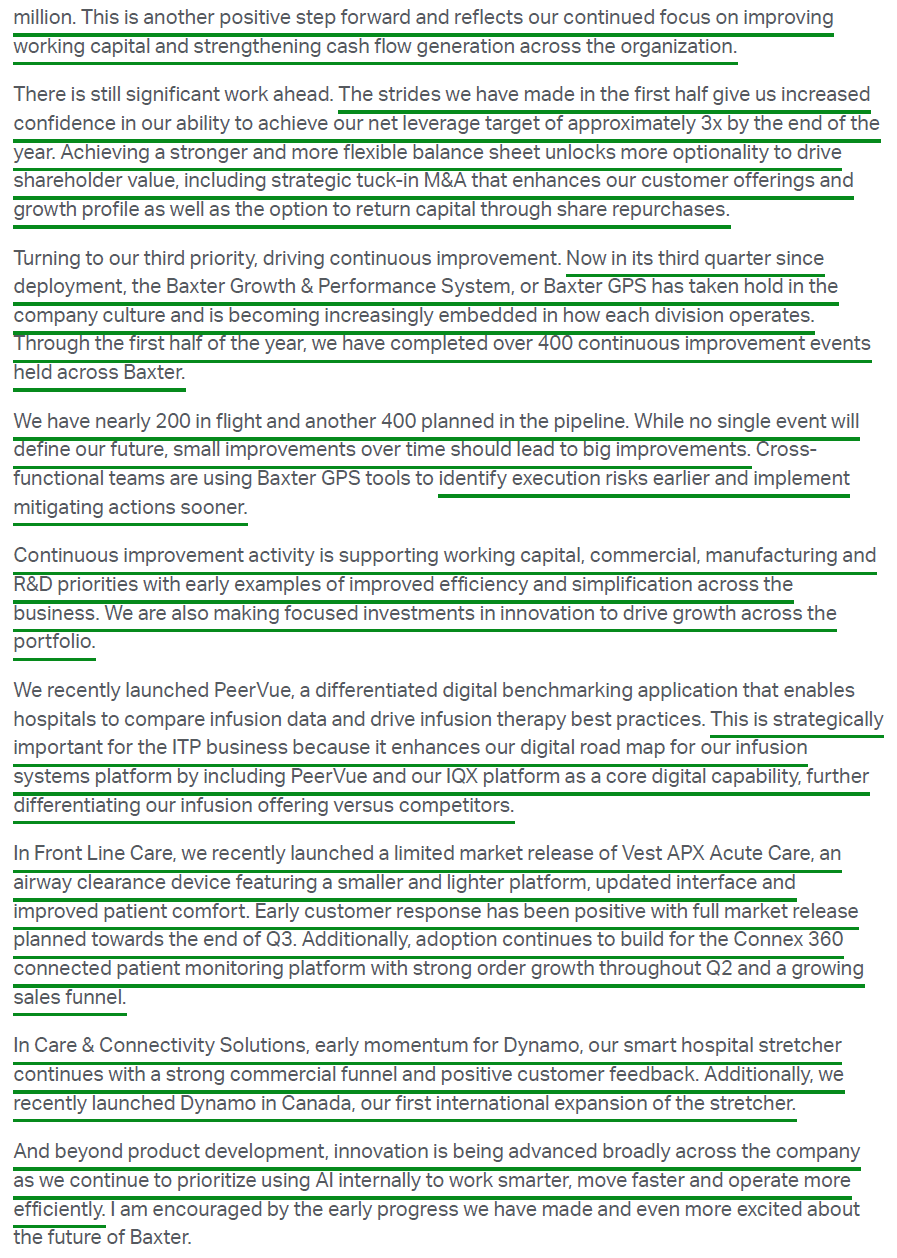
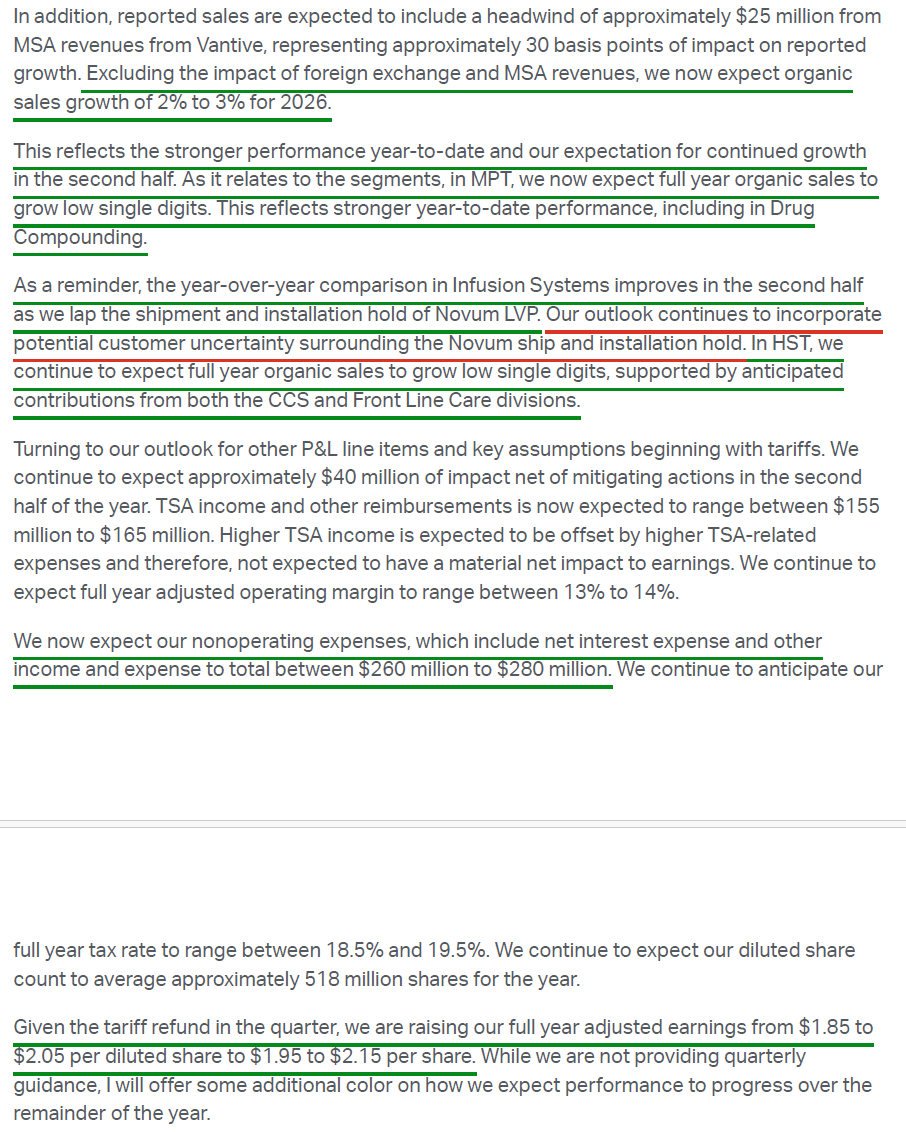
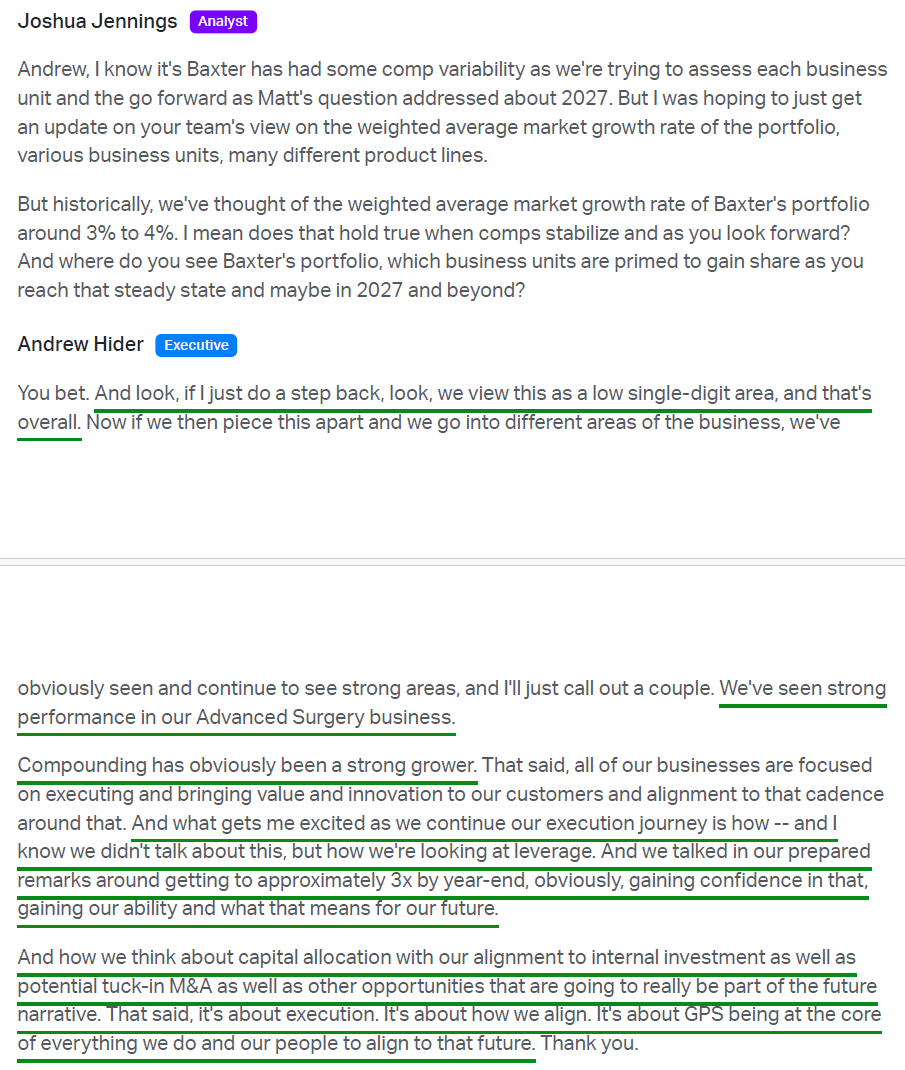
8) Deleveraging remains the top near-term capital allocation priority, with first-half cash generation giving management increased confidence in hitting its ~3.0x net leverage target by year-end while maintaining an investment-grade rating. Once that target is reached, the framework opens up to strategic tuck-in M&A that builds out the customer offering and growth profile, along with opportunistic buybacks. Baxter also lowered its full-year interest and other expense outlook to $260M to $280M from $280M to $300M, with the quarterly dividend held at current levels.
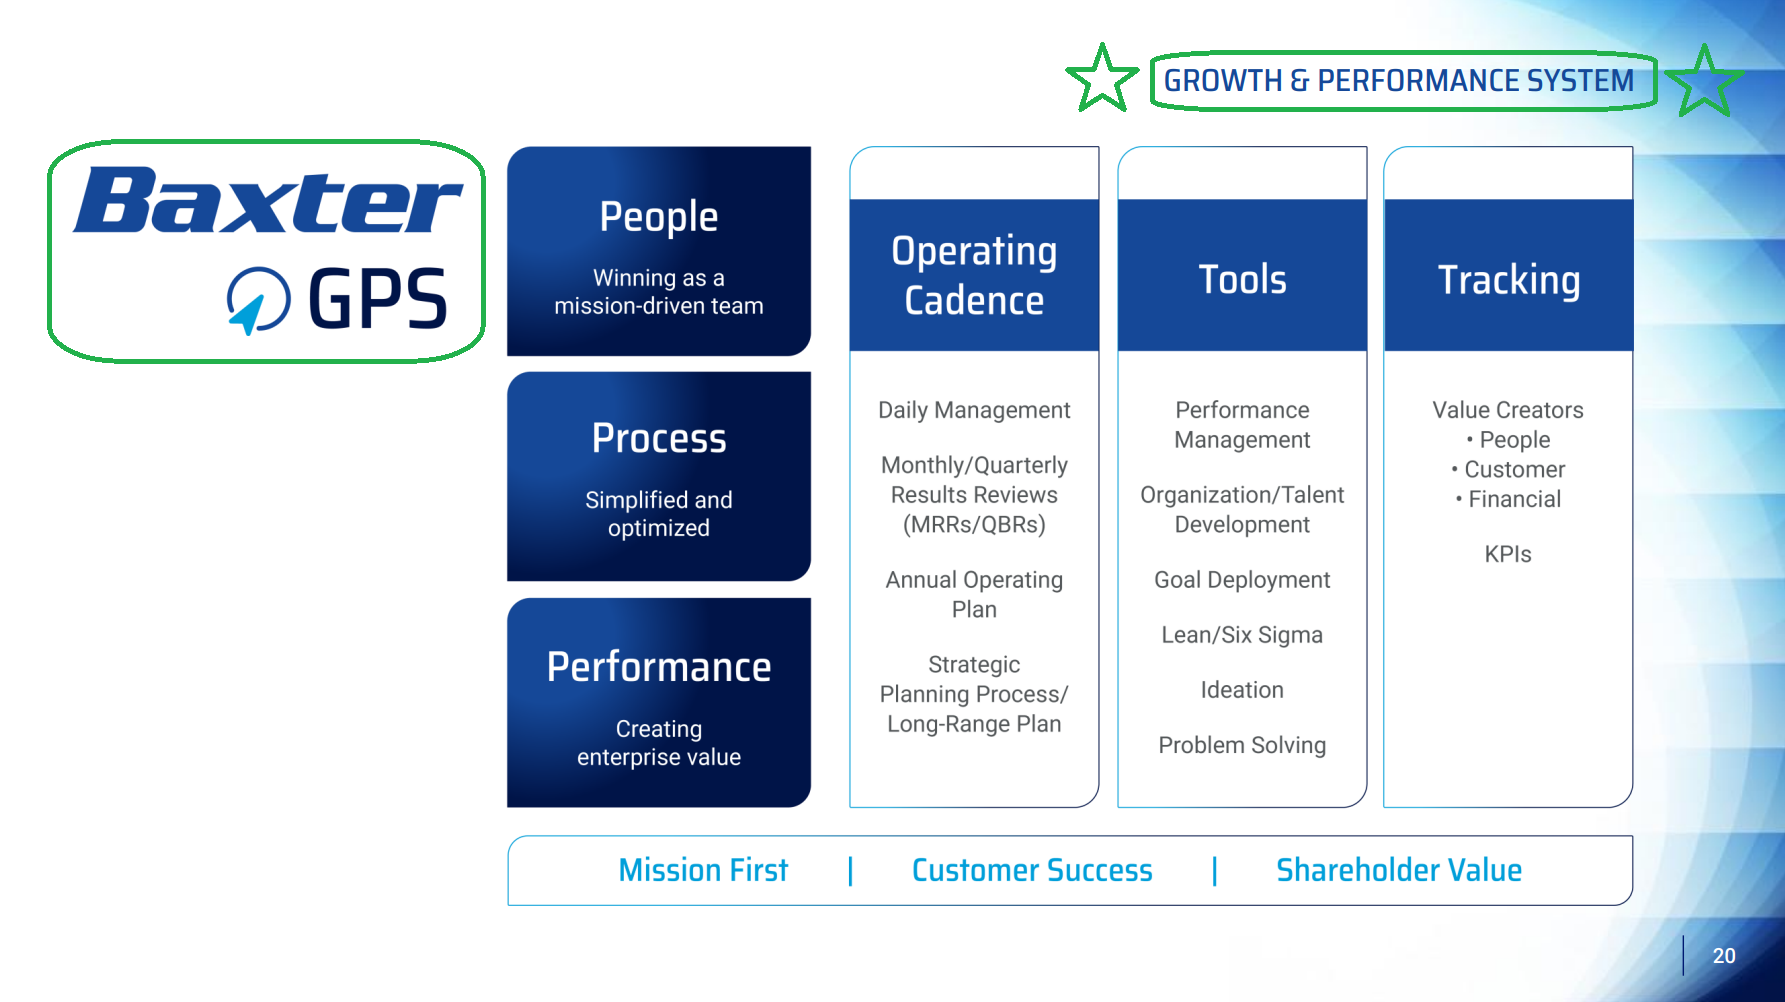
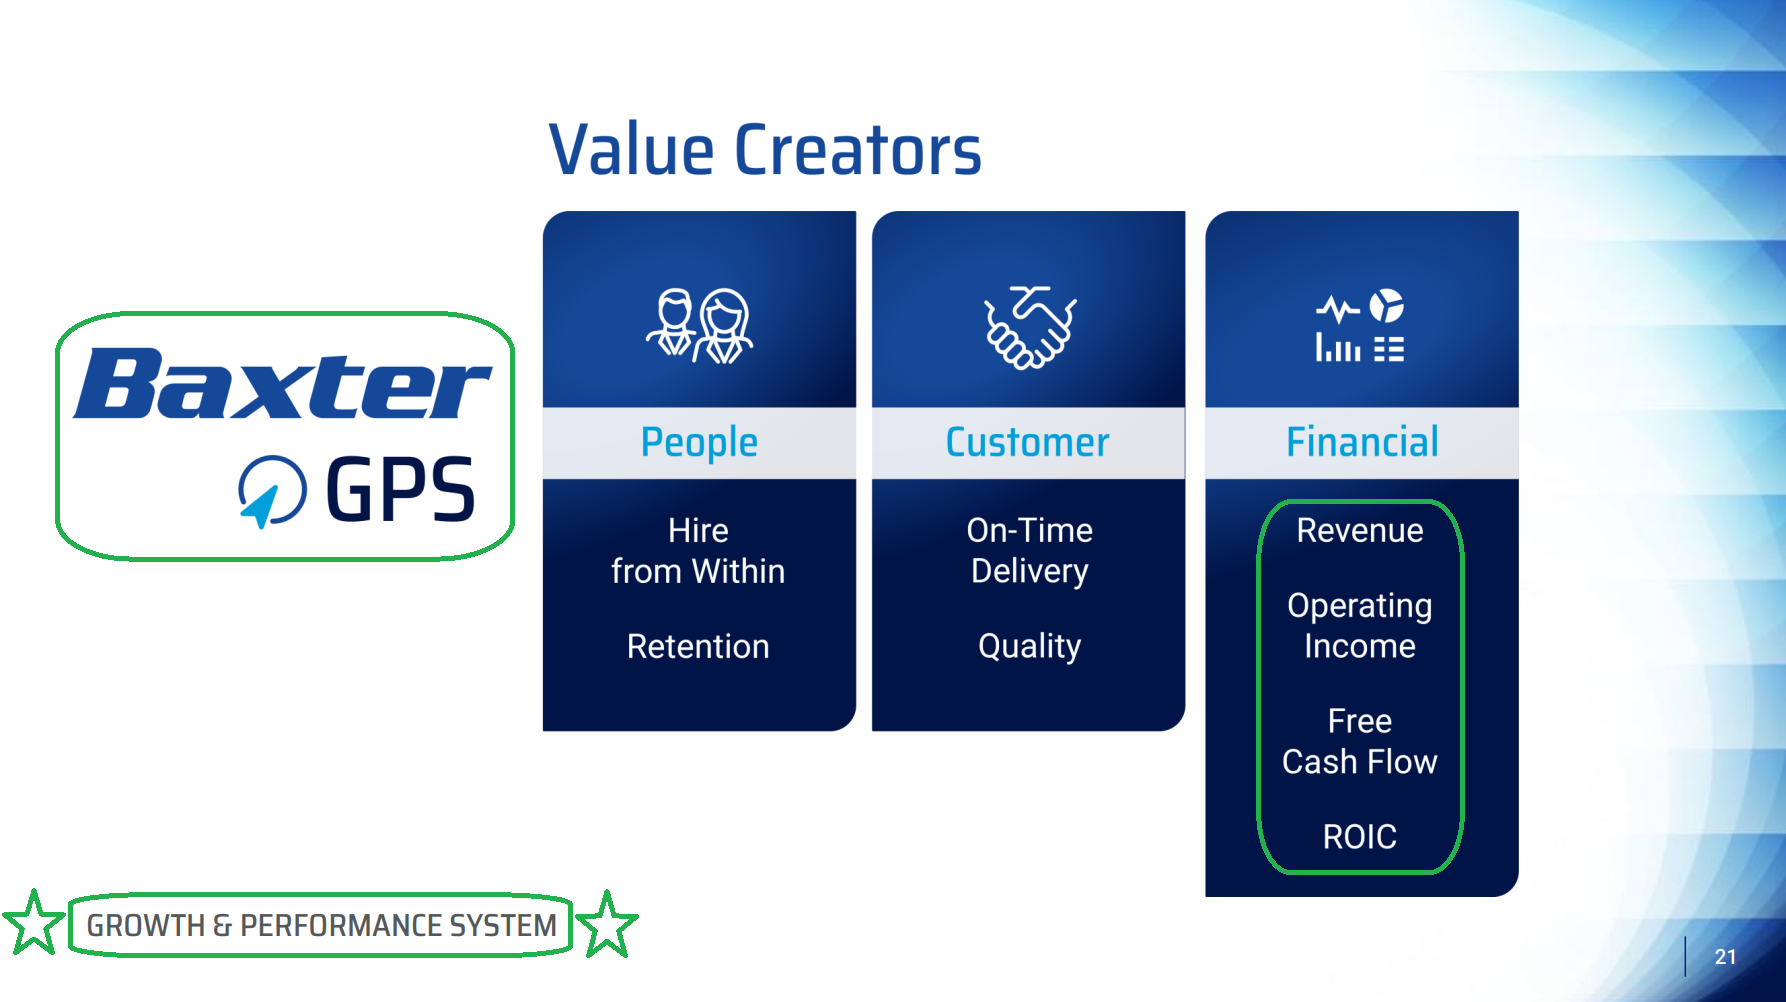
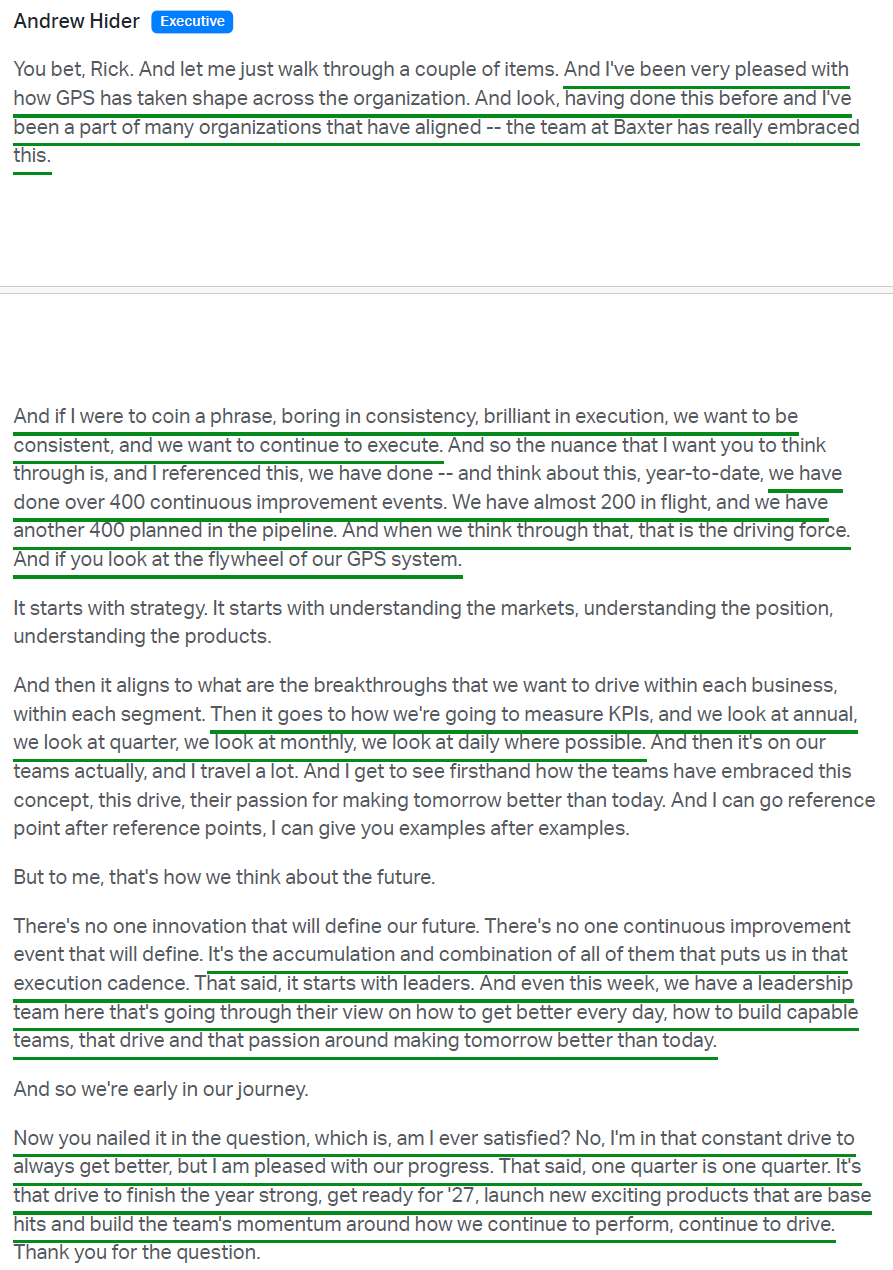
9) Now in its third quarter since deployment, the Growth and Performance System (GPS) is becoming embedded in how each division operates, with over 400 continuous improvement events completed in the first half, nearly 200 in flight, and another 400 planned. Teams across the organization are using GPS tools to identify execution risks earlier and implement mitigating actions sooner, with the work supporting working capital, commercial, manufacturing, and R&D priorities. Hider continues to frame the system as a series of “base hits” that compound over time rather than any single initiative defining the outcome, straight from the Danaher playbook where he spent over a decade.
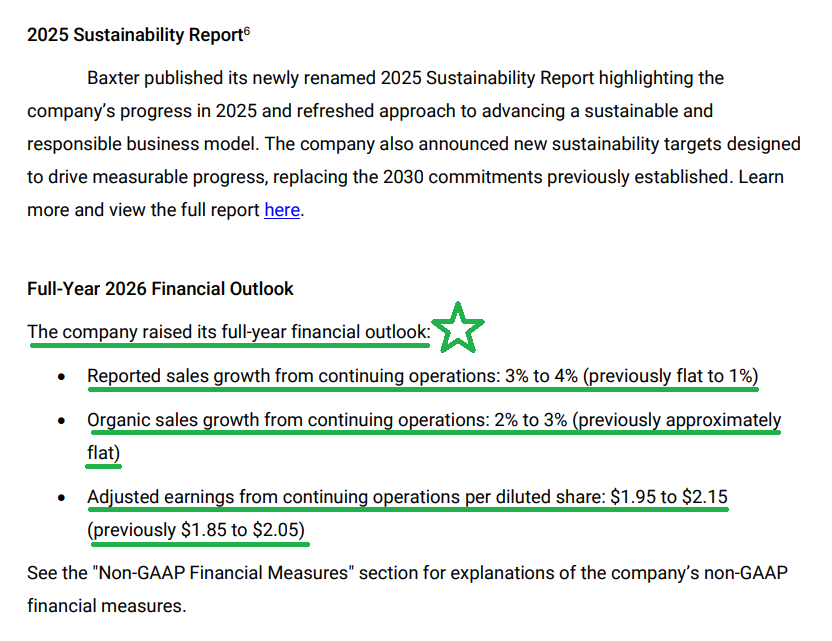
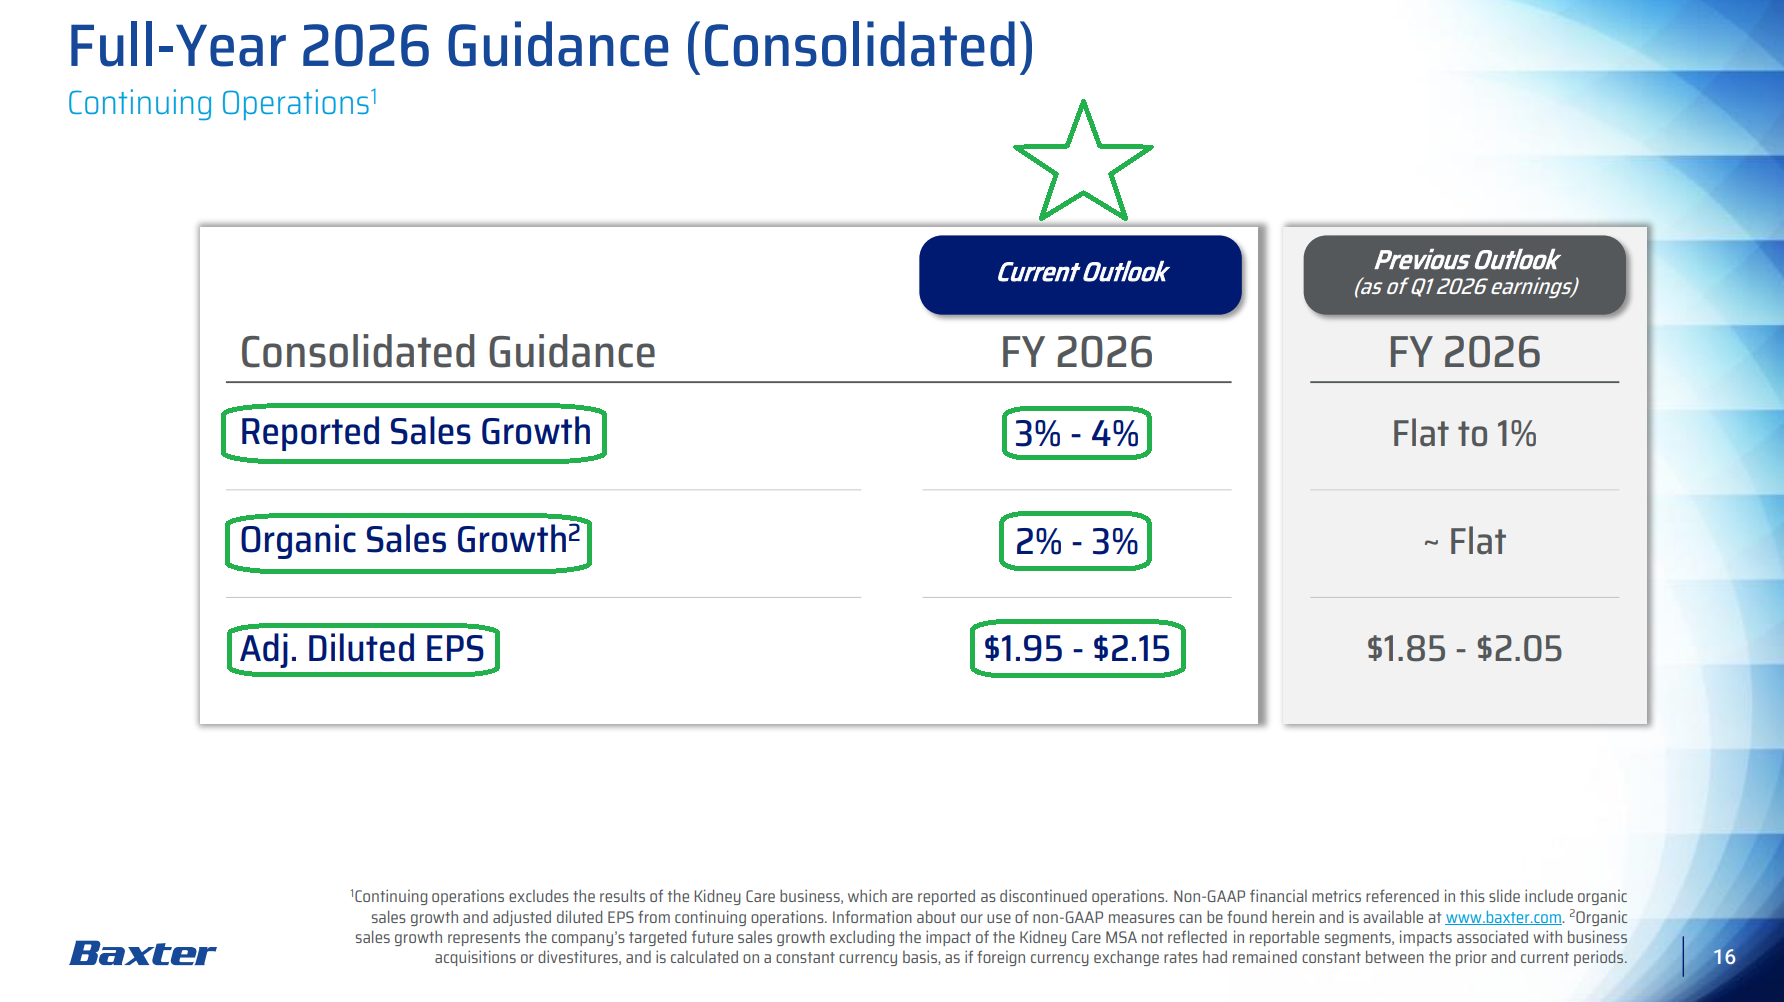
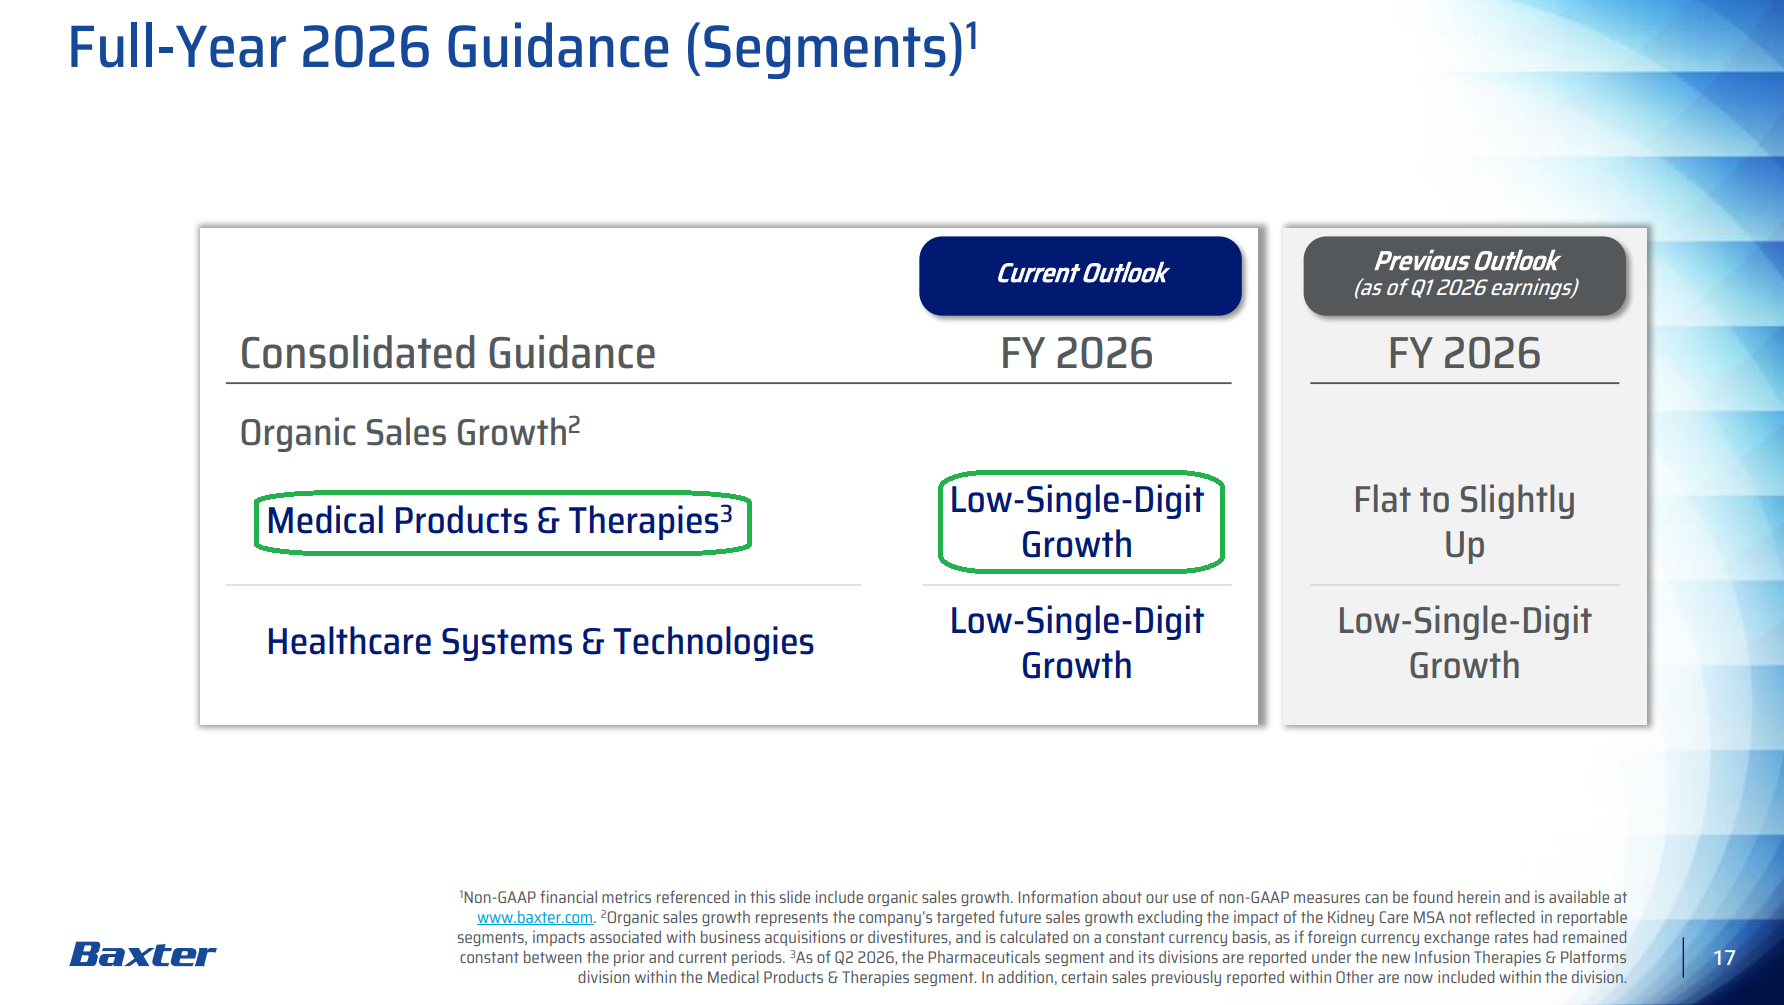
10) Management raised the full-year outlook across the board, with reported sales growth now expected at 3% to 4% (from flat to 1%), organic sales growth at 2% to 3% (from ~flat), and adjusted EPS at $1.95 to $2.15 (from $1.85 to $2.05), putting the new midpoint at $2.05 against consensus of $1.91. By segment, MPT moves to low-single-digit organic growth (from flat to slightly up) on stronger year-to-date performance, including Drug Compounding, with HST held at low-single-digit growth supported by both Care & Connectivity Solutions and Front Line Care.
Earnings Call Highlights
Morningstar Analyst Note
General Market
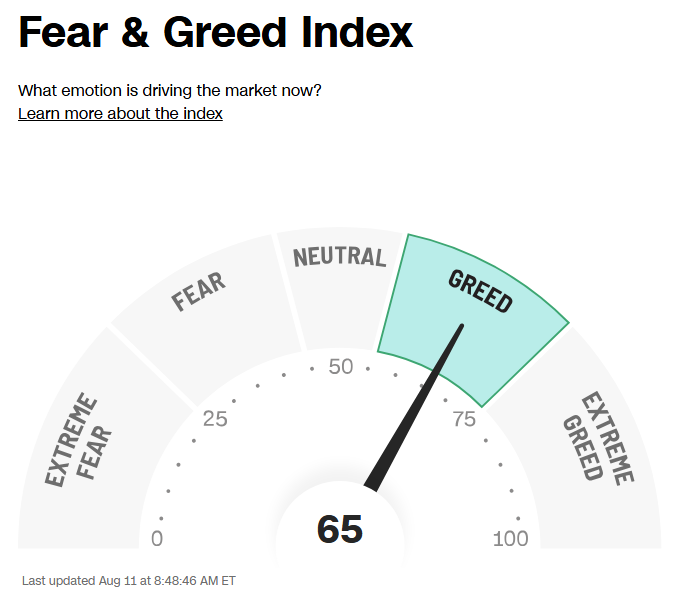
The CNN “Fear and Greed Index” ticked up to 65 this week from 59 last week. You can learn how this indicator is calculated and how it works here: (Video Explanation)
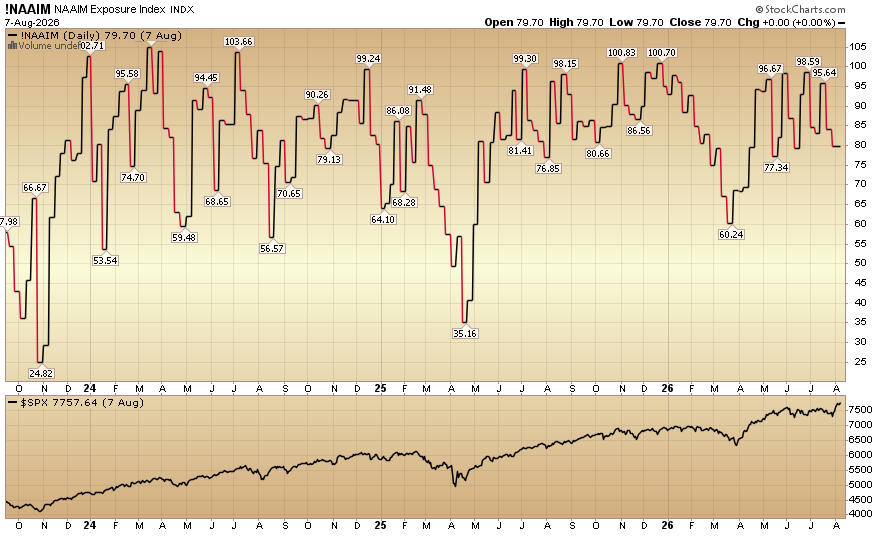
The NAAIM (National Association of Active Investment Managers Index) (Video Explanation) ticked down to 79.70% equity exposure this week from 84.02% last week.
Our podcast|videocast will be out sometime today. We have a lot of great data to cover this week. Each week, we have a segment called “Ask Me Anything (AMA)” where we answer questions sent in by our audience. If you have a question for this week’s episode, please send it in at the contact form here.
Comments
Log in or sign up to join the conversation.