

US Stocks Face Their First Real Test in Weeks
The S&P 500 endured its sharpest decline in over a week, erasing several sessions of steady gains in a single move and placing the benchmark on course for its first weekly loss in ten weeks. While one down day is hardly enough to declare the end of the bull run, it serves as a timely reminder that markets rarely move higher in a straight line. After an extended rally that has pushed US equities to fresh record highs, investors are now confronting a more difficult question: is this simply another buy-the-dip opportunity, or the early stages of a broader consolidation phase? For now, the evidence still favours the former, but some warning signs are beginning to emerge beneath the surface.
Risk Appetite Tested by Crypto Turbulence and Energy Costs
A notable source of concern has been the sharp deterioration across cryptocurrency markets. Bitcoin (BTC.X)’s latest sell-off has triggered heavy losses throughout the digital asset universe, prompting questions about whether speculative risk-taking is starting to fade. Have a look at the Bitcoin chart to see where the cryptocurrency is trading right now.
While crypto and equities remain distinct markets, the two have become increasingly intertwined in recent years. Significant losses in one asset class often force investors to reduce exposure elsewhere, either to manage risk or meet margin requirements.
Few companies highlight this relationship more clearly than MicroStrategy (MSTR). The firm, whose prior fortunes were tied to Bitcoin’s past upsurge, has suffered a dramatic reversal as cryptocurrency prices have tumbled. With shares now down roughly 77% from their peak, further downside cannot be ruled out should pressure across digital assets persist.
At the same time, energy markets are adding another layer of uncertainty. Crude oil has climbed back above $95 per barrel this week, reviving concerns that inflationary pressures may prove more persistent than policymakers had hoped. Higher fuel and transportation costs ultimately feed through to both businesses and consumers, potentially slowing economic activity while keeping price pressures elevated.
Bond markets have responded accordingly. Treasury yields edged higher as investors reassessed the inflation outlook and the likely path of Federal Reserve policy, before easing somewhat this morning as oil prices cooled. Rising yields tend to be particularly problematic for growth stocks because they reduce the value of future earnings streams. Given the technology-heavy composition of the S&P 500 chart, this remains a key headwind for the broader index.
Labour Market Data Takes Centre Stage
Attention now turns to Friday’s Non-Farm Payrolls report, arguably the week’s most important economic release.
Employment indicators published so far have painted a picture of a labour market that remains remarkably resilient. That resilience has been one of the key reasons why the US economy has continued to outperform many of its developed-market peers despite elevated interest rates and ongoing geopolitical uncertainty.
The challenge for investors is that interpreting the payrolls data may not be straightforward. Consensus expectations currently sit at around 85,000 new jobs.
A softer-than-expected reading could raise fresh concerns about slowing growth, particularly if inflation remains sticky due to higher energy prices. Such a scenario would leave the Federal Reserve facing an uncomfortable balancing act between supporting economic activity and maintaining its inflation-fighting credibility.
On the other hand, a moderately strong payrolls figure may reinforce the market’s preferred “Goldilocks” scenario: an economy that remains healthy enough to support corporate earnings, but not so strong that it reignites inflationary pressures and delays future rate cuts.
Technical Picture Remains Constructive Despite Pullback
Yesterday’s drop may mark the start of something more significant, but so the key support levels have remained intact to suggest the bullish trend is not over yet.
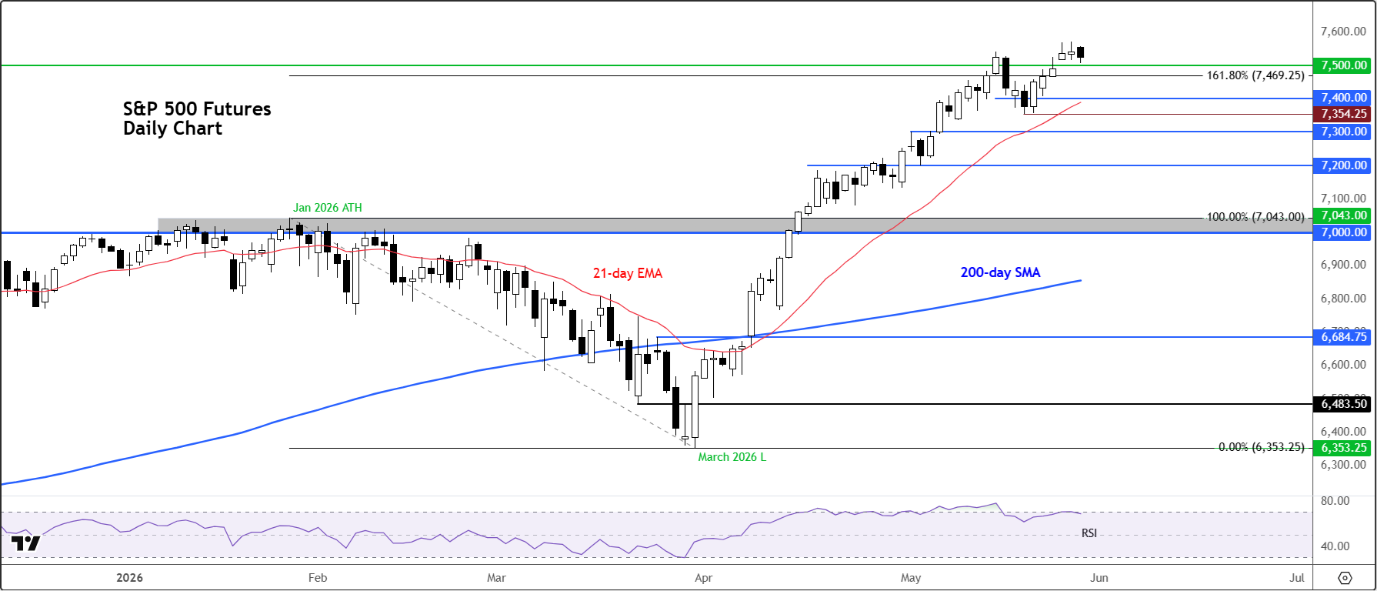
S&P 500 futures were testing support around 7,540 at the time of writing, an area that coincides with the previous breakout zone from mid-May. Having acted as resistance before the latest push higher, this level is now being examined as potential support.
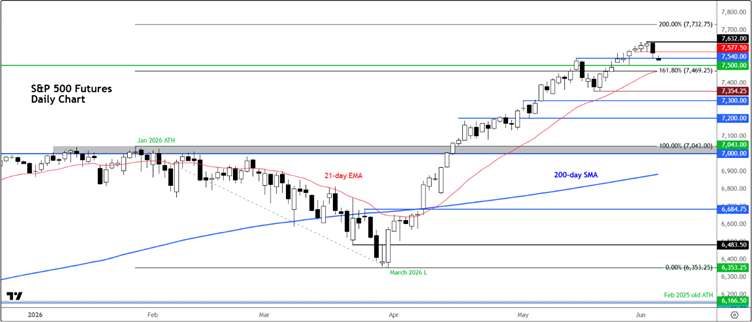
Beneath that sits the psychologically significant 7,500 mark, which represents the next key battleground between buyers and sellers. Additional support is located around the 21-day exponential moving average near 7,470, followed by the 7,400 region.
The most important level remains the recent swing low at 7,354. As long as the index remains above this threshold, the broader uptrend remains intact. A decisive break below would establish the first meaningful lower low in several months and could trigger a more substantial corrective phase.
Momentum indicators suggest some cooling was overdue. The weekly Relative Strength Index (RSI) had already moved comfortably into overbought territory above 70, while the monthly RSI remains elevated. Following the latest pullback, the daily RSI has started to ease lower, helping to relieve some of the stretched conditions that had built up during the rally. Such rebalancing can occur through either price declines or a period of sideways consolidation.
On the upside, initial resistance is located around 7,568 and 7,577, both of which have become important near-term levels. Beyond that, attention turns to the 7,600 area before focus shifts back towards the record high at 7,632.
For now, the primary trend remains firmly positive. The coming sessions will reveal whether investors once again view weakness as a buying opportunity, as they have repeatedly done throughout this advance, or whether rising bond yields, elevated oil prices and ongoing stress in cryptocurrency markets mark the beginning of a more prolonged period of consolidation.
Comments
Log in or sign up to join the conversation.