


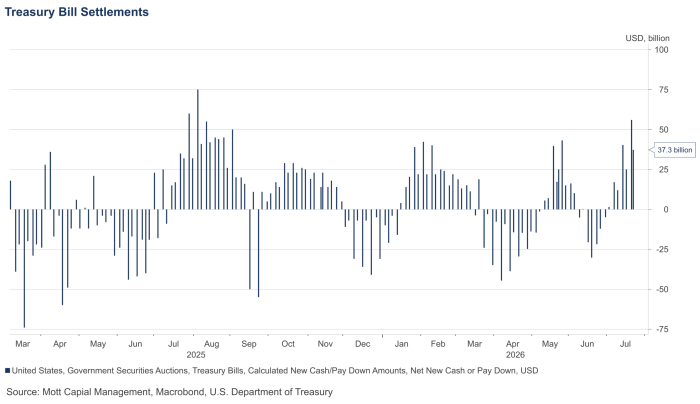
The day started off strong for the S&P 500, but it didn’t end that way ahead of a sizeable liquidity drain that will commence on Tuesday. Treasury bill settlements are expected to result in net new issuance of $56 billion, followed by an additional $37 billion on Thursday and a smaller coupon settlement of $13 billion on Friday. Treasury bill issuance will likely remain heavy until Labor Day, creating a headwind for risk assets as we move through the summer.
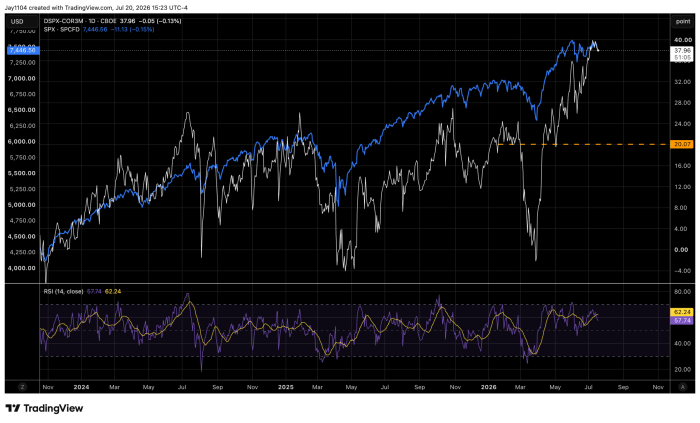
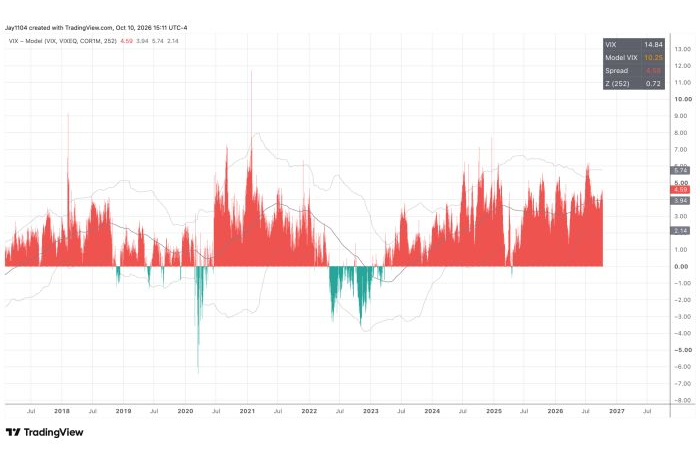
This is where things could get interesting, especially given how dispersed the market has been and how low implied correlations remain. If liquidity begins to be drained from the market and index-level volatility rises as stocks decline, one would expect implied correlations to increase and dispersion to begin unwinding. In other words, stocks should start trading more in unison rather than independently. As that happens, the spread between dispersion and implied correlations should begin to narrow.
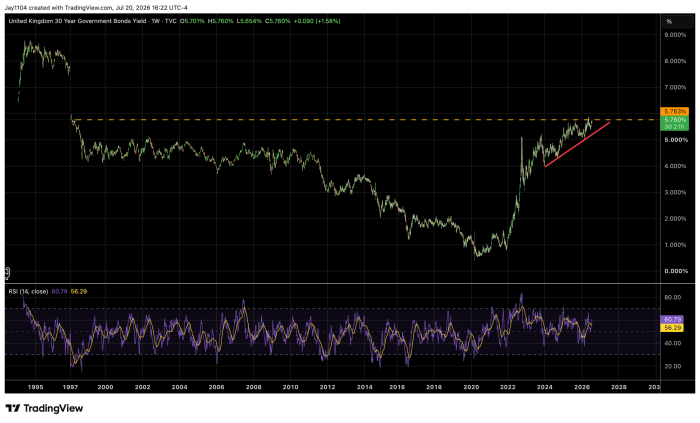
Rates rose sharply today, with the UK leading the move. The new prime minister appears to be preparing to adjust the country’s fiscal position, pushing the 30-year gilt yield up by 9 basis points. It sounds a lot like what we have been watching unfold in Japan, where concerns over fiscal policy have also put upward pressure on long-term government bond yields and weakened the currency.
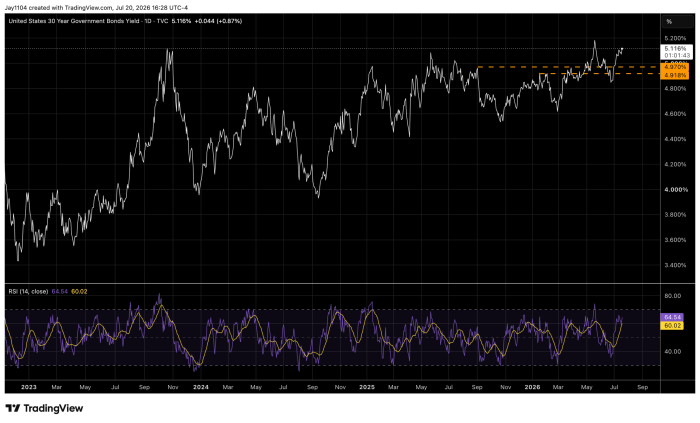
Here in the U.S., the 30-year Treasury yield closed at 5.12%. Our own long-end rates also appear poised to move higher. If long-term yields continue to rise globally, as they have in the UK and Japan, it will be difficult for U.S. long-end yields not to move higher as well.
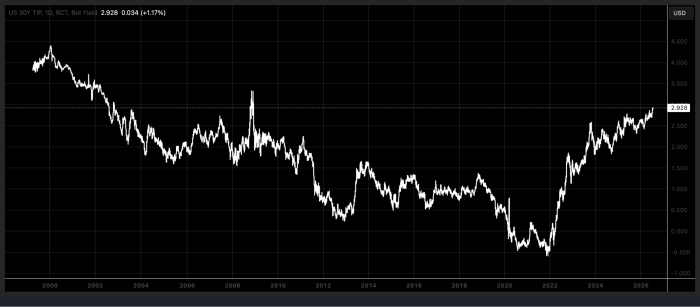
The 30-year TIPS real yield closed at 2.93%, marking a new cycle high.
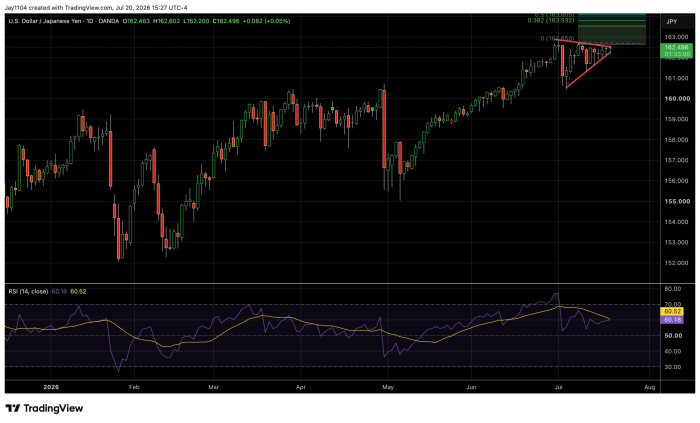
The USD/JPY appears poised to make a significant move. The pattern resembles a continuation symmetrical triangle, suggesting the pair could break higher.
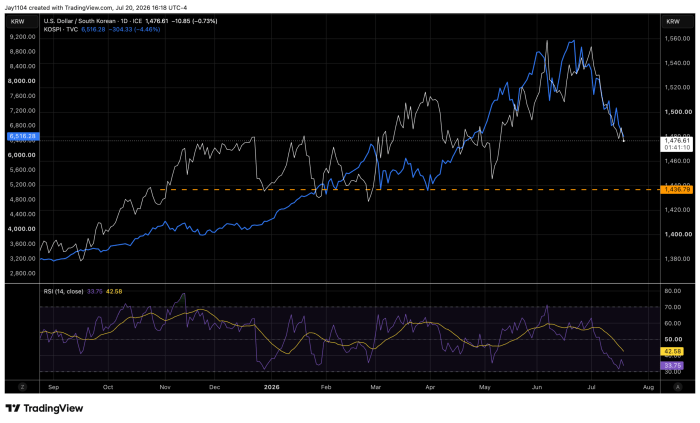
Meanwhile, USD/KRW strengthened, with the pair falling by nearly 80 basis points on the day. It will be interesting to see how South Korean semiconductor stocks respond, given the pressure the market has come under in recent days. For the most part, the won and the Kospi have traded in unison.
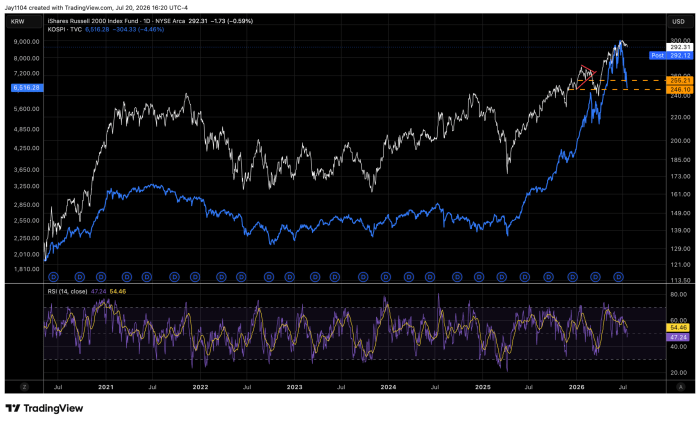
Small caps in the U.S. also tend to trade in line with the Kospi over time. I’ve never quite figured out why, but long-time readers of this commentary know this well, as we’ve seen it happen time and time again. If that relationship continues to hold, the IWM ETF could have a long way to fall.


Comments
Log in or sign up to join the conversation.