

It was a quiet week. The Fed minutes read more hawkish than the market expected, though they softened some of what Williams and Jefferson had said the week before, and Waller pushed back against colleagues offering forward guidance. The more interesting story sits in the volatility market as earnings season begins.
The VIX is around 14.5 to 15, and it has little room to fall. A simple model explains why. Take the square root of the one-month implied correlation index and multiply it by the VIXEQ, the single-stock volatility index. With implied correlation at 6.93 and the VIXEQ near 39, the model puts the VIX at about 10.25. The actual VIX has traded 3 to 4 points above the model for most of the past few years, and it’s roughly where it sits now.
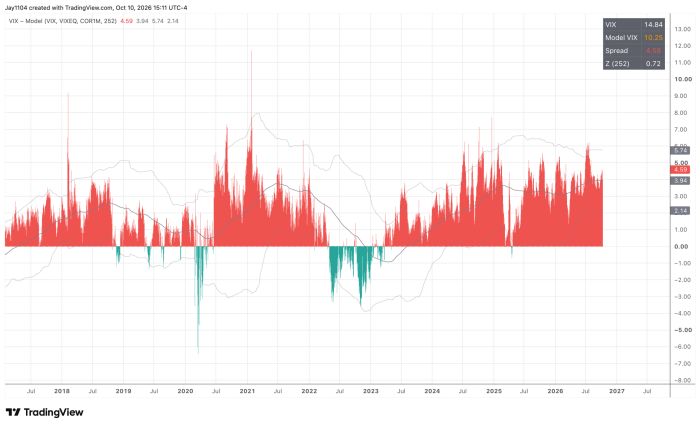
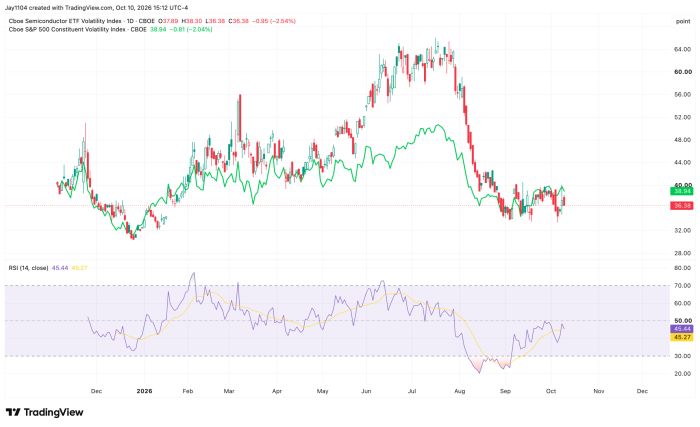
The usual earnings-season pattern is the dispersion trade, where single-stock volatility rises while index volatility is pushed down. That spread is already wide. Even if the VIXEQ climbs back to 45 and implied correlation falls to 4, near the bottom of its range since the low-correlation regime began in 2023, the model VIX would be about 9, which implies an actual VIX near 12 to 13. The whole trade is probably worth one to three VIX points from here. The feverish semiconductor volatility that drove the July version of this trade is gone, so the setup is weaker than it was over the summer.
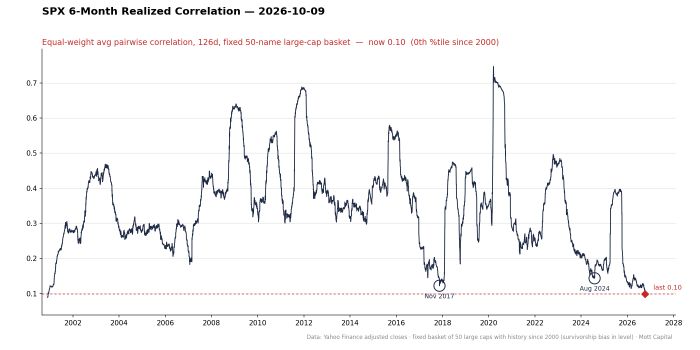
The realized side says the same thing from the other direction. Six-month realized correlation sits at 0.01, the lowest reading since 2001, and the three-month measure is in the third percentile. Stocks have rarely moved this independently of the index. Readings this low have tended to precede periods where correlations rise, and index volatility rises with them. Among the 142 S&P 500 names I track, 43% have realized volatility near one-year lows and only 7% near highs, while 27% have implied volatility near highs. The market is pricing more single-stock movement ahead than it is seeing today.
For the index, this means there isn’t enough volatility to fuel a sharp move in either direction. The S&P 500 looks likely to keep grinding between resistance around 7,500 to 7,875, with the call wall near 7,900, and support down toward 7,500, at least until the largest companies report. Sector rotation underneath, visible in the equal-weight index’s weakness, keeps the cap-weighted index from breaking out or breaking down. A sharp selloff before the end of October would lift correlations and implied volatility, setting up a stronger rally later. Without it, the path looks slow and range-bound.
-Mike



Comments
Log in or sign up to join the conversation.