

Or, is the recent up/down movement of the 10-year Treasury bond, 34 basis points in a couple of days, within the range of normalcy, and nothing to worry about? Either way, yields remain at 24-year highs.
The Issue
As an avid bond market watcher, I have always considered the players there the ‘smart money,’ so whether what seem to be significant up/down swings have any economic significance remains an important question with an as-yet-unknown answer.
Not to mention the fact that the 10-year Treasury bond yield last week hit 24-year highs, with the economy flashing signs of a slowdown and some inflation data signaling that perhaps the worst is over.
Add to the mix that mortgage rates move with the 10-year Treasury (subject to the mortgage spread), and the overall health of the all-important real estate market becomes a question, too.
What 34 basis points of intraday movement tells us
The 10-year’s net change last week wasn’t large. It closed Friday around 5.28%, up about 10 basis points on the week. But the path it took was wild. It peaked near 5.34% on Thursday, fell to roughly 5.17% after Friday’s jobs report, and bounced back by the close. Add up every leg and you get roughly 34 basis points of up-and-down movement in a couple of days.
That’s the number I care about, because it shows how hard the market is working to figure out what the data means.
The data releases are the story
CME Group studied 10-year Treasury moves in the first half of 2024. On ordinary days the average trading range was about 8 basis points. On jobs report days it was about 14, on CPI days about 15.65, and on Fed announcement days about 11. Those are high-to-low ranges from a different year, so they’re a benchmark and not a rule, but they show the pattern: data days roughly double the normal range.
Last week had several of those moments:
Wednesday: Core PCE came in at 3.0% against 3.3% expected, good news on inflation. Yields rose anyway. One analyst blamed methodology changes in the data for leaving markets “in a greater state of uncertainty than before the release.” The Fed’s Neel Kashkari added that inflation “is still too high.”
Thursday: The 10-year hit about 5.34%, the highest since 2002, with the 30-year near 5.67%.
Friday: Payrolls rose just 29,000 against about 84,000 expected, and unemployment ticked up to 4.2%. Yields dropped to about 5.18% at first, then reversed and finished higher.
What’s unusual isn’t the size of the swings, it’s how the market reacted
Cool inflation data should lower yields. Weak jobs data should lower yields. Instead, yields rose after the first and reversed after the second. When both good news and bad news fail to push yields down, the market is probably focused on something other than the data itself, most likely the term premium, meaning the extra yield investors demand for holding long-term debt, and the supply of Treasuries.
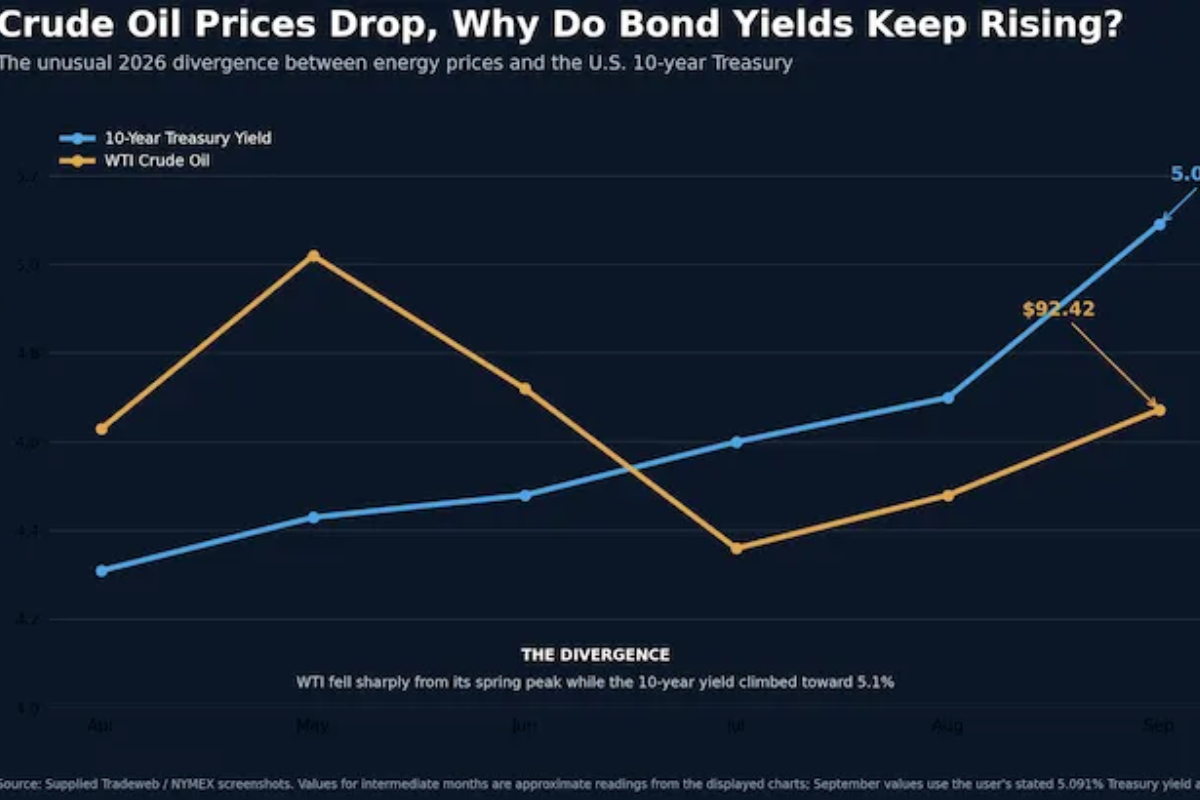
The surrounding evidence points the same way. A 7-year auction drew its weakest bid-to-cover in a year. The 10-year real yield rose from 2.43% to 2.93% in September. Crude is still elevated at about $90 after reaching $114.58 in April. And one weekly summary I read put it this way: the long end is pricing “inflation persistence and supply, not the Fed path.”
The Fed raised rates on September 16 to 3.75%–4.00% in a unanimous vote, its first hike in three years, and projects 4.1% by year-end. Markets now put the odds of an October move below 25%, with a December hike seen as likely. So every release is also a vote on the Fed’s next step, which is part of why each one hits so hard.
Canary in the coal mine, or not?
I’ve always considered bond traders the smart money. But “smart” doesn’t mean the message is clear. The market could be telling us a slowdown is coming, inflation is staying, or the Treasury’s borrowing is outrunning demand. Those lead to different places.
My opinion: the swings by themselves are probably the sound of a nervous market digesting data it can’t read. Last week’s volatility doesn’t resemble 2023’s rout, which a Fed note called “highly unusual” relative to history since 1990 and which built over about two and a half months. The MOVE index, a measure of bond volatility, hit 104.58 on September 25, the highest in its three-month window, while the VIX was near 15.7. The canary, if there is one, is the gap between those two, and the level of yields.
What this means for real estate
Mortgage rates follow the 10-year, subject to the mortgage spread. Freddie Mac’s latest survey put the 30-year at 7.28%, the highest since November 2023, and Realtor.com estimated that added more than $200 a month to the payment on a median-priced home. If intraday swings keep following each data release, lenders have to reprice constantly, and buyers struggle to lock a rate with confidence.
What to watch
The calendar is crowded, and each item is a potential volatility event:
October 6, 7 and 8: Treasury auctions of 3-year notes, then 10-year and 30-year reopenings, per the Treasury’s tentative schedule. Watch the bid-to-cover and tails.
This week: Fed minutes from the September meeting.
October 14: September CPI. Given the PCE confusion, this one matters.
October 15: Retail sales and PPI.
October 28: The Fed decision, at 2:00 p.m.
October 29: Q3 GDP and PCE.
The test of the thesis: On each of these days, do yields move the way the data says they should? If cool data keeps failing to bring yields down, that supports the supply-and-term-premium story.
The levels: About 5.34% on the upside and 5.17% on the downside.
Oil, and global yields.
What if everyone is wrong?
Suppose all this intraday volatility is a stress-release valve, and the data eventually wins: the economic slowdown deepens, the Fed stops tightening, and yields drift down from 24-year highs. Suppose instead the data keeps being drowned out by supply, and the swings are the market struggling to absorb more debt at any price. I don’t know which. But I’d watch how yields behave on data days over the next month, because that will tell us more than the level on any one of them.


Comments
Log in or sign up to join the conversation.