


Corporate turnaround and sum-of-the-parts thesis
Thesis
Thryv Holdings, Inc. (THRY) is not a normal AI stock, and it is not only a dying Yellow Pages business either. The better way to understand the company is as a leveraged corporate separation in which a profitable but rapidly shrinking Marketing Services operation is funding the build-out of a much larger SMB software platform.The market still appears to value the whole company through the declining legacy business, even though SaaS represented 70% of first-quarter 2026 revenue.
The opportunity exists because the transition looks ugly in consolidated accounts. Marketing Services revenue is being intentionally reduced, migrated or allowed to run off. SaaS revenue is now the clear majority of the business, but 2026 guidance implies only low-single-digit reported growth, while SaaS margin is temporarily pressured by Keap integration, product migration and the movement of lower-margin digital-marketing customers into the software segment. The result is falling total revenue, compressed free cash flow and a stock that does not screen as either a clean value stock or a clean SaaS growth stock.
At a reference price of approximately $4.16, Thryv had an equity value of roughly $188 million. The company nevertheless guides to approximately $467 million of 2026 SaaS revenue and $72.5 million of SaaS Adjusted EBITDA at the midpoint, plus approximately $160 million of Marketing Services revenue and $32.5 million of legacy Adjusted EBITDA. The central valuation question is therefore not whether consolidated revenue is currently shrinking. It is whether the SaaS operation can stabilize retention and return to growth before legacy cash flow disappears, while management uses the bridge cash flow to reduce debt rather than pursue another acquisition.
My base sum-of-the-parts valuation is approximately $8.90 per share, or about 114% upside from the reference price. A successful separation and margin-recovery case points to approximately $17.50 per share. The downside is also severe: if SaaS remains a low-growth product with sub-90% retention while Marketing Services cash flow falls faster than debt, the equity can be worth very little. This is therefore an asymmetric but leveraged turnaround, not a safe compounder.
The AI angle is useful, but it should not be the foundation of the thesis. Thryv does not own a frontier model, and its current valuation should not receive an AI premium merely because management uses the term. The real AI opportunity is practical: lead scoring, attribution, automated follow-up, reputation management, CRM workflows, content generation and payments can make the product more valuable to an owner-operated business that does not have an internal marketing team. AI becomes financially relevant only if it raises ARPU, improves retention, reduces service cost or increases multi-product adoption.
Company Background: From Directories to SMB Software
Thryv was built from the former Yellow Pages and Dex Media ecosystem. Its legacy Marketing Services operation includes printed directories and digital assets such as Yellowpages.com, Superpages.com and Dexknows.com, together with search, display, social and SEO services. In 2024, the board decided to terminate Marketing Services solutions by the end of 2028.The final print publications are expected in 2028, while billing collections can continue through 2030.
The replacement business is a SaaS platform for small and medium-sized businesses. Thryv initially built Business Center and related workflow tools, then expanded toward marketing, CRM, payments and automation. The most important strategic step was the October 2024 acquisition of Keap, a CRM and marketing-automation business. Thryv paid approximately $77 million net of cash acquired, financing the transaction primarily through a 5.7 million-share equity offering that generated $76.8 million of net proceeds, plus a small ABL draw. The acquisition gave Thryv a more mature automation engine and a higher-spending customer base, but it also diluted shareholders and created an integration year just as the legacy business was declining.
The history matters because the current stock-market identity is confused. A traditional directories investor sees a shrinking runoff with leverage. A SaaS investor sees only 93% retention, falling customer counts and near-flat 2026 revenue guidance. An AI investor sees a small company with limited disclosure about actual feature adoption. The investment case rests on the gap between those weak current optics and the value that could emerge after the company becomes a simpler, better-disclosed and less-levered software business.
What Thryv Is Actually Becoming
The most useful product framework is “Market, Sell and Grow.” Marketing Center helps an SMB become visible, generate leads and understand attribution. Keap is the CRM and automation engine that manages prospects, campaigns and follow-up. Business Center, payments, websites, listings, reputation tools, professional services and other extensions help the customer operate and monetize the relationship. The strategic logic is that a business owner should not need separate point solutions for advertising, lead management, scheduling, communication, CRM and payments.
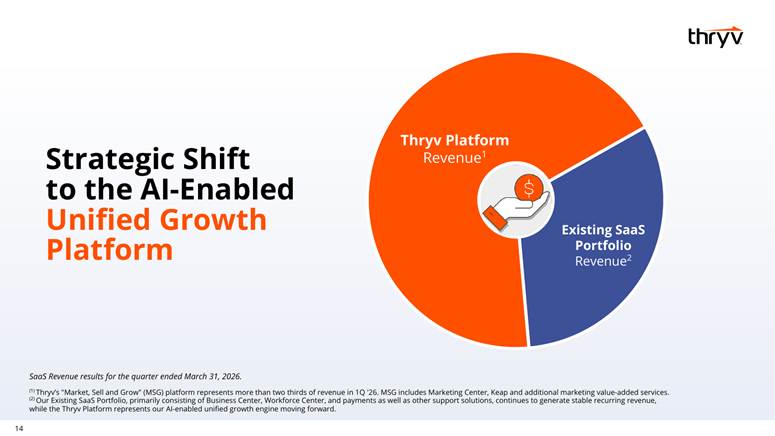
Figure 1. Thryv is shifting the revenue base toward an AI-enabled unified growth platform. Source: Q1 2026 investor presentation
This integrated workflow is the source of the possible AI edge. A generic chatbot is easy to copy, but an application that knows where the lead originated, what the customer previously bought, whether the owner replied, what appointment was scheduled and whether payment was received can become more useful over time. Thryv can apply AI to lead prioritization, automated replies, content, reviews, campaign recommendations and revenue attribution inside the workflow. The practical moat, if one develops, will come from embedded customer data, product integration and switching friction rather than from owning the underlying AI model.
The company describes its current software as including AI-driven lead insights and attribution, automated customer follow-up, an AI-enabled CRM and payment processing.The 2025 10-K describes Marketing Center as using AI-driven analytics and lead attribution, while Keap uses automation tools and AI to automate repetitive tasks, campaigns and processes. This is credible product functionality, but investors should demand disclosure of paid AI adoption, attach rates, retention and gross-margin impact before assigning a separate AI valuation premium.
The Upmarket Shift Is More Important Than Raw Customer Count
Thryv is deliberately moving away from very small, low-spending or low-retention customers toward larger SMBs that can buy several products. That strategy can reduce the headline customer count while improving revenue quality. In Q1 2026, monthly SaaS ARPU increased 12.8% year over year to $378, Marketing Center revenue increased 29%, and customers spending more than $400 per month represented 70% of SaaS revenue. These are the strongest operating facts in the thesis because they indicate that the product can win higher-value customers even while the total base is being cleaned up.
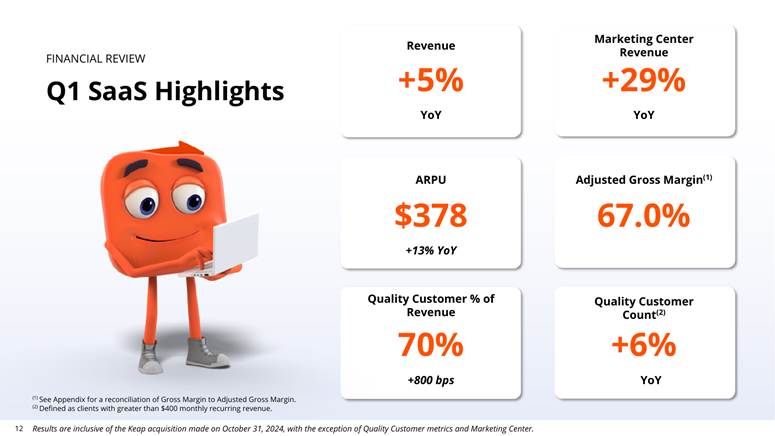
Figure 2. Q1 2026 SaaS metrics show higher ARPU and increasing concentration in quality customers. Source: Q1 2026 investor presentation
The counterpoint is equally important. SaaS clients fell to 96,000 from 111,000 a year earlier and seasoned net revenue retention was only 93%. A software company with sub-100% retention must replace lost revenue before it can grow, and a 93% retention rate does not justify a premium multiple. The investment case therefore depends on the quality-customer cohort continuing to grow and eventually pulling retention closer to 100%, not merely on price increases masking customer losses.
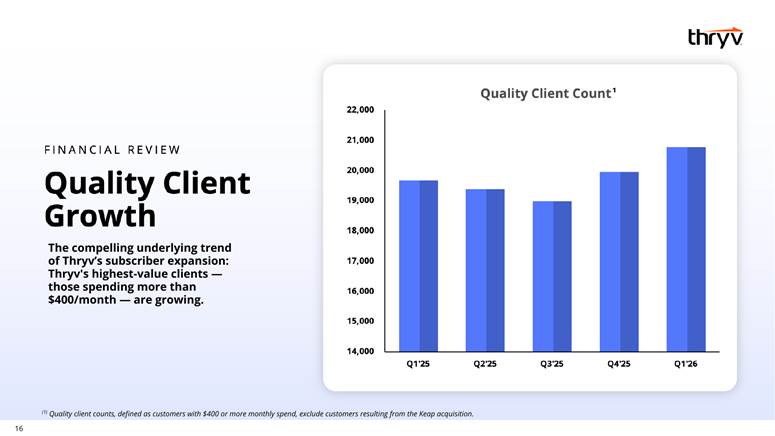
Figure 3. The number of customers spending more than $400 per month has begun to improve. Source: Q1 2026 investor presentation
Marketing Services: A Melting Ice Cube, but Also the Funding Bridge
Marketing Services should not be given a normal terminal multiple. It is a managed runoff that still produces meaningful cash and customer relationships. In 2025, the segment generated approximately $324.0 million of revenue and $78.0 million of Adjusted EBITDA, a 24.1% margin. For 2026, management guides to only $157-$163 million of revenue and $30-$35 million of Adjusted EBITDA. The decline is steep, but the segment remains profitable because printing, sales and overhead costs are being reduced alongside revenue.
The legacy operation serves three purposes. First, it produces cash that can fund debt amortization and SaaS development. Second, it remains a low-cost source of potential SaaS customers. Third, it creates the reported decline that obscures the software business. The correct shareholder strategy is therefore not necessarily to sell the whole segment at any price. It is to harvest the cash, test whether identifiable assets have strategic value, convert the best customers and prevent the runoff from consuming new capital.
During the twelve months ended March 2026, Thryv converted approximately 8,000 Marketing Services customers who were not already SaaS clients; approximately 6,000 remained as SaaS clients at quarter-end. It also converted products for approximately 10,000 customers who already used SaaS. These actions shifted approximately $6.1 million of Q1 revenue from Marketing Services into SaaS. That is economically useful if the customers remain and buy more products, but it also means reported SaaS growth includes internal migration. Investors need a clean bridge between acquired revenue, migrated revenue, price, new-logo revenue, expansion and churn.
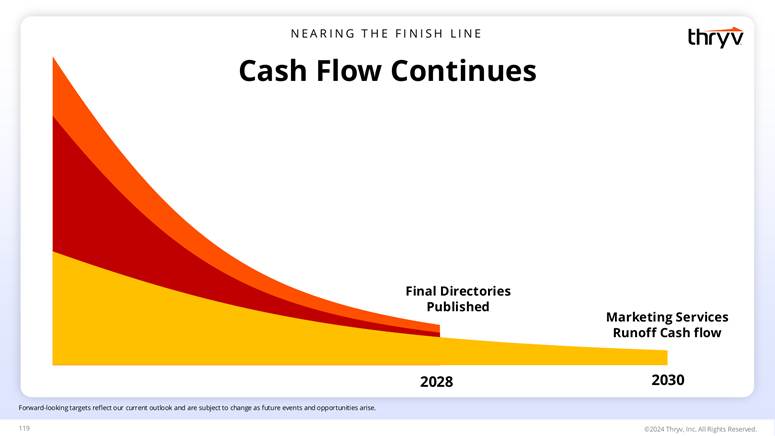
Figure 4. Management expects the final directories in 2028 and runoff collections through 2030. Source: 2024 Analyst Day presentation
Key inference Marketing Services is not worth zero today, but it should be valued as a declining stream of after-tax cash rather than as a perpetual business. My base valuation assigns only about $45 million to the runoff, despite the segment’s $32.5 million 2026 EBITDA midpoint. This is intentionally conservative because working capital, restructuring costs and revenue timing can absorb a meaningful part of reported EBITDA. |
Financials: 2026 Is the Difficult Bridge Year
The historical segment data shows a clear transfer of economic weight from legacy media to software. SaaS revenue rose from $263.7 million in 2023 to $461.0 million in 2025, while Marketing Services revenue fell from $653.2 million to $324.0 million. SaaS Adjusted EBITDA increased from $12.0 million to $73.8 million, but total company EBITDA still declined because the legacy profit pool contracted faster. The 2026 midpoint implies that SaaS revenue is almost flat and SaaS EBITDA is also roughly flat, while legacy EBITDA falls by more than half. This is why the stock is under pressure despite the higher SaaS mix.
$ in millions, except margins | 2023A | 2024A | 2025A | 2026E midpoint |
SaaS revenue | $263.7m | $343.5m | $461.0m | $467.0m |
Marketing Services revenue | $653.2m | $480.7m | $324.0m | $160.0m |
Total revenue | $917.0m | $824.2m | $785.0m | $627.0m |
SaaS Adjusted EBITDA | $12.0m | $41.2m | $73.8m | $72.5m |
Marketing Services Adjusted EBITDA | $175.5m | $121.2m | $78.0m | $32.5m |
Total Adjusted EBITDA | $187.5m | $162.4m | $151.8m | $105.0m |
SaaS EBITDA margin | 4.6% | 12.0% | 16.0% | 15.5% |
Free cash flow | $114.8m | $56.2m | $31.1m | Not guided |
Source: 2025 Form 10-K and Q1 2026 guidance. Free cash flow is operating cash flow less additions to fixed assets and capitalized software. 2026E uses guidance midpoints.
The deterioration in free cash flow also deserves attention. Free cash flow fell from approximately $114.8 million in 2023 to $31.1 million in 2025. Q1 2026 operating cash flow was only $1.5 million and capitalized software/fixed-asset additions were $6.9 million. Part of the first-quarter result reflects working-capital timing, but the low cash balance means management has little room for another operational miss or an unnecessary acquisition.
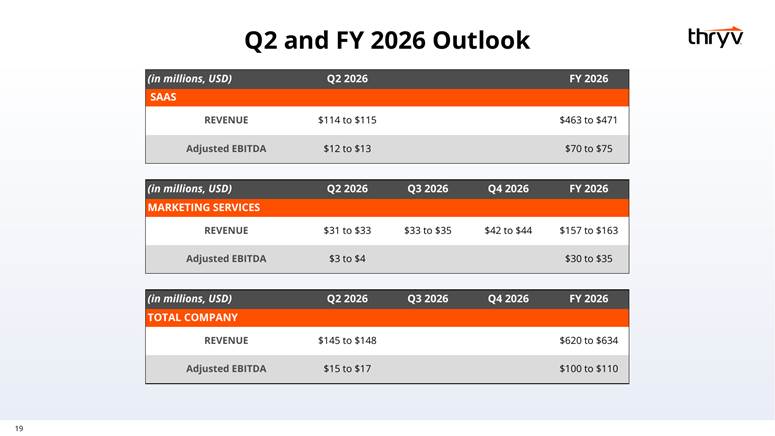
Figure 5. Full-year 2026 guidance shows the near-flat SaaS bridge and the rapid legacy decline. Source: Q1 2026 investor presentation
The “Pinch Point” Explains the Mispricing - but Does Not Excuse It
Management described 2025 as a pinch point because the company was configuring the Marketing Services exit, decommissioning systems and digesting Keap. That framing remains useful in 2026. SaaS adjusted gross margin fell to 67.0% in Q1 from 70.9% a year earlier, largely because lower-margin digital-agency services were moved into the SaaS segment and because the company is carrying integration and platform costs ahead of the revenue benefit. If the platform is truly becoming simpler, gross margin and EBITDA margin should improve after the migrations and system removals are completed.
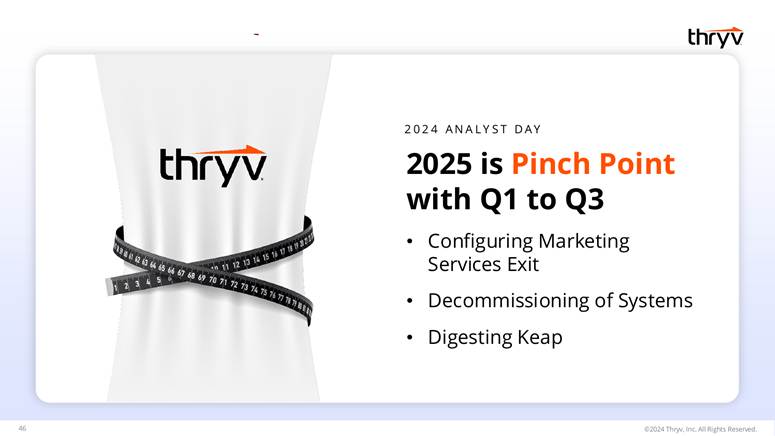
Figure 6. Management originally identified the integration and exit work as a temporary pinch point. Source: 2024 Analyst Day presentation
The problem is that a “temporary” transition can become permanent. Management’s 2024 medium-term framework contemplated approximately 18%-20% organic SaaS growth, roughly 74% adjusted gross margin and a mid-teens SaaS EBITDA margin, with longer-term targets near 20% growth, 80% gross margin and a 20% EBITDA margin. Current 2026 guidance is far below the original growth aspiration. I therefore treat the old framework as an upside map, not as a forecast. The stock should rerate only when reported results prove that growth and retention can improve after the migration effects normalize.
Balance Sheet: The Main Source of Both Risk and Equity Upside
At March 31, 2026, Thryv had approximately $258.6 million of recorded debt, only $8.0 million of cash and a $44.0 million pension obligation.Net debt plus the pension obligation was therefore approximately $294.6 million, substantially larger than the equity value. The term loan matures in May 2029, bears interest at SOFR plus 6.75% for SOFR borrowings and requires mandatory amortization. Forty percent of the term loan is held by a related party that owns more than 5% of the equity, although the 10-Q does not name the lender in that disclosure.
This capital structure creates convexity. Every dollar of enterprise-value improvement after debt is covered accrues to a relatively small equity base. The same mechanism works in reverse if SaaS disappoints. A $100 million change in enterprise value is approximately $2.17 per diluted share, which is more than half the current stock price. The investment is therefore much more sensitive to execution and debt reduction than a simple revenue multiple suggests.
Capital structure snapshot | Value |
Reference share price | $4.16 |
Equity market value | $188.2m |
Recorded debt | $258.6m |
Less: cash | ($8.0m) |
Net debt | $250.6m |
Pension obligation | $44.0m |
Adjusted enterprise value | $482.8m |
2026 Adjusted EBITDA midpoint | $105.0m |
Adjusted EV / 2026 EBITDA | 4.6x |
Source: Q1 2026 results and balance sheet; reference market price from the company stock-quote page. Adjusted enterprise value includes the pension obligation. Figures are rounded.
The board has authorized $40 million of share repurchases through April 2029, of which only $5.5 million had been used by March 2026, leaving $34.5 million. At $4.16 per share, the remaining authorization could theoretically retire about 8.3 million shares, or roughly 18% of the diluted share count. However, ABL conditions currently limit the company’s ability to repurchase shares, and debt reduction should come first. The buyback is valuable optionality after leverage falls, not an immediate catalyst.
Why the Stock Is Mispriced
The first source of mispricing is identity. Most screens show a company with falling consolidated revenue, a declining customer base and a legacy brand. They do not show that 70% of Q1 revenue came from a profitable SaaS segment, or that the current equity value is only a fraction of annual SaaS revenue. The market is waiting for a clean pure-play before applying a software multiple.
The second source is the transition accounting. Acquired Keap revenue, internally migrated Marketing Services revenue, price increases, native new-logo sales, expansion and churn are all mixed inside the reported SaaS number. In 2025, the $117.6 million increase in SaaS revenue included $56.2 million from Keap, $20.4 million from Marketing Services conversions and $48.0 million from new sales and expansion, offset by $7.0 million of other changes. This means the headline 34% growth rate overstated organic platform momentum. The market is right to demand a cleaner bridge.
The third source is the 2026 earnings valley. At the midpoint, consolidated revenue falls roughly 20% and EBITDA falls roughly 31%, even though the SaaS mix rises. Investors typically avoid a stock until the final earnings reset is visible. If 2026 is the trough and consolidated revenue returns to growth in 2027, the multiple and the earnings base can improve at the same time.
The fourth source is leverage and low liquidity. A business with only $8 million of cash, high-cost term debt and a shrinking ABL borrowing base cannot be valued like an unlevered SaaS company. The legacy assets supporting the ABL are themselves expected to disappear by 2028. The board must therefore treat debt reduction as the principal strategic objective.
The fifth source is management credibility. The Keap acquisition may ultimately be strategically correct, but it required an equity raise and created additional complexity. Management continues to describe selective acquisitions as part of capital allocation. At the current share price and leverage, another acquisition would weaken the thesis. Shareholders need a formal commitment that no material M&A will occur until the transition is complete and leverage is safely below 1.0x.
Valuation: Separate the Software from the Runoff
A consolidated EBITDA multiple understates the possible value because it capitalizes the declining Marketing Services profit at the same rate as the software segment. A pure revenue multiple can overstate value because SaaS growth and retention are not yet strong enough. I therefore use a simple SOTP based on normalized SaaS EBITDA, a heavily discounted legacy runoff value and explicit balance-sheet obligations.
Scenario | Normalized SaaS EBITDA | SaaS multiple | SaaS EV | Legacy value | Net debt + pension | Equity / share | Upside / downside |
Bear | $55m | 5.0x | $275m | $0m | ($310m) | $0.00-$0.50 | (88%)-(100%) |
Conservative | $70m | 7.5x | $525m | $30m | ($295m) | $5.65 | 36% |
Base | $75m | 8.5x | $638m | $45m | ($275m) | $8.86 | 113% |
Successful | $95m | 10.5x | $998m | $50m | ($240m) | $17.55 | 322% |
Strategic pure-play | $110m | 12.0x | $1,320m | $25m | ($200m) | $24.89 | 498% |
The base case uses only an 8.5x multiple on $75 million of normalized SaaS EBITDA, close to the current 2026 guidance midpoint. This gives the SaaS business an enterprise value of approximately $638 million, or only about 1.4x 2026 SaaS revenue. I add $45 million for the remaining Marketing Services cash stream and assume approximately $20 million of debt and pension reduction over the valuation period. On 46 million diluted shares, the result is approximately $8.86 per share.
The successful case assumes that SaaS EBITDA increases to $95 million as gross margin normalizes, Marketing Center continues to grow and retention moves toward 100%. A 10.5x multiple is not an aggressive AI multiple; it is a normal valuation for a profitable software business with credible growth. The strategic pure-play case assumes roughly $110 million of SaaS EBITDA, lower financial obligations and a cleaner sale or public-market valuation after the legacy exit. I do not use that case as the target because the company has not yet demonstrated the required growth or cash conversion.
The bear case is deliberately severe. If normalized SaaS EBITDA falls to $55 million, the market applies only 5x and the legacy business has no residual value, enterprise value barely covers debt and pension obligations. This is why the stock can produce a very high percentage return but cannot be treated as low-risk simply because the equity market value is small.
Base-case target My current base value is approximately $8.90 per share, compared with a reference price of $4.16. I would require a larger margin of safety before Q2 results because the stock’s value is highly sensitive to SaaS retention, gross margin and debt reduction. The target should move down quickly if SaaS remains flat into 2027 or if management resumes acquisition-led capital allocation. |
Value-Unlock Plan: What the Board Should Do
The current strategy is directionally correct but needs stricter capital allocation and better disclosure. A constructive activist or concentrated shareholder should support the SaaS transition while asking for the following actions:
• Publish a complete SaaS revenue bridge each quarter. Separate Keap acquisition contribution, internally migrated revenue, price, native new-logo revenue, expansion, churn and foreign exchange. Report NRR for quality customers and native platform customers, not only the seasoned blended metric.
• Freeze material acquisitions until net leverage, including the pension obligation, is below 1.0x. The company has already bought Keap and now needs to prove integration, organic growth and cash conversion. New M&A would transfer value from existing shareholders to sellers and lenders.
• Ring-fence Marketing Services as a runoff operation. Set annual cash-harvest targets, disclose restructuring cash costs and test strategic interest in digital properties, international legacy assets or operating partnerships. Do not extend the 2028 exit date merely to preserve revenue.
• Use at least 75% of discretionary free cash flow for debt repayment until net debt is below $150 million. The term loan is expensive and matures in 2029, so debt reduction produces a high, low-risk return and expands future strategic flexibility.
• After leverage is safe, execute the remaining $34.5 million repurchase authorization only when the stock trades below a conservative SOTP. At the current price, the authorization is large enough to retire a meaningful part of the company, but using it too early would increase financial risk.
• Tie management compensation more directly to organic SaaS growth, quality-customer NRR, adjusted free cash flow after restructuring costs and net debt reduction. Current incentives already include SaaS revenue, EBITDA and FCF, but the revenue metric should exclude acquisitions and internal migrations.
• Begin a strategic review once Thryv is a clean pure-play. A profitable SMB software platform with integrated marketing, CRM, automation and payments could be more valuable to a strategic buyer or private-equity owner than inside a declining media wrapper. A sale is an option after operational proof, not a substitute for it.
Ownership and Governance
Paulson & Co. owned approximately 19.0% of the shares in the 2026 proxy, CEO Joseph Walsh beneficially owned approximately 7.2%, and directors and executive officers as a group owned approximately 10.5%. This is meaningful alignment and gives the shareholder base enough concentration to support a disciplined transition. It is not a guarantee of good capital allocation. The related-party term-loan holding and the board’s willingness to consider acquisitions mean minority shareholders should insist on transparent conflict review and debt-first capital allocation.
Executive incentives are based partly on Adjusted EBITDA, free cash flow and reported SaaS revenue. Those are directionally sensible measures. The weakness is that reported SaaS revenue can increase through acquisitions and internal customer conversions without proving organic product-market fit. The compensation committee should add organic SaaS growth and retention gates, with no payout for acquisition-driven revenue that fails to create per-share value.
Catalysts and What to Watch
What to watch | Pass condition | Investment inference |
Q2 results on August 4, 2026 | SaaS revenue $114-$115m; SaaS EBITDA $12-$13m; Marketing Services revenue $31-$33m; EBITDA $3-$4m | A clean beat would support the view that Q1 was the margin trough. A miss would put full-year guidance at risk. |
SaaS gross margin | Recover above 67% and move back toward 70%+ | Shows whether migrated service revenue and integration costs are temporary rather than structural. |
Seasoned NRR | Hold at 93% and begin moving toward 95%-100% | The company cannot earn a premium software multiple while the installed base continues to shrink. |
Quality customers and ARPU | Quality-customer count grows; ARPU moves above $380 without higher churn | Confirms that the upmarket strategy is creating real value rather than relying only on pricing. |
Marketing Center | Sustain at least 20% growth | This is the clearest native growth product and the best test of the unified platform. |
Cash and debt | Positive full-year FCF, lower ABL usage and visible term-loan reduction | The equity rerating depends on enterprise value accruing to shareholders rather than lenders. |
Conversion disclosure | Separate migrated, acquired and organic SaaS growth | Improves credibility and allows investors to underwrite the core platform. |
Capital allocation | No material M&A; debt first | A new acquisition before proof would weaken the thesis and may require further dilution. |
Thryv is scheduled to release Q2 2026 results before the market opens on August 4, 2026. Because the current equity value is small relative to debt and pension obligations, Q2 gross margin, retention and cash-flow commentary may matter more than a modest revenue beat.
Risks
The largest risk is that SaaS is not a strong enough business to replace the runoff. Reported 2026 growth is near flat, seasoned NRR is 93% and SaaS customers are declining. The company may have built a useful bundle without building a product that deserves a high software multiple. If Marketing Center growth slows and retention remains below 95%, the base valuation is too high.
The second risk is that the AI story remains a feature set rather than a moat. Many competing CRM, marketing, website and payments platforms can add similar generative AI and automation functions. Thryv must prove that its workflow data and local-business distribution reduce churn or improve monetization. Without measurable adoption and financial impact, AI should receive no separate premium.
The third risk is the pace of the Marketing Services decline. Revenue timing is affected by print publication cycles, and the ABL borrowing base is supported exclusively by legacy assets that are expected to terminate. If legacy cash generation falls faster than cost removal, debt paydown may stall just as the borrowing base contracts.
The fourth risk is leverage. Debt plus pension obligations exceed the equity value, the term loan carries a high interest spread and maturity is in 2029. A recession among small businesses, a working-capital shock or a SaaS execution miss could force asset sales, refinancing or equity issuance at an unattractive price.
The fifth risk is capital allocation. Management has described acquisitions as part of the strategy and used an equity offering to fund Keap. A second acquisition before the current platform is integrated would increase complexity and reduce the per-share value of a successful turnaround. The board should be judged on value per share, not on SaaS revenue purchased.
The sixth risk is disclosure quality. Internal migrations can make SaaS revenue appear stronger while reducing Marketing Services revenue. The company provides useful segment data, but investors still lack a complete organic revenue bridge, cohort NRR, CAC payback, AI adoption and native-versus-converted margin information. A thesis based on improving unit economics cannot be fully verified without those metrics.
The seventh risk is execution timing. Even if the final business is attractive, the stock can remain depressed through 2027 while the company pays restructuring costs, decommissions systems and reduces debt. High percentage upside does not necessarily mean a quick rerating.
What Would Break the Thesis
• Full-year SaaS revenue falls below the $463 million guidance floor without a clear one-time explanation.
• Seasoned NRR falls below 90%, quality-customer count declines for two consecutive quarters or ARPU growth is driven by pricing while churn accelerates.
• SaaS adjusted gross margin remains below 67% into 2027, indicating that the service-heavy revenue mix is structural.
• Marketing Services cash flow falls materially faster than the published revenue and EBITDA path, preventing debt reduction.
• Net debt does not decline on a full-year basis, or the company undertakes a material acquisition before leverage falls below 1.0x.
• Management extends the 2028 Marketing Services exit without a clear net-present-value justification.
Final Thoughts
I would describe Thryv as a leveraged AI-enabled SaaS separation, not an AI hype trade and not a simple Yellow Pages liquidation. The legacy operation is shrinking quickly, but it still provides the customer relationships and cash needed to build the replacement business. The SaaS segment is already profitable and large relative to the current equity value, but it has not yet earned a premium valuation because customer count, retention, organic growth and cash conversion remain weak.
The market does not need to believe that Thryv becomes the next HubSpot (HUBS). The base case only requires the software business to stabilize near the current revenue level, recover normal margins, return to moderate growth and use the legacy runoff to reduce financial obligations. At an 8.5x multiple on approximately $75 million of normalized SaaS EBITDA, plus a conservative runoff value, my base SOTP is approximately $8.90 per share.
The successful case becomes much larger because the equity is small relative to enterprise value. If SaaS EBITDA reaches approximately $95 million, retention moves toward 100% and debt falls, the equity can approach $17.50 per share without using an extreme AI multiple. The same leverage creates the downside: a weak SaaS product and a faster legacy decline can leave little value after debt and pension obligations.
The right shareholder posture is supportive but strict. Support the platform transition and the 2028 exit, but do not give management a blank check for acquisitions or vague AI claims. Demand organic revenue disclosure, cohort retention, improving gross margin, debt reduction and a clear capital-return framework. If Thryv executes those steps, the market can stop valuing it as a dying media company and begin valuing it as a smaller but credible SMB software platform. If it does not, the low share price will have been a warning rather than an opportunity.



Comments
Log in or sign up to join the conversation.