

Investment Setup
Buda Juice (BUDA) is already profitable, has no funded debt and has built a cold-chain system that lets grocers sell genuinely fresh juice in the produce section. The shares closed at about $7.51 on 30 July 2026, giving the company a market value of roughly $94 million. Cash was $19.8 million at the end of March 2026, so enterprise value was close to $75 million. Against $12.6 million of 2025 revenue and about $3.8 million of adjusted EBITDA, BUDA is not cheap on current earnings. The case depends on whether Dallas can support a much larger national business. [Market Data] [Annual Report 2025] [Q1 2026 10-Q]
Current Capital Structure | Value |
Share price | $7.51 |
Basic shares outstanding | ~12.57m |
Market value | ~$94.4m |
Cash | ~$19.8m |
Funded debt | ~$0m |
Enterprise value | ~$74.6m |
FY2025 revenue | $12.6m |
FY2025 adjusted EBITDA | ~$3.8m |
EV / FY2025 revenue | ~5.9x |
EV / FY2025 adjusted EBITDA | ~19.6x |
The market appears to give BUDA credit for its past growth, high margins and strong free cash flow, but little credit for a broad national rollout. That matters because the company has several strengths that are easy to miss: H-E-B has already proved the model, private label appears to earn similar gross margins to branded products, Dallas has large unused capacity, automation has reduced production cost, and Walmart (WMT) and Kroger (KR) are still at an early stage. The value therefore sits mainly in future revenue and operating leverage rather than in a low current multiple. [Planet MicroCap Transcript] [Q1 2026 Earnings Call] [Author View]
Why The Opportunity Exists
BUDA is often seen as a small juice brand, but the business is closer to a fresh-product platform for grocers. It develops the product, buys and tests fruit, controls production, keeps the product cold, manages food safety, creates private-label programmes and delivers a ready-to-sell product into the produce section. A grocer that tried to do this inside every store would need equipment, trained workers, fruit buying, daily controls and careful waste management. BUDA provides the full system instead. [Annual Report 2025] [Planet MicroCap Transcript]
The offer to the grocer is simple: add a high-quality fresh product at a price that can remain close to shelf-stable alternatives, without building an in-store production system. Management also says BUDA pays little in slotting fees and spends little on normal consumer marketing because the products sit beside fresh fruit and vegetables. This can make growth more efficient than a normal beverage launch. [Planet MicroCap Transcript] [Management / Investor Commentary]
The Produce Section Is A Real Differentiator
BUDA keeps fruit, production rooms, washing, packaging and delivery at about 35 degrees Fahrenheit. The annual report describes an unbroken cold chain from fruit to shelf and an official shelf life of about eight to twelve days. The products are not pasteurised, HPP-treated or UV-treated, and management says they can reach the store within about 72 hours. This is different from many drinks that look fresh but are processed for a much longer shelf life. [Annual Report 2025] [Planet MicroCap Transcript] [Company Investor Page]
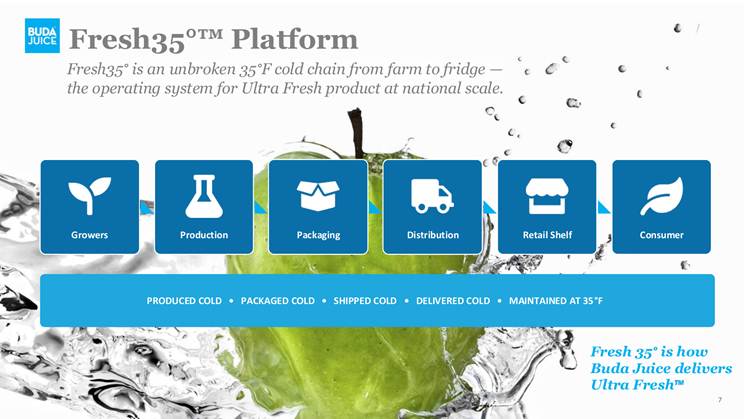
Source snapshot: the Fresh35 platform keeps the product cold through sourcing, production, packaging, delivery and retail placement. [Planet MicroCap Presentation]
The produce section is also important because this is where shoppers expect fresh food. A competitor may be able to copy a flavour, but replacing the full system is harder. It would need cold production rooms, food-safety approval, short delivery times, strong fill rates and retailer trust. This makes BUDA more useful to a grocer than a normal bottle of juice. [Annual Report 2025] [Planet MicroCap Transcript]
H-E-B Private Label Proves The Economics
Based on management feedback, H-E-B is currently the only customer using BUDA for private label, although it also sells BUDA-branded products. Management says private-label gross margins are broadly the same as branded margins because BUDA still supplies the juice, bottle, cap, label and full production process. This means private label is not lower-quality revenue. It gives BUDA volume, plant use and a close retailer relationship without a clear margin penalty. [Planet MicroCap Transcript] [Management / Investor Commentary]
Revenue Source | FY2024 | FY2025 | Growth | Q1 2025 | Q1 2026 | Growth |
Branded | $7.72m | $7.02m | -9% | $1.78m | $1.78m | ~0% |
Private label / other | $3.55m | $5.59m | +57% | $1.20m | $1.73m | +44% |
Total | $11.27m | $12.61m | +11.8% | $2.98m | $3.51m | +17.7% |
Private label and other revenue drove most of the recent growth, while branded revenue was weak. This mainly reflects the large H-E-B relationship. Growth outside H-E-B should be more branded at first, especially through Walmart, Kroger and regional grocers, although BUDA can also offer private label to other customers. The mix is therefore better than the table first suggests: H-E-B proves the private-label model, while national branded products provide the main route to diversification. [Annual Report 2025] [Q1 2026 10-Q] [Management / Investor Commentary]
H-E-B Proves The Model, But Concentration Is Still The Main Risk
One customer generated $12.18 million, or 97% of 2025 revenue, and 96% of Q1 2026 revenue. The SEC filing does not name the customer, but management has described H-E-B as the main relationship and said it has lasted about eight years. BUDA has around 14 SKUs in larger H-E-B stores, and the filed principal-customer revenue grew about 14% in 2025. H-E-B is also widely seen as a strong grocery operator, so success there can help BUDA win trust with other grocers. [Annual Report 2025] [Q1 2026 10-Q] [Planet MicroCap Transcript] [Management / Investor Commentary]
The concentration is still serious because the filings do not show a long-term minimum-volume contract. H-E-B has bargaining power and a large fall in orders would hurt BUDA. However, this is not an easy product to replace quickly. A new supplier would need to match the recipe, private-label packaging, food-safety controls, short shelf life, frequent delivery and service across hundreds of stores. I therefore see concentration as a real medium-term business risk, but not as an automatic near-term customer loss. [Annual Report 2025]
Walmart And Kroger Can Change The Scale
Walmart is the first clear test outside Texas. BUDA Fresh Cherry Limeade is now in 246 Walmart stores across nine states in a 12-ounce bottle and a 32-ounce bottle. The products were on shelves by early May and are supplied from Dallas. Walmart has 3,569 U.S. Supercenters, so the current rollout covers only about 7% of that base and only one flavour in two sizes. [Q1 2026 Results] [Q1 2026 Earnings Call] [Walmart Store Data]
Kroger is another important route. Public filings do not give the current store or SKU count, but management and investor feedback indicate that the test is still small and includes several SKUs. Kroger has more than 2,700 stores nationally. I do not use the exact test figures as filed facts, but the relationship gives BUDA a second large national option if early store sales are strong. [Planet MicroCap Transcript] [Kroger Store Data] [Management / Investor Commentary]
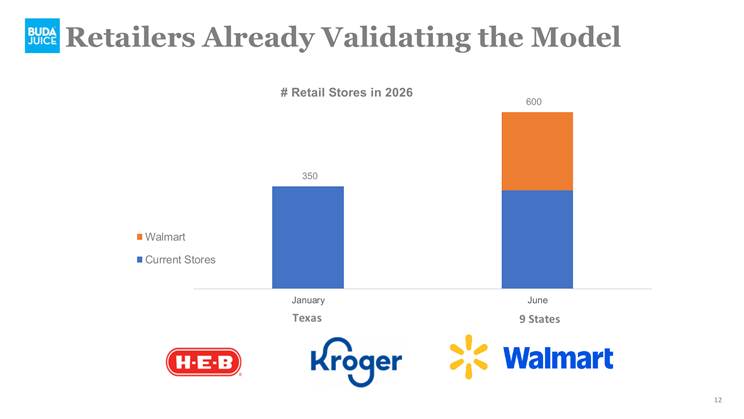
Source snapshot: the company presentation shows the store base rising from about 350 in January to about 600 in June after the Walmart launch. [Planet MicroCap Presentation]
A simple H-E-B benchmark shows the possible scale. If the filed $12.18 million of principal-customer revenue is spread across about 300 stores and 14 SKUs, it equals roughly $2,900 of annual BUDA revenue per store per SKU. Using the same rough number, Walmart at two formats across all U.S. Supercenters could support about $20.7 million of revenue. Five SKUs across Kroger could support close to $39 million. These figures are not guidance and actual prices, store size, shelf space and product demand will differ. They are only a way to show that even a partial rollout can matter for a company with $12.6 million of 2025 revenue. [Annual Report 2025] [Walmart Store Data] [Kroger Store Data] [Author Calculations]
Illustrative Retailer Math | Relevant Stores | SKUs / Formats | Revenue Per Store Per SKU | Illustrative Revenue |
Filed principal customer / H-E-B benchmark | ~300 | ~14 | ~$2,900 | $12.18m actual |
Walmart current rollout | 246 | 2 | ~$2,900 | ~$1.4m |
Walmart national Supercenters | 3,569 | 2 | ~$2,900 | ~$20.7m |
Kroger national footprint | >2,700 | 5 illustrative | ~$2,900 | ~$39m |
The H-E-B store count and Kroger SKU figure come from management and investor commentary rather than a separate SEC table. I use them only as a scale check. The DCF does not assume that every Walmart or Kroger store reaches H-E-B sales levels.
Dallas Creates The Operating Leverage
The main source of value is not only more stores. It is more stores using a plant that is already built. BUDA expanded Dallas to about 37,900 square feet and added cooler space, automation, robotics and production capacity. Management says Dallas can support about $55 million of annual sales, compared with $12.6 million in 2025. Revenue can therefore grow several times before Dallas reaches its stated capacity. [Annual Report 2025] [Planet MicroCap Transcript]
BUDA is already very profitable while using only a fraction of Dallas capacity. Management also says automation and robotics have cut production cost per ounce sharply over time. As volume rises, plant management, quality control, public-company costs and other fixed costs should grow much more slowly than revenue. Q1 2026 already showed production labour falling by more than 150 basis points as a share of revenue, even though lime prices hurt gross margin. This operating leverage is the largest reason the revised DCF is higher. [Q1 2026 Results] [Q1 2026 Earnings Call] [Planet MicroCap Transcript]
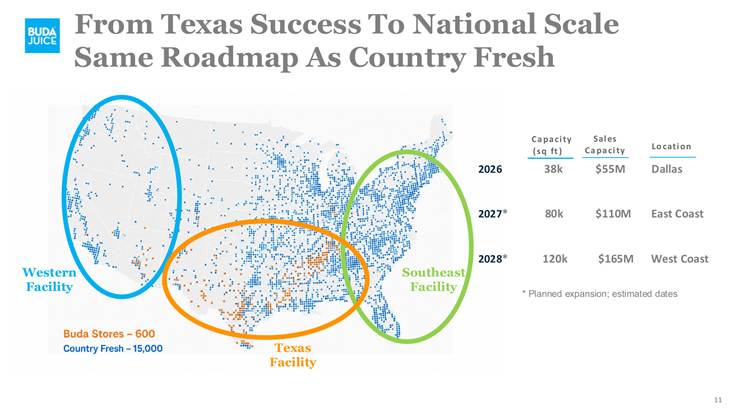
Source snapshot: management plans to use Dallas, an East Coast plant and a western plant, with stated sales capacity of about $55 million at each hub. [Planet MicroCap Presentation]
National Expansion Should Follow Customer Demand
Older filings targeted South Carolina in 2026 and a western plant in 2027. At the June 2026 conference, management described the next plant as opening the following year and the western plant one year later, pointing more toward 2027 and 2028. I use the later timing because it is more recent and because waiting for clear customer demand protects cash. Each new facility has previously been estimated at about $5 million of capital expenditure. [Annual Report 2025] [Planet MicroCap Transcript]
Production Phase | Timing Used | Stated Sales Capacity | Role In The Thesis |
Dallas | Operating today | ~$55m | Existing profit base and main operating leverage |
East Coast | 2027E | ~$55m incremental | Serve eastern customers with shorter delivery times |
Western facility | 2028E | ~$55m incremental | Complete the national footprint |
Total network | After all three | ~$165m | Physical capacity, not revenue guidance |
The new plants create value only if customers are ready to use them. An empty cold-chain plant adds rent, workers, quality-control costs and working capital before it adds enough sales. The right order is to use Dallas, secure retailer demand and then open each regional hub against clear volume. The base model deducts about $5 million of expansion capex in 2027 and another $5 million in 2028. [Company Filings] [Author Calculations]
Ultra Fresh Can Grow Beyond Juice
The long-term idea is wider than juice. Management wants to take products that are usually processed and sold in the centre aisle and offer fresh versions around the store perimeter. Dressings are the first early example. Management has also discussed salsa, soups, nut butters, pasta sauces and fresh meals. The same produce buyer, cold-chain system and retailer relationship may support several categories. [Planet MicroCap Transcript]
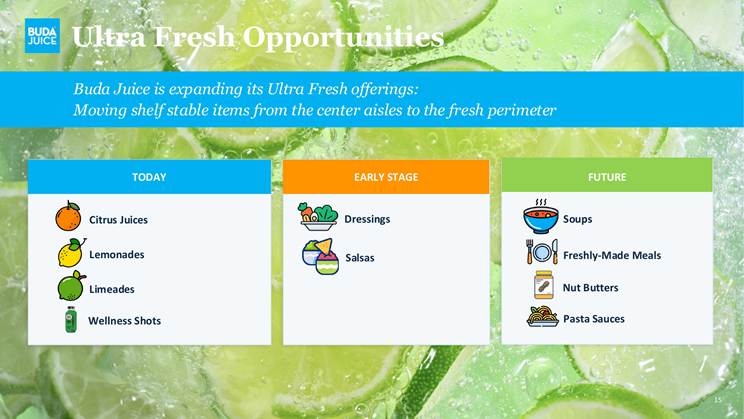
Source snapshot: management presents juice as the first product, with dressings and salsa at an early stage and other fresh-food categories as longer-term options. [Planet MicroCap Presentation]
I do not include these new categories in the base revenue forecast. They remain early and may need new equipment, ingredients and shelf-life testing. I treat them as extra upside. If one or two categories work, BUDA can raise revenue per retailer without depending only on more juice stores. [Author Calculations]
The Financial Base Is Strong For A Company Of This Size
Many small beverage companies lose money while they build distribution. BUDA is different. It has reported more than four years of profit, positive free cash flow and no funded debt. In 2025, revenue was $12.6 million, gross margin was 44.6%, adjusted EBITDA was about $3.8 million and free cash flow was about $3.0 million. The January IPO then increased cash to almost $20 million. [Annual Report 2025] [FY2025 Earnings Call] [Q1 2026 10-Q]
Financial Summary | FY2024 | FY2025 | Q1 2025 | Q1 2026 |
Revenue | $11.27m | $12.61m | $2.98m | $3.51m |
Revenue growth | +20.2% | +11.8% | - | +17.7% |
Gross margin | 46.2% | 44.6% | 44.9% | 39.5% |
Operating income | $3.41m | $3.45m | $0.80m | $0.59m |
Adjusted EBITDA | - | ~$3.8m | ~$0.9m | ~$0.85m |
Free cash flow | - | ~$3.0m | ~$0.8m | ~$1.1m reported |
Cash | $1.89m | $1.84m | - | $19.83m |
Funded debt | $0m | $0m | $0m | $0m |
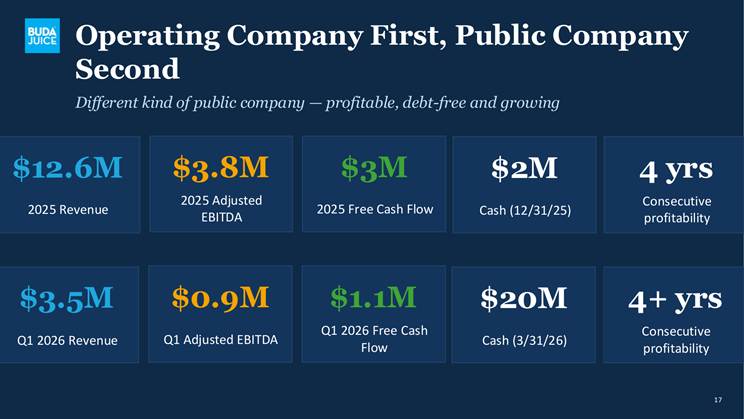
Source snapshot: the June 2026 presentation highlights 2025 revenue, adjusted EBITDA, free cash flow, cash and more than four years of profitability. [Planet MicroCap Presentation]
Q1 gross margin fell because lime prices rose sharply after a supply problem in western Mexico. Management said normalised gross margin would have been closer to the historic mid-40% range and expected margin to move back above 40% in Q2. Q1 net income also included a deferred-tax charge after the move to a C corporation. The weaker reported profit therefore does not fully show the underlying quarter, although commodity risk is real. [Q1 2026 Earnings Call] [Q1 2026 10-Q]
Fast Turns Support Free Cash Flow
BUDA appears to need little working capital for its size. The product lasts only eight to twelve days, so finished goods move quickly and stores need regular replenishment. At March 2026, finished-goods inventory was zero, while receivables, inventory and payables were small compared with annual sales. The filings therefore support a short cash cycle. Company feedback also points to several deliveries each week for large customers, although exact delivery schedules are not disclosed in the filings. [Annual Report 2025] [Q1 2026 10-Q] [Management / Investor Commentary]
Q1 2026 Cash Flow Bridge | Value |
Operating cash flow | $1.305m |
Less: capital expenditure | -$0.218m |
Reported free cash flow | $1.087m |
Less: working-capital benefit | -$0.676m |
Less: interest income on IPO cash | -$0.137m |
Normalised Q1 free cash flow | ~$0.274m |
2026 base free cash flow used | ~$3.18m |
The reported $1.1 million of Q1 free cash flow should not simply be multiplied by four because working capital and interest income helped the quarter. At the same time, the old $2.1 million 2026 forecast was too low because Q1 was seasonally weaker, Walmart had not yet contributed, lime costs were unusually high and Dallas has strong operating leverage. The revised model uses a middle-ground 2026 base free cash flow of about $3.18 million. Lower working-capital needs improve the value slightly, but the much larger DCF change comes from automation, lower production cost and higher margins as Dallas fills. [Q1 2026 10-Q] [Author Calculations]
DCF Method
I value BUDA as an independent public company and do not include a takeover premium. The model starts with the 2025 financial base and changes revenue growth, margins, plant spending and the speed of the national rollout. I use a 21% cash tax rate, depreciation equal to 2.5% of revenue, maintenance capex equal to 2% of revenue and working-capital investment equal to 3% of incremental revenue. The lower working-capital rate reflects the short shelf life, frequent replenishment and fast cash cycle. The model also deducts about $5 million for an East Coast plant in 2027 and $5 million for a western plant in 2028. Cash is added after these future costs are included in free cash flow. [Q1 2026 10-Q] [Company Filings] [Author Calculations]
The model uses about 12.57 million basic shares. The underwriter warrants are a small dilution risk if the share price remains above the exercise price, but they do not change the broad result. [Q1 2026 10-Q] [Author Calculations]
Bear Case: Dallas Remains Profitable, But National Growth Is Slow
The bear case does not assume that H-E-B disappears. That would be a severe downside case. I assume the main customer remains, Walmart does not move far beyond the first rollout, branded growth is limited and management delays large new hubs. Revenue reaches only $31 million in 2031. EBITDA margin falls to 24% and stays there, below the 2025 level, because public-company costs, citrus prices and low plant use offset some automation benefits. [Author Calculations]
Bear DCF | 2026E | 2027E | 2028E | 2029E | 2030E | 2031E |
Revenue | $16.0m | $18.0m | $21.0m | $24.0m | $27.0m | $31.0m |
EBITDA margin | 24.0% | 24.0% | 24.0% | 24.0% | 24.0% | 24.0% |
EBITDA | $3.84m | $4.32m | $5.04m | $5.76m | $6.48m | $7.44m |
Free cash flow | $1.90m | $2.59m | $3.08m | $3.51m | $3.93m | $4.50m |
Bear Valuation | Value |
Discount rate | 15.0% |
Terminal EBITDA multiple | 9.0x |
Present value of forecast cash flow | ~$11.5m |
Present value of terminal value | ~$28.9m |
Enterprise value | ~$40.5m |
Add cash | ~$19.8m |
Equity value | ~$60.3m |
Value per share | ~$4.80 |
Return from $7.51 | ~-36% |
This case still gives value to a profitable Dallas plant and the cash balance. It also shows that the present share price is not fully protected by current earnings. If national growth remains slow, the stock can fall even without losing H-E-B. [Author Calculations]
Base Case: Dallas Fills And National Growth Starts To Show
The base case assumes that H-E-B continues to grow, Walmart expands after the first test, Kroger and regional grocers add useful volume, and branded products drive most growth outside H-E-B. Dallas remains the main engine, while the East and West Coast plants are opened only when demand is visible. Revenue reaches $72 million in 2031, below half of management’s stated $165 million network capacity. EBITDA margin settles near 31.5% as automation, fixed-cost leverage and fast working-capital turns support cash conversion. [Planet MicroCap Transcript] [Management / Investor Commentary] [Author Calculations]
Base DCF | 2026E | 2027E | 2028E | 2029E | 2030E | 2031E |
Revenue | $18.0m | $25.0m | $35.0m | $47.0m | $61.0m | $72.0m |
Revenue growth | +43% | +39% | +40% | +34% | +30% | +18% |
EBITDA margin | 31.0% | 30.0% | 30.5% | 31.0% | 31.5% | 31.5% |
EBITDA | $5.58m | $7.50m | $10.68m | $14.57m | $19.22m | $22.68m |
Expansion capex | $0.8m | $5.0m | $5.0m | $0.0m | $0.0m | $0.0m |
Free cash flow | $3.18m | $0.35m | $2.62m | $10.46m | $13.86m | $16.53m |
Base DCF Valuation | Value |
Discount rate | 13.0% |
Terminal EBITDA multiple | 12.0x |
Present value of forecast cash flow | ~$26.8m |
Present value of terminal value | ~$130.7m |
Enterprise value | ~$157.5m |
Add cash | ~$19.8m |
Equity value | ~$177.3m |
Shares outstanding | ~12.57m |
Value per share | ~$14.11 |
Return from $7.51 | ~88% |
The base value is higher than the first DCF because the new operating facts support better cash flow. The 2026 free-cash-flow estimate is now a middle ground rather than a simple annualisation of Q1. The larger change comes from Dallas: automation lowers unit cost, unused capacity allows sales to rise faster than overhead, and fast replenishment limits the cash tied up in inventory. These changes raise the long-term margin path and the terminal value. [Author Calculations]
Bull Case: BUDA Becomes A National Ultra Fresh Platform
The bull case assumes a broad Walmart rollout, a larger Kroger relationship, more regional grocers, more SKUs and successful East and West Coast plants. It also assumes that H-E-B becomes a much smaller share of group revenue. Revenue reaches $127.8 million in 2031, still below the stated $165 million network capacity. EBITDA margin reaches 33% as production, public-company and product-development costs are spread over a much larger sales base. [Planet MicroCap Presentation] [Author Calculations]
Bull DCF | 2026E | 2027E | 2028E | 2029E | 2030E | 2031E |
Revenue | $19.0m | $30.0m | $48.0m | $70.0m | $95.0m | $127.8m |
EBITDA margin | 33.0% | 32.0% | 33.0% | 33.0% | 33.0% | 33.0% |
EBITDA | $6.27m | $9.60m | $15.84m | $23.10m | $31.35m | $42.17m |
Free cash flow | $3.68m | $1.81m | $6.27m | $16.56m | $22.62m | $30.45m |
Bull Valuation | Value |
Discount rate | 12.0% |
Terminal EBITDA multiple | 13.0x |
Enterprise value | ~$325.7m |
Add cash | ~$19.8m |
Equity value | ~$345.6m |
Value per share | ~$27.49 |
The bull case is possible, but it is not yet proven. BUDA would need repeat orders, more stores, more SKUs, successful regional plants and strong margins. New categories such as dressings would add upside, but the model does not need them to reach the bull revenue forecast. [Author Calculations]
DCF Sensitivity
The valuation is sensitive to the terminal multiple because BUDA is still early in its national rollout. The table below keeps the base operating forecast unchanged and only changes the discount rate and terminal EBITDA multiple. [Author Calculations]
WACC / Terminal Multiple | 10.0x | 11.0x | 12.0x | 13.0x | 14.0x |
12% | $12.94 | $13.85 | $14.76 | $15.68 | $16.59 |
13% | $12.37 | $13.24 | $14.11 | $14.97 | $15.84 |
14% | $11.85 | $12.67 | $13.49 | $14.31 | $15.13 |
15% | $11.35 | $12.13 | $12.91 | $13.69 | $14.47 |
What Must Happen For The Thesis To Work
Area | Current Position | Evidence Needed |
Revenue growth | Q1 grew 17.7% before Walmart | Growth above about 25% as new stores contribute |
Walmart | 246 stores and two bottle sizes | Repeat orders, more stores, more flavours or sizes |
Customer concentration | One customer is 96%-97% of revenue | New customers become material |
Private label | Only H-E-B uses it today | Similar margins continue; option offered to other grocers |
Gross margin | 39.5% in Q1 after lime spike | Recovery above 40% and toward the mid-40% range |
Dallas leverage | Large spare capacity and automation | Sales rise faster than labour and overhead |
Working capital | Short shelf life and high turns | Cash conversion remains strong as sales grow |
New facilities | East and West plans are early | Customer demand secured before large spending |
Main Risks
The largest risk is still customer concentration. A pricing dispute, food-safety problem or change in H-E-B strategy could hurt most of the current revenue base. The relationship appears operationally sticky, but BUDA does not disclose a minimum-volume contract. The second risk is that Walmart or Kroger trials do not produce enough store-level sales for a wider rollout. Store count without repeat orders does not create value. [Annual Report 2025] [Q1 2026 10-Q]
The third risk is expansion timing. New cold-chain plants add fixed costs before they reach good volume. The fourth risk is fruit-price volatility, as Q1 lime costs showed. The fifth risk is that working-capital turns slow as the customer base becomes wider or delivery distances rise. The final risk is valuation: if growth slows, both earnings estimates and the market multiple can fall at the same time. [Q1 2026 Results] [Annual Report 2025]
Return Summary
The return range is wide because value depends on how quickly BUDA turns small retailer tests into repeat national orders. The bear case keeps H-E-B and a profitable Dallas plant. The base and bull cases need more stores, more SKUs and clear operating leverage. I judge the thesis mainly against the base case rather than against management’s full physical-capacity target.
Scenario | Value Per Share | Return From $7.51 |
Current share price | $7.51 | - |
Reasonable bear case | $4.80 | -36% |
Base DCF | $14.11 | +88% |
Bull DCF | $27.49 | +266% |
Conclusion
Buda Juice is not cheap on current sales or current EBITDA, but it is also not a normal early-stage beverage company. It has a profitable Dallas plant, about $20 million of cash, no funded debt, a long H-E-B relationship and an operating system that puts genuinely fresh products in the produce section. The market appears to value the historic margins and free cash flow, but not the full national option. [Annual Report 2025] [Q1 2026 Results] [Author View]
The new operating detail makes the case stronger. H-E-B proves that private label can work at attractive margins. Growth outside H-E-B should mainly come from branded products, with private label as another option for grocers. Dallas has much more capacity than current sales, automation and robotics have reduced production cost, and the short shelf life creates a fast-turn business with limited working-capital needs. These points support higher long-term margins and stronger free cash flow than a simple juice-brand model. [Planet MicroCap Transcript] [Management / Investor Commentary]
My reasonable bear value is about $4.80 per share, the base DCF is about $14.11 and the bull case is about $27.49. The downside remains real because one customer still controls almost all current revenue. However, the base case offers about 88% upside from $7.51 and assumes only $72 million of 2031 revenue, well below management’s stated network capacity. The thesis is simple: BUDA has already proved that Ultra Fresh can make money in Texas; the next step is to prove that the same produce placement, branded growth, operating leverage and fast cash cycle can work across national grocers. [Author Calculations]



Comments
Log in or sign up to join the conversation.