

I recently began a series of reports demonstrating that precious metals and mining stocks remain firmly in a long-term secular bull market that began only in early 2024 and therefore still has many more years to run. I expect this bull market to ultimately take gold to at least $15,000 an ounce and silver to at least $300 to $500 an ounce. Click here to read the first report in this series, which focuses on silver.
I am writing these reports to encourage my subscribers and explain why the precious metals bull market remains very much intact, and why the correction that began in January was merely a pause or normal cooling-off period rather than the beginning of a new long-term bear market.
In today’s report, I want to discuss the concept of capital rotation between stocks and precious metals and explain why it confirms that the precious metals bull market is still only in its early stages and has much further to run. I will also show how the previous secular precious metals bull markets of the 1970s and 2000s experienced significant corrections of their own, just like the one we have experienced since January, which is now likely over, as I explained in my latest technical update.
To understand today’s report, I first want to explain that historically, stocks and precious metals have essentially acted as counterbalances to one another. When one is in a secular, or long-term, bull market, the other is typically in a secular bear market, and vice versa, as capital rotates from one to the other in recurring cycles that typically last at least a decade.
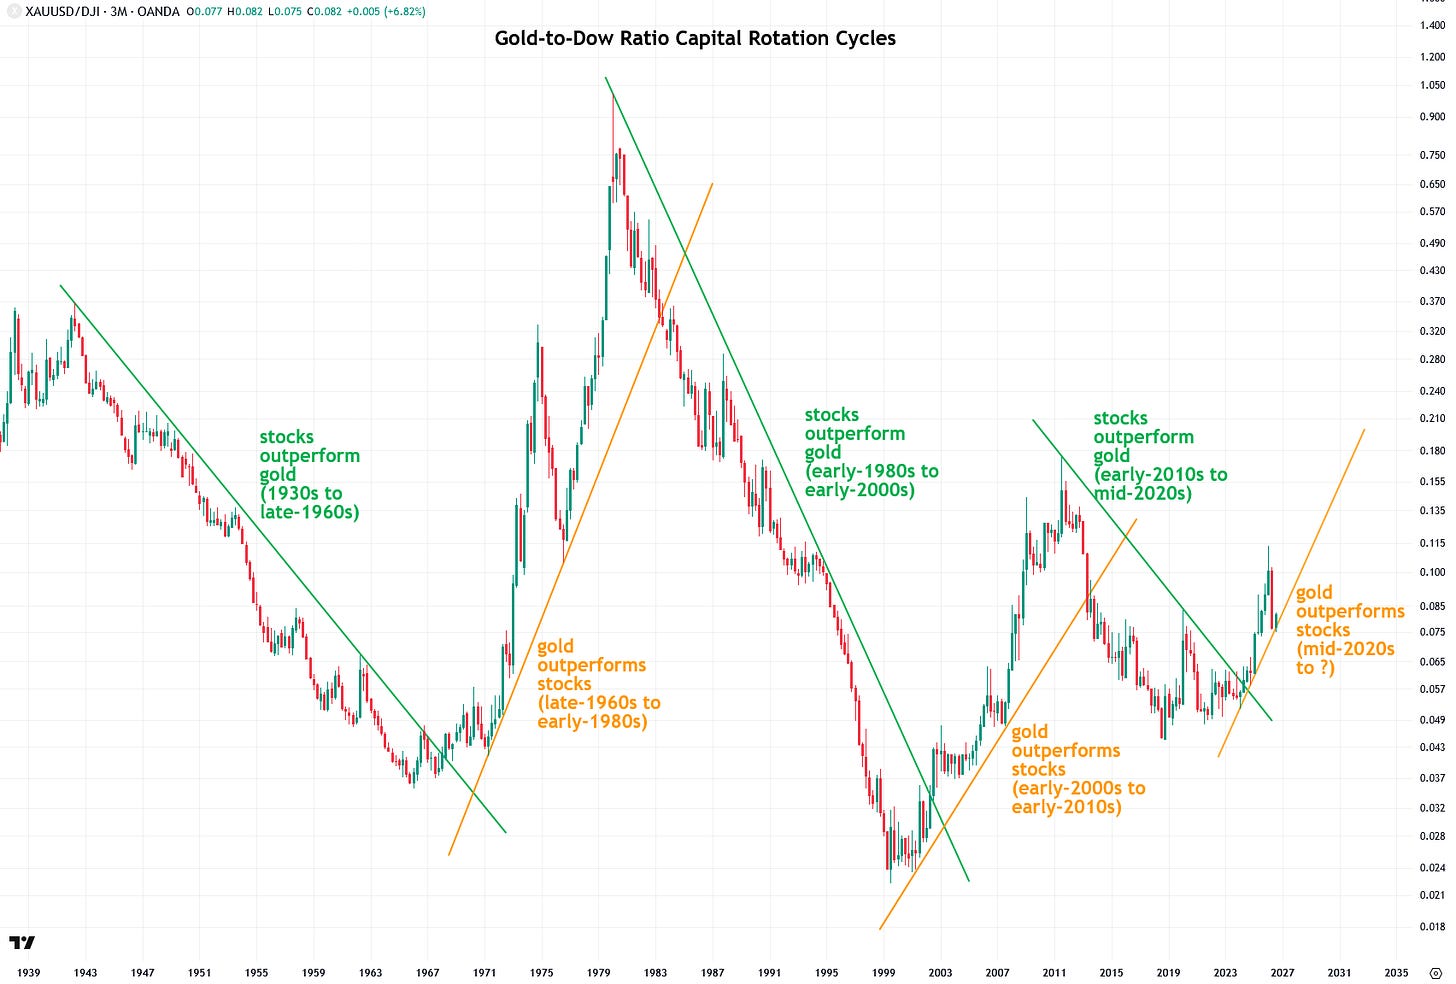
The long-term chart below of the gold-to-Dow ratio, shown on a logarithmic scale, illustrates this concept very clearly. When the ratio is declining, stocks are outperforming gold, while when the ratio is rising, gold is outperforming stocks. I chose the Dow for this comparison simply because it has the longest history, but the same concept applies to other major stock indices, including the S&P 500 and Nasdaq 100.
Periods when stocks outperformed gold, as shown by the green trendlines, include the 1930s through the 1960s, the early 1980s through the early 2000s, and the early 2010s through the mid-2020s. Conversely, periods when gold outperformed stocks, as shown by the gold trendlines, include the late 1960s through the early 1980s, the early 2000s through the early 2010s, and the current cycle of gold outperformance, which began in April 2024.
The way to determine when a new cycle has begun is by watching for a break of the prevailing trendline. When a green trendline is broken to the upside, it signals the start of a new secular bull market in gold and a secular bear market or period of stagnation in stocks. Conversely, when a gold trendline is broken to the downside, it signals the start of a new secular bull market in stocks and a secular bear market in gold.
While I focused on gold in the previous chart and section, this capital rotation between stocks and gold also applies to silver, as well as precious metals mining stocks. That is not surprising, as both are highly correlated with gold and typically follow its long-term trends.
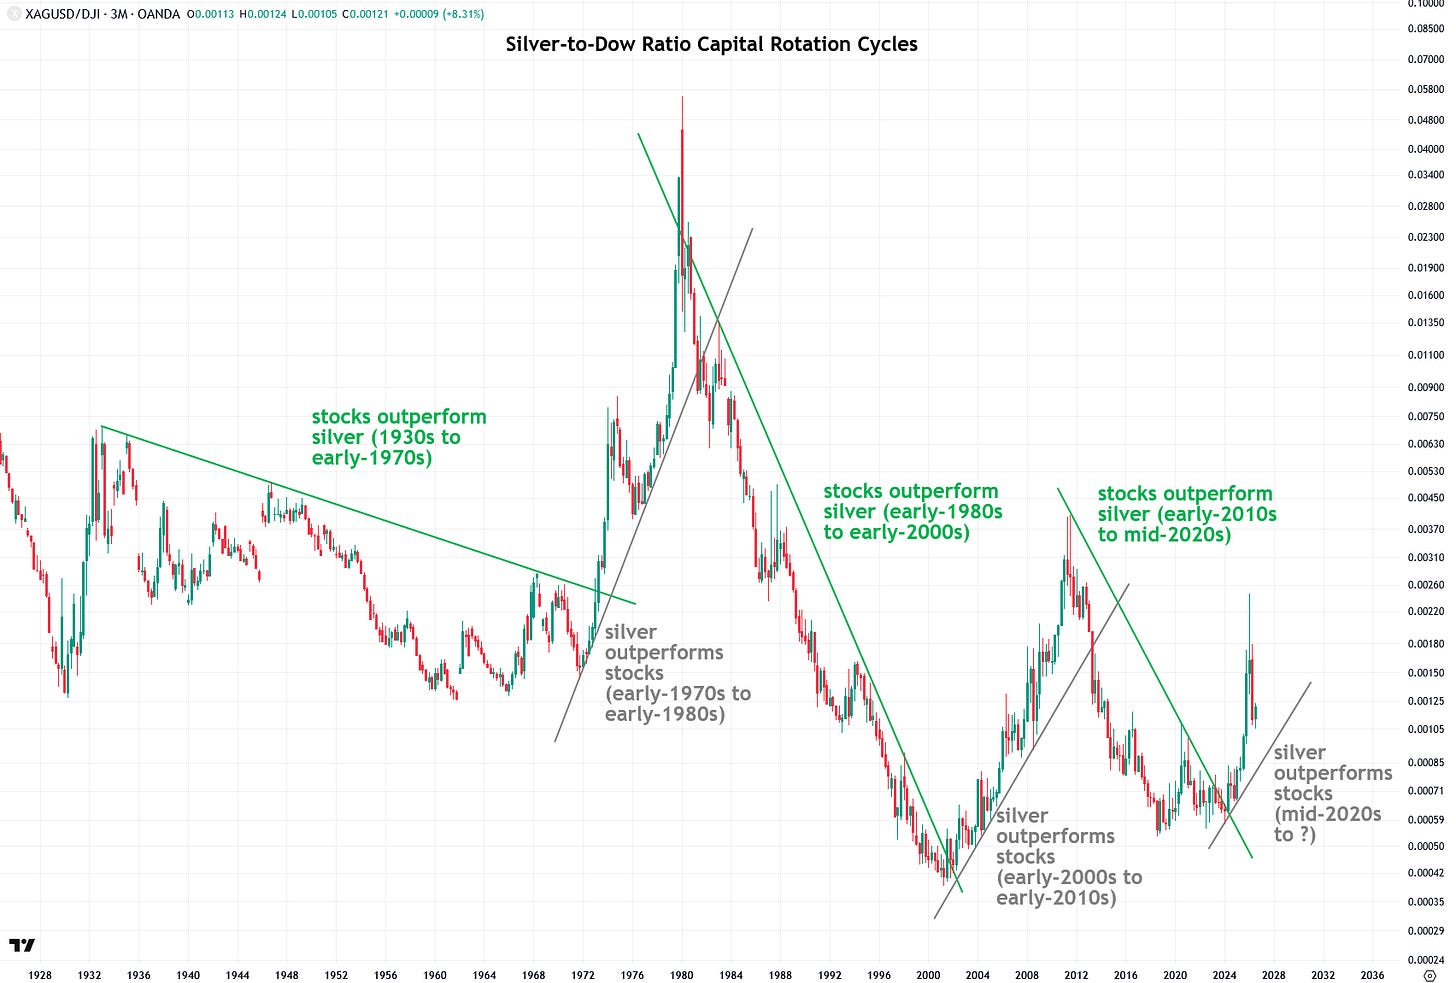
The chart below shows the silver-to-Dow ratio and reveals the same recurring cycles, lasting more than a decade, in which silver outperforms stocks and then stocks outperform silver. Most importantly, a new secular bull market in silver began in early 2024, when the ratio broke above the green downtrend line that had been in effect since the early 2010s.
Now I want to zoom in on the gold-to-Dow ratio chart I showed at the beginning of this report to show you where it currently stands and why the secular bull market in gold, and thus the overall precious metals complex, remains firmly intact. Far from being in a new secular bear market, the weakness in the first half of 2026 was simply a normal correction along the way to much higher prices in the decade ahead.
As illustrated in the chart below, a new secular bull market in gold and precious metals began in April 2024, when the gold-to-Dow ratio closed above the green downtrend line that had been in effect since 2011. That breakout marked the beginning of a new era of precious metals outperforming stocks, with a new gold uptrend line now forming beneath the ratio as it continues to advance.
From the start of the bull market in early 2024 through January 2026, gold surged from roughly $2,000 an ounce to $5,600, a gain of 180% in less than two years. That is a scorching performance for gold, which, as a reminder, is a safe-haven asset, not a hot tech stock. During that same period, silver exploded from roughly $26 to $121, a staggering 365% gain, which is truly an outstanding performance.

Comments
Log in or sign up to join the conversation.