


The economically weighted ISM manufacturing + services indexes have become one of my favorite datapoints. In particular, in the past year, they have been an excellent dashboard for the state of the US economy as a whole, both as a coincident and short leading indicator. Last summer, they accurately suggested that the economy was very close to recession, while since the beginning of this year, they have indicated improvement.
To recapitulate, services are about 75% of the economy and goods production the remaining 25%; hence, their weighting. To reduce noise and amplify the signal, for forecasting purposes, I use the three-month moving average of the weighted average. One caveat is that these are diffusion indexes, which tell us how widespread a trend is rather than its net value.
Last Wednesday, we got the manufacturing report, which was very positive for new orders, and for the first time in many months showed that jobs were not contracting, and price increases were less widespread than before. This morning’s ISM services report was similar, in general showing a slightly weakening but still quite positive sector. [Note: in all the graphs below, the manufacturing number is in blue, and the services number in gray].
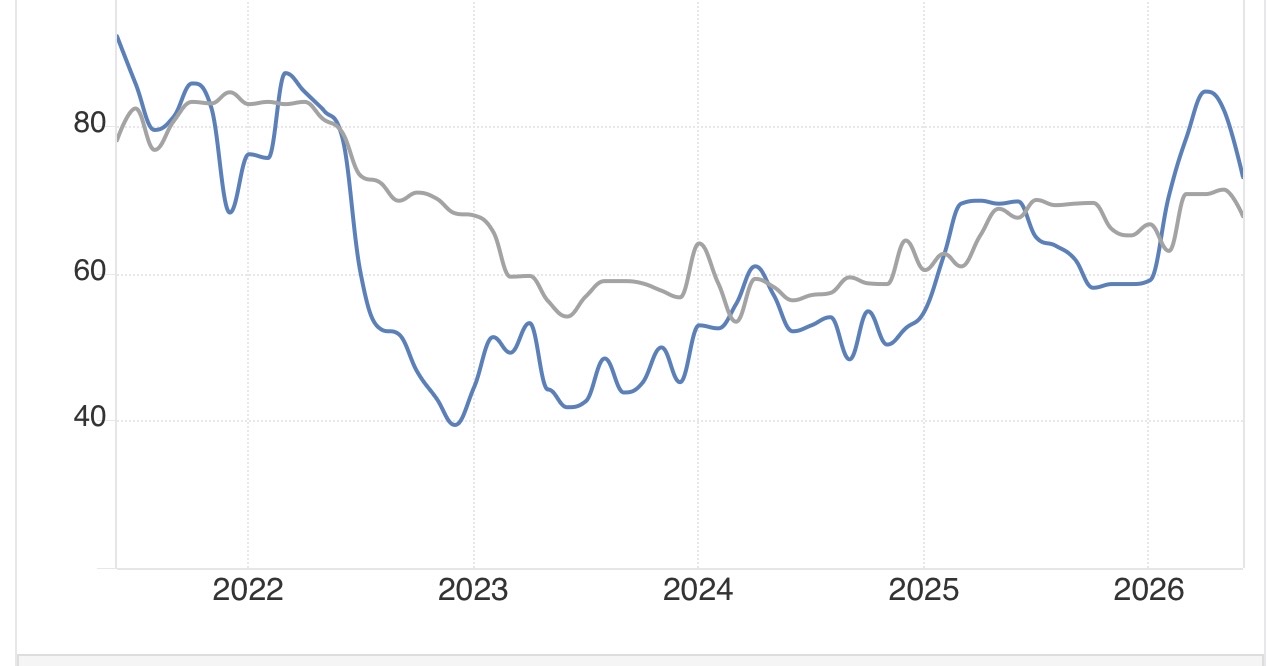
The headline services number declined -0.5 to 54.0. The three-month average was unchanged at 54.0 as well. This compares with the manufacturing three-month average of 53.3. Thus, the weighted average is 53.8:
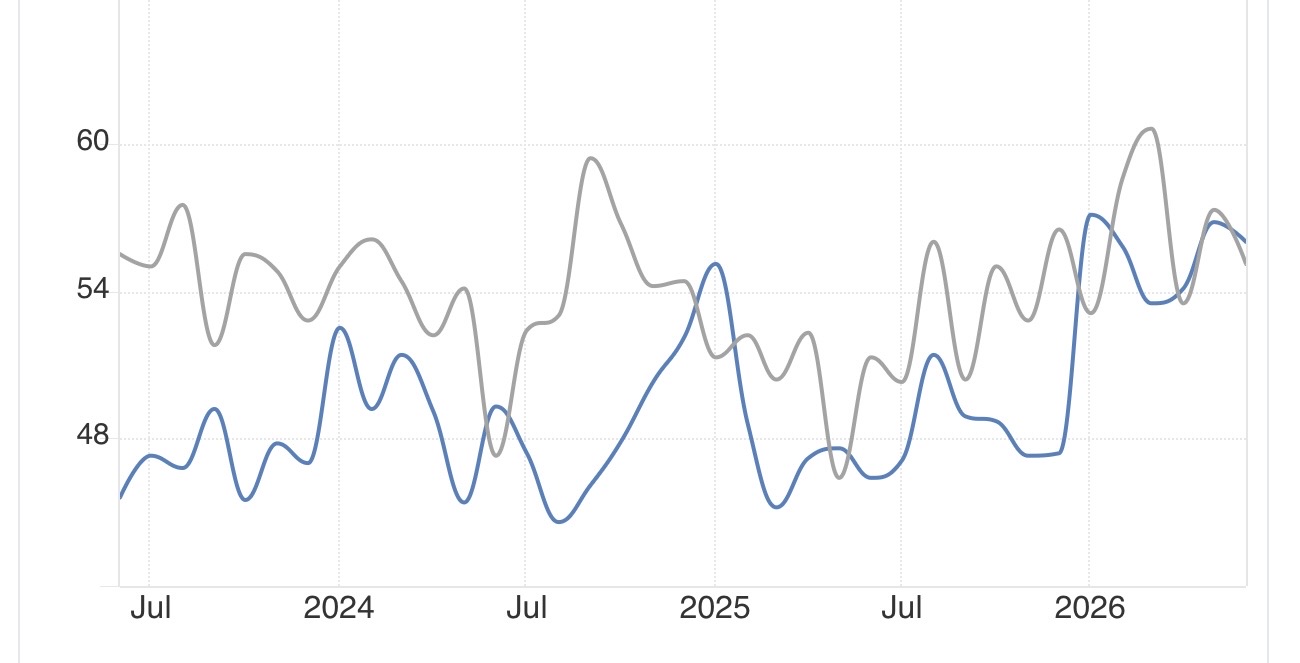
New orders also declined -2.2 to 55.1, and the three-month average declined -1.8 to 55.3. Since the manufacturing average was 55.6, the weighted average is 55.4:
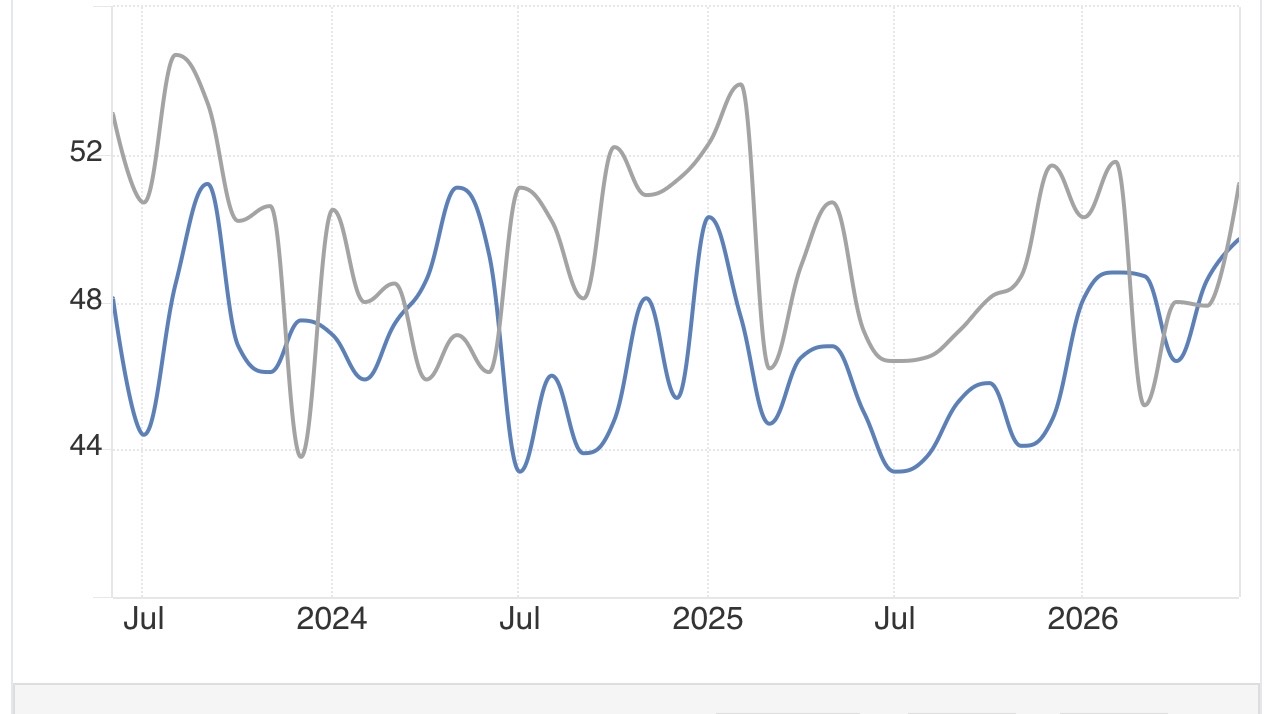
If new orders decelerated, there was more good news about employment, the index of which rose 3.3 to 51.2, returning to expansion after several months of contraction. The three-month average also rose from 3.0 to 50.0. Since manufacturing rose to 49.7, and its three-month average was 48.2, the weighted average rose to 50.5 - the first positive number in four months:
Finally, as with manufacturing, inflationary pressures in services abated somewhat in June, as the prices paid component declined -3.6 to 67.7. The three-month average declined -1.3 to 69.6. Since the three-month average for manufacturing was 79.9, the economically weighted average declined -4.4 to 69.2:
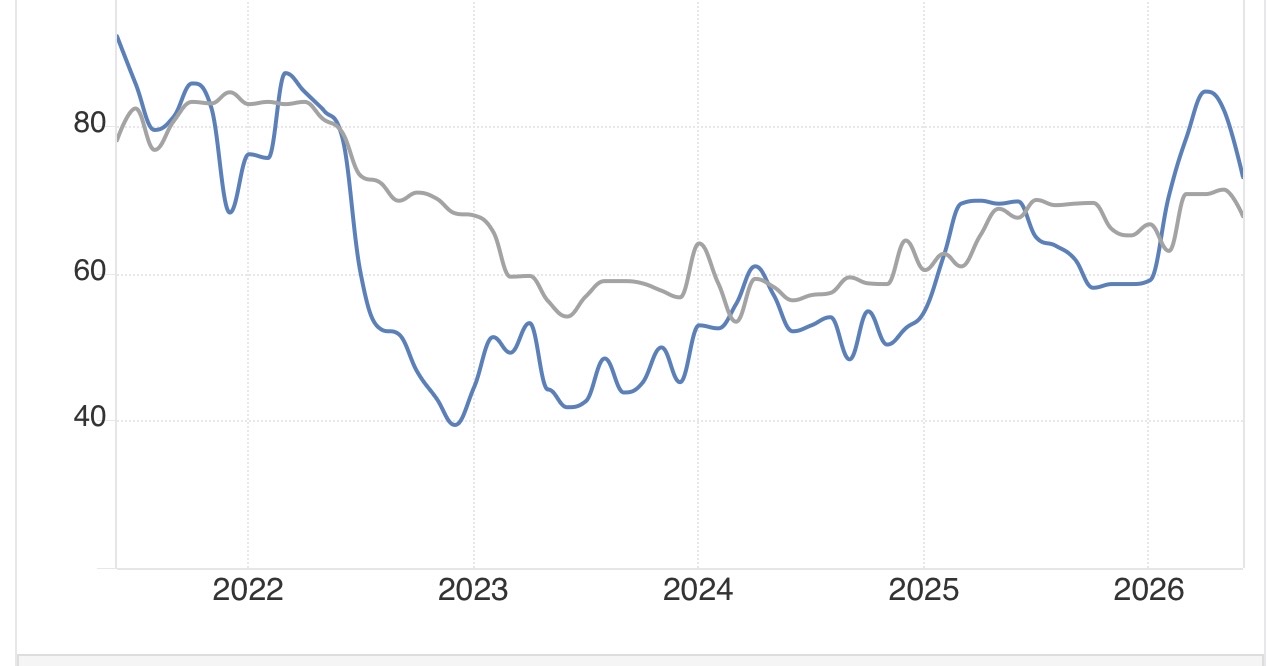
Note that the above graph, unlike the first three, goes back five years to show the comparison with the post-pandemic inflationary spike.
Let’s recapitulate:
Both the headline and new orders components of the services index showed deceleration, but were solidly positive, as was the economically weighted manufacturing+services average.
The employment situation has improved from contraction to equipoise or slight gains
The prices component still shows widespread inflationary pressures at the producer level, but not as strong as in the previous few months.
The economically weighted ISM averages indicate the economy is expanding now, and can be expected to continue expanding for at least a few more months, but that the inflationary spike, primarily driven by the Iran war, but also the computer chip shortage, continues to be a serious problem.



Comments
Log in or sign up to join the conversation.