


As per usual, my focus on the GDP report is less on the topline numbers than on the two leading indicators - real spending on housing and proprietors’ income - contained therein. And to get to the point, the upshot is ‘meh.’
Let’s get the headlines out of the way first. Nominally GDP increased 7.9% annualized in the Q2, but since the GDP deflator increased 5.7%, real GDP (blue) increased only 1.5% annualized, which is relatively weak compared with the past few years. On the other hand, “core” real GDP, i.e., real final sales to domestic purchasers (red) increased a very strong 3.7%. Here’s what the quarterly real gains look like over the past four years:
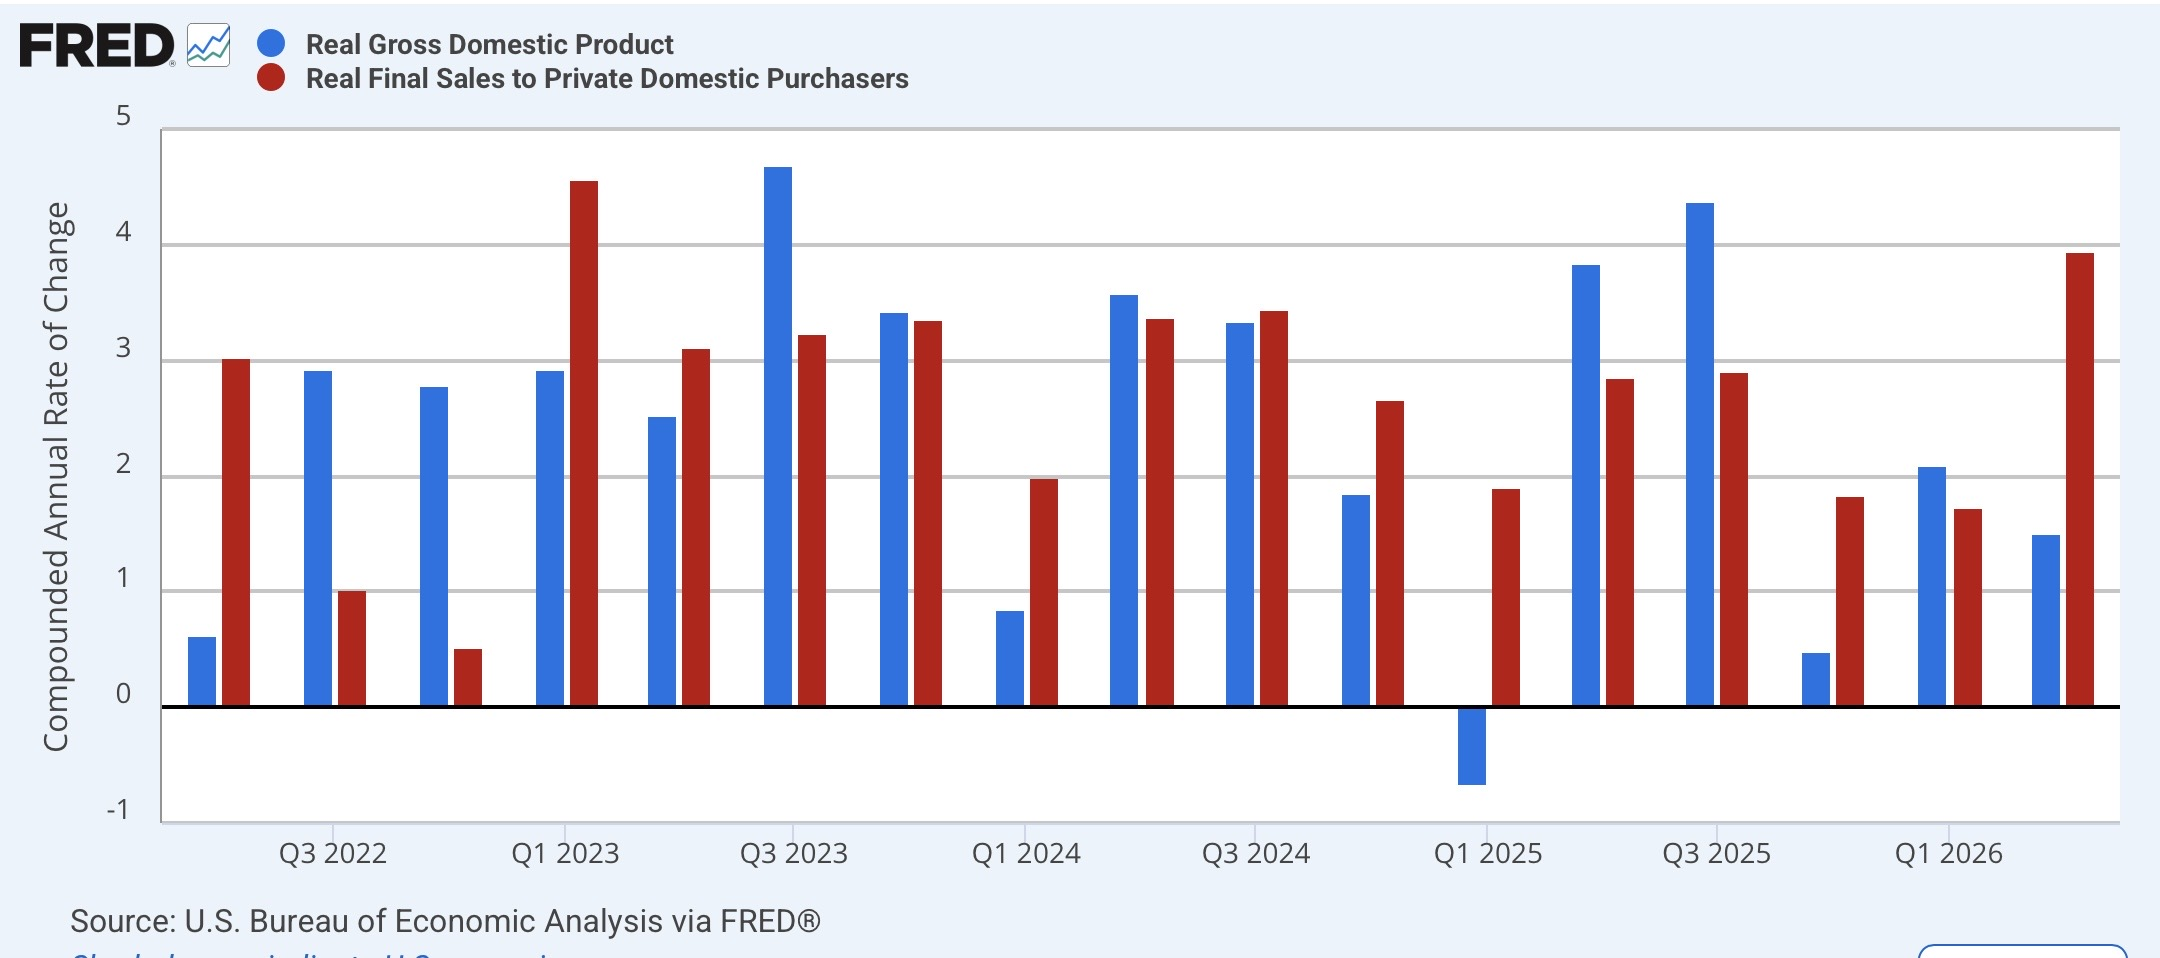
The difference between the two was due to a very large depletion of inventories:
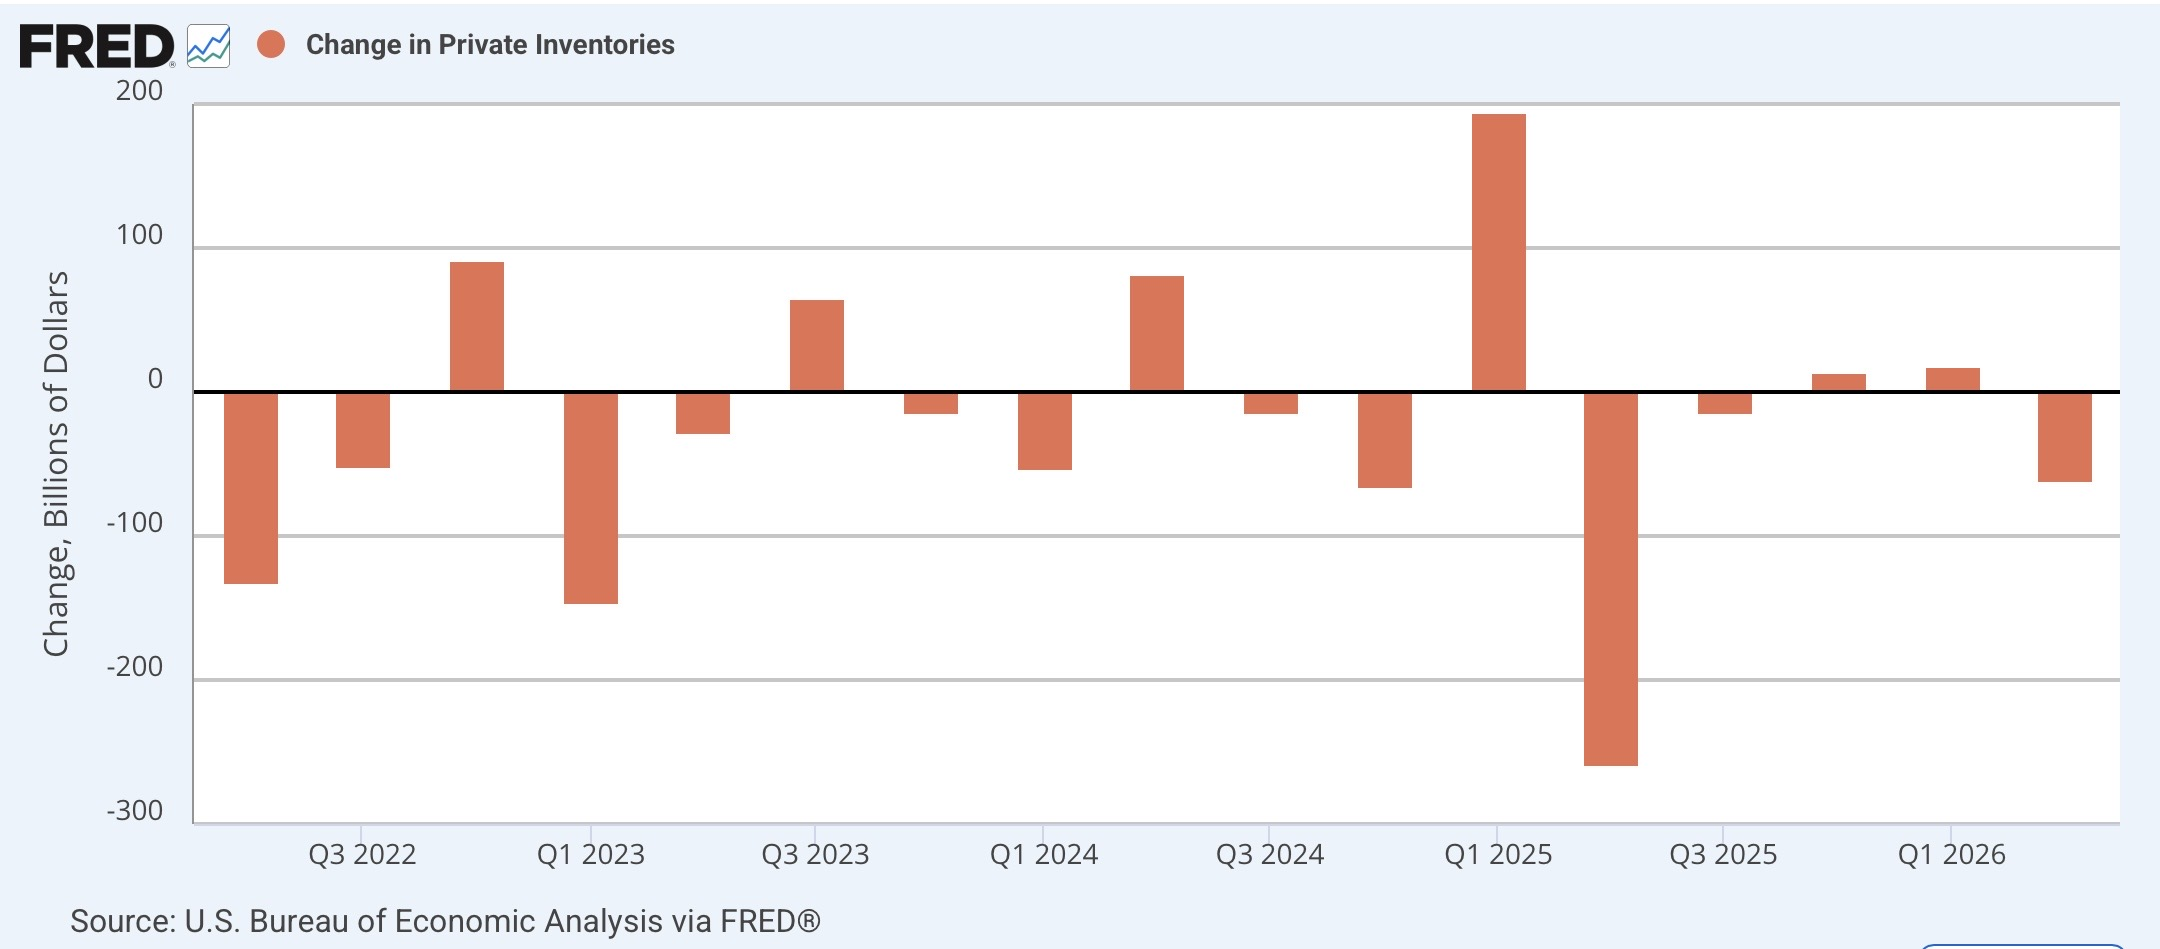
In other words, relatively less product made, relatively more out of inventory and sold.
Here’s what the YoY% change in real GDP and real final sales look like over the same period:
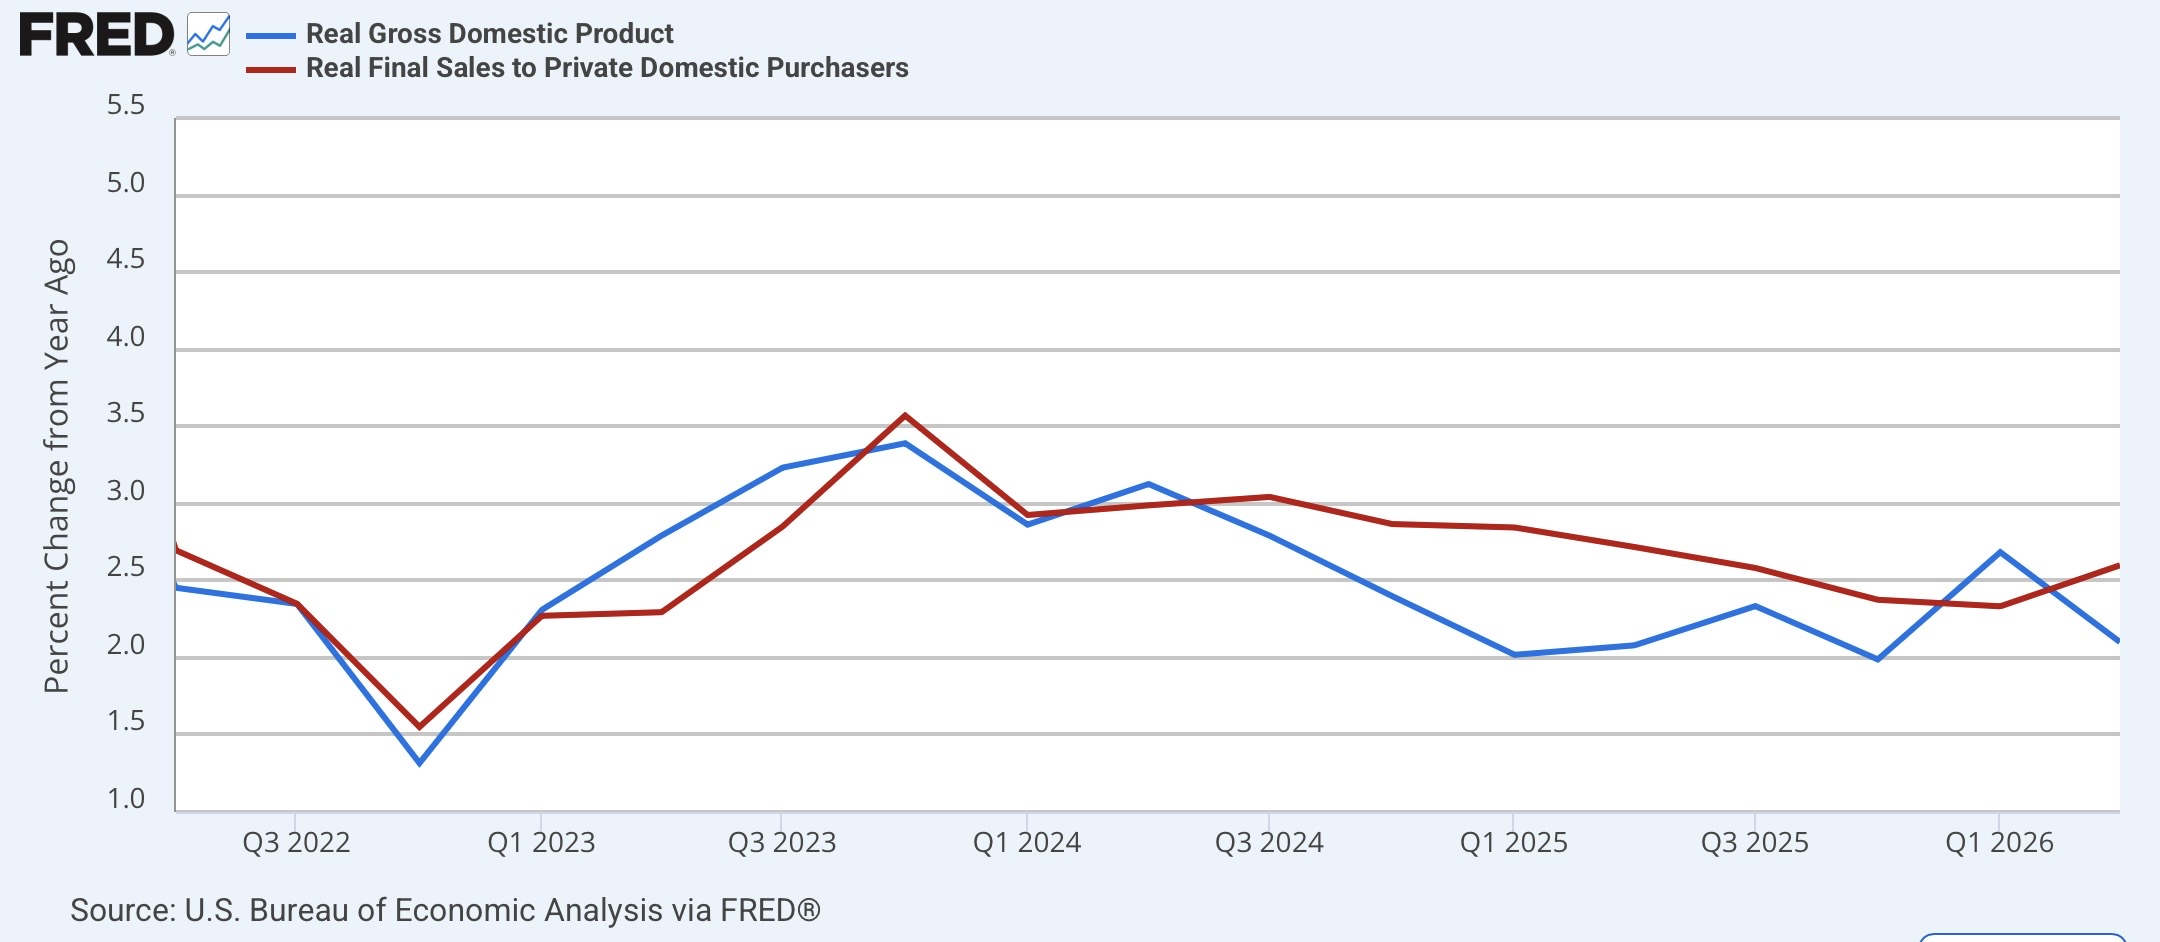
For all of the chaos coming out of Washington, this almost looks like an economy on cruise control.
But for some information about what might be coming down the road, vs. what happened this past spring, let’s look at out two long leading indicators.
Real private residential fixed investment, a proxy for housing, increased 1.2% in the quarter, which is positive:
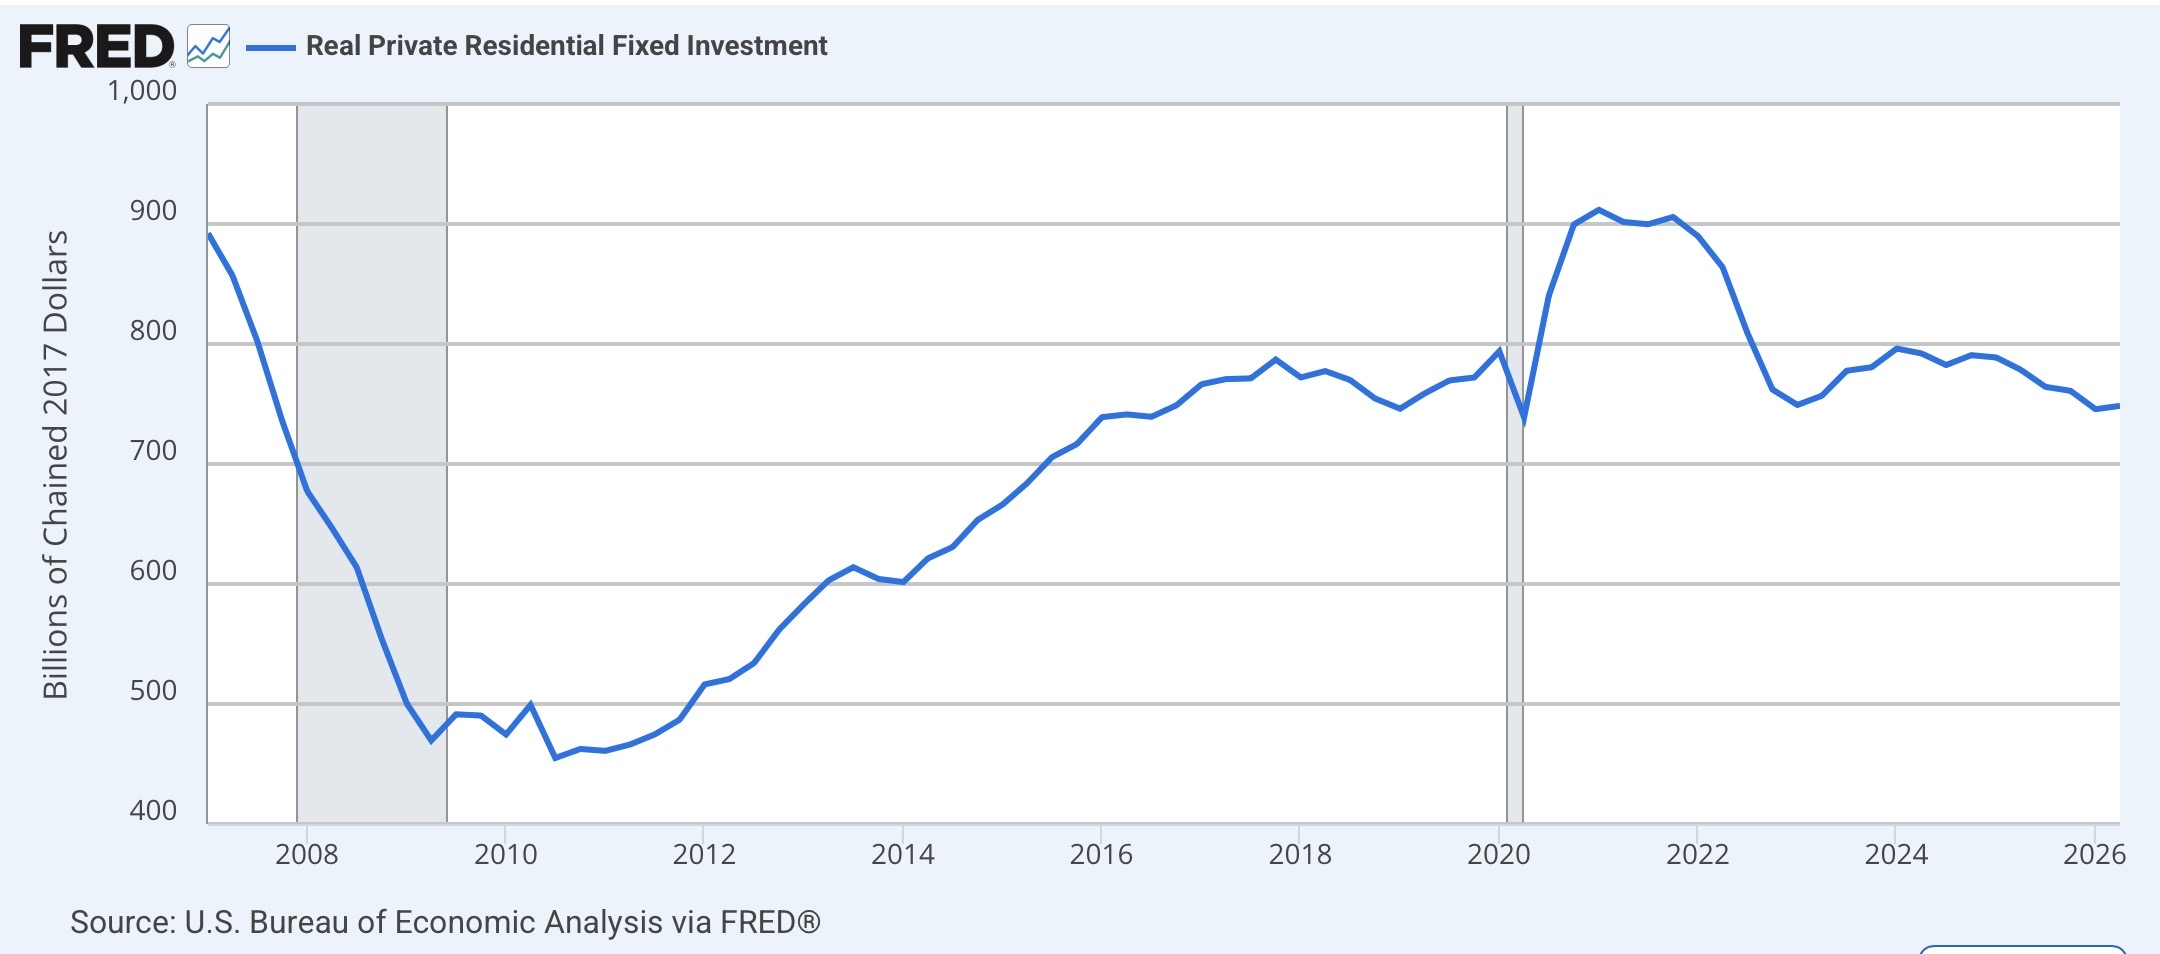
But the real long leading indicators is the above metric as a share of GDP, and so measured, that remained constant at 3.1%:
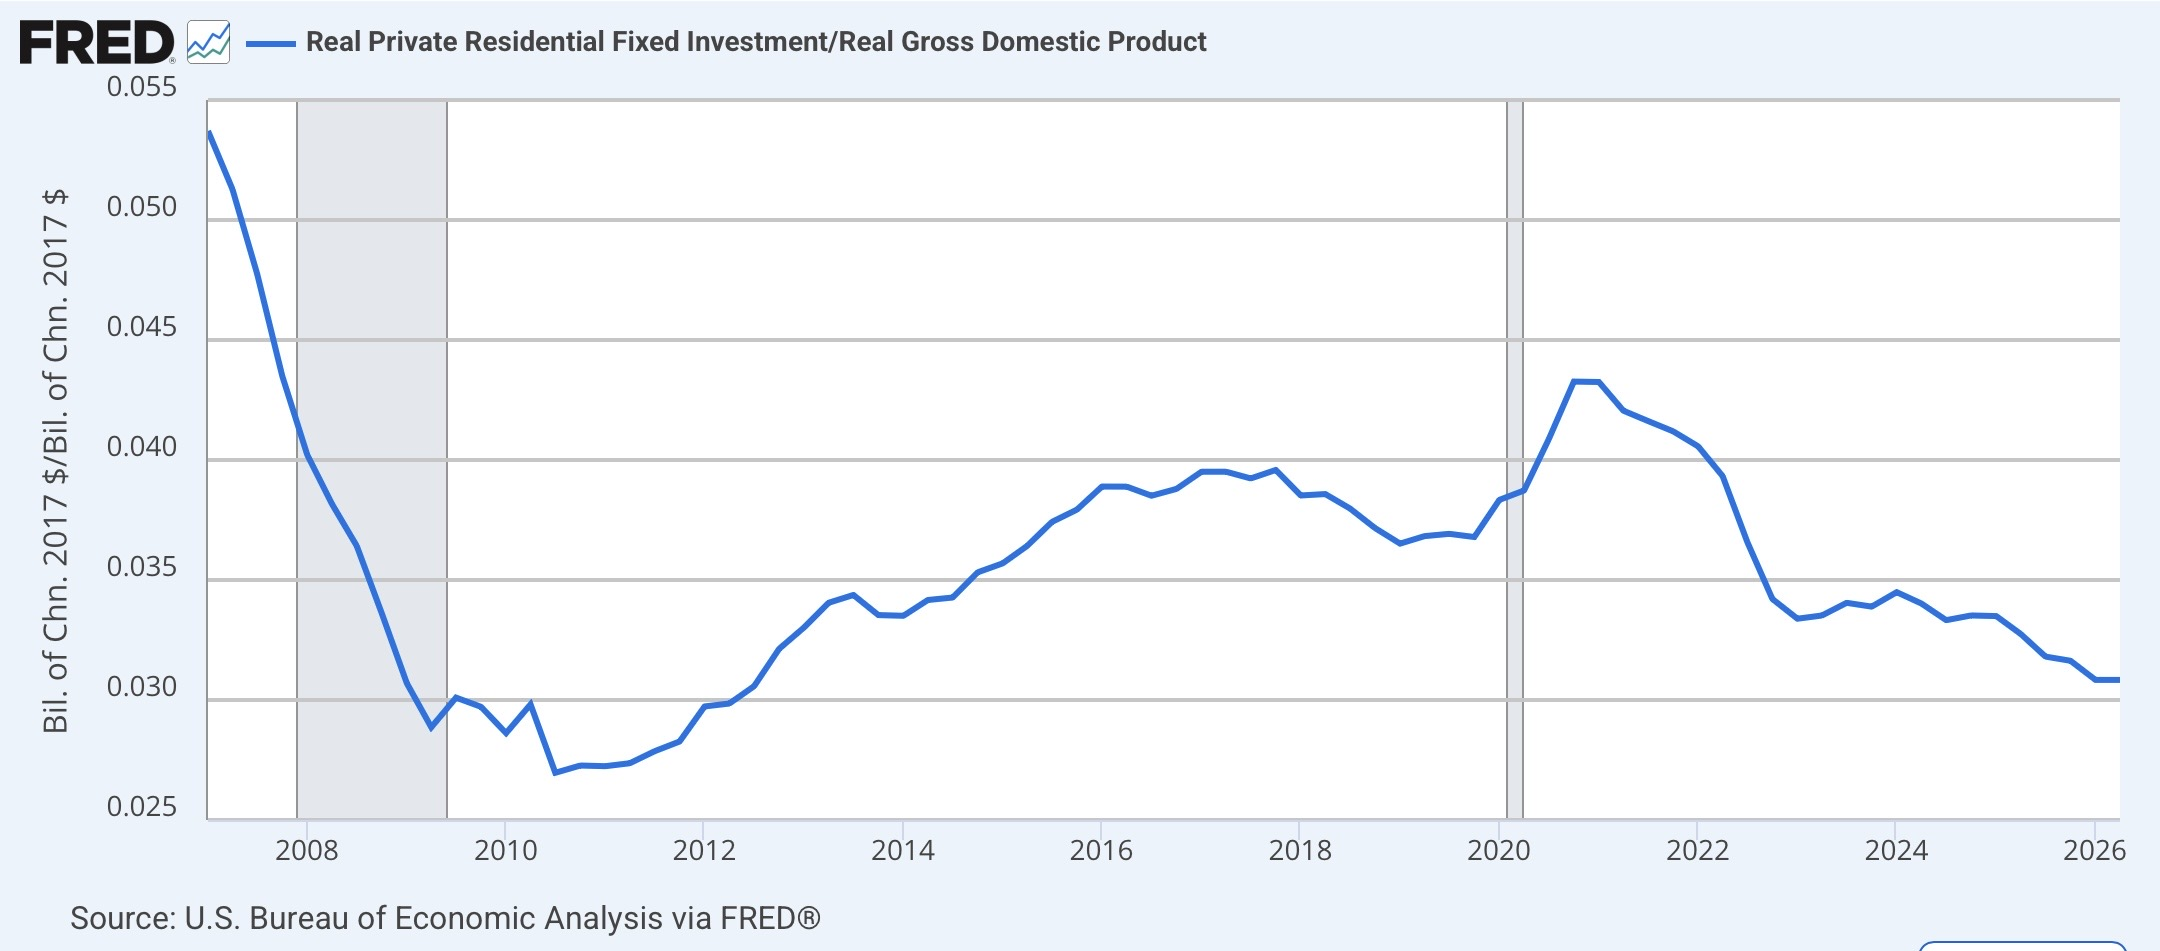
In other words, neutral. It’s worth noting, though, that as suggested in the far left of the above graph, this metric tends to bottom at or even a little before the end of recessions. So if anything, this adds a little bit to the evidence that the economy might be on a rebound.
The other long leading indicator is corporate profits deflated by unit labor cost. But since neither of those will be reported for one more month, we can make use of the placeholder of proprietors’ income, which is almost as leading. And this income rose 1.2% nominally in Q2 (blue), a fairly strong advance to a new high:
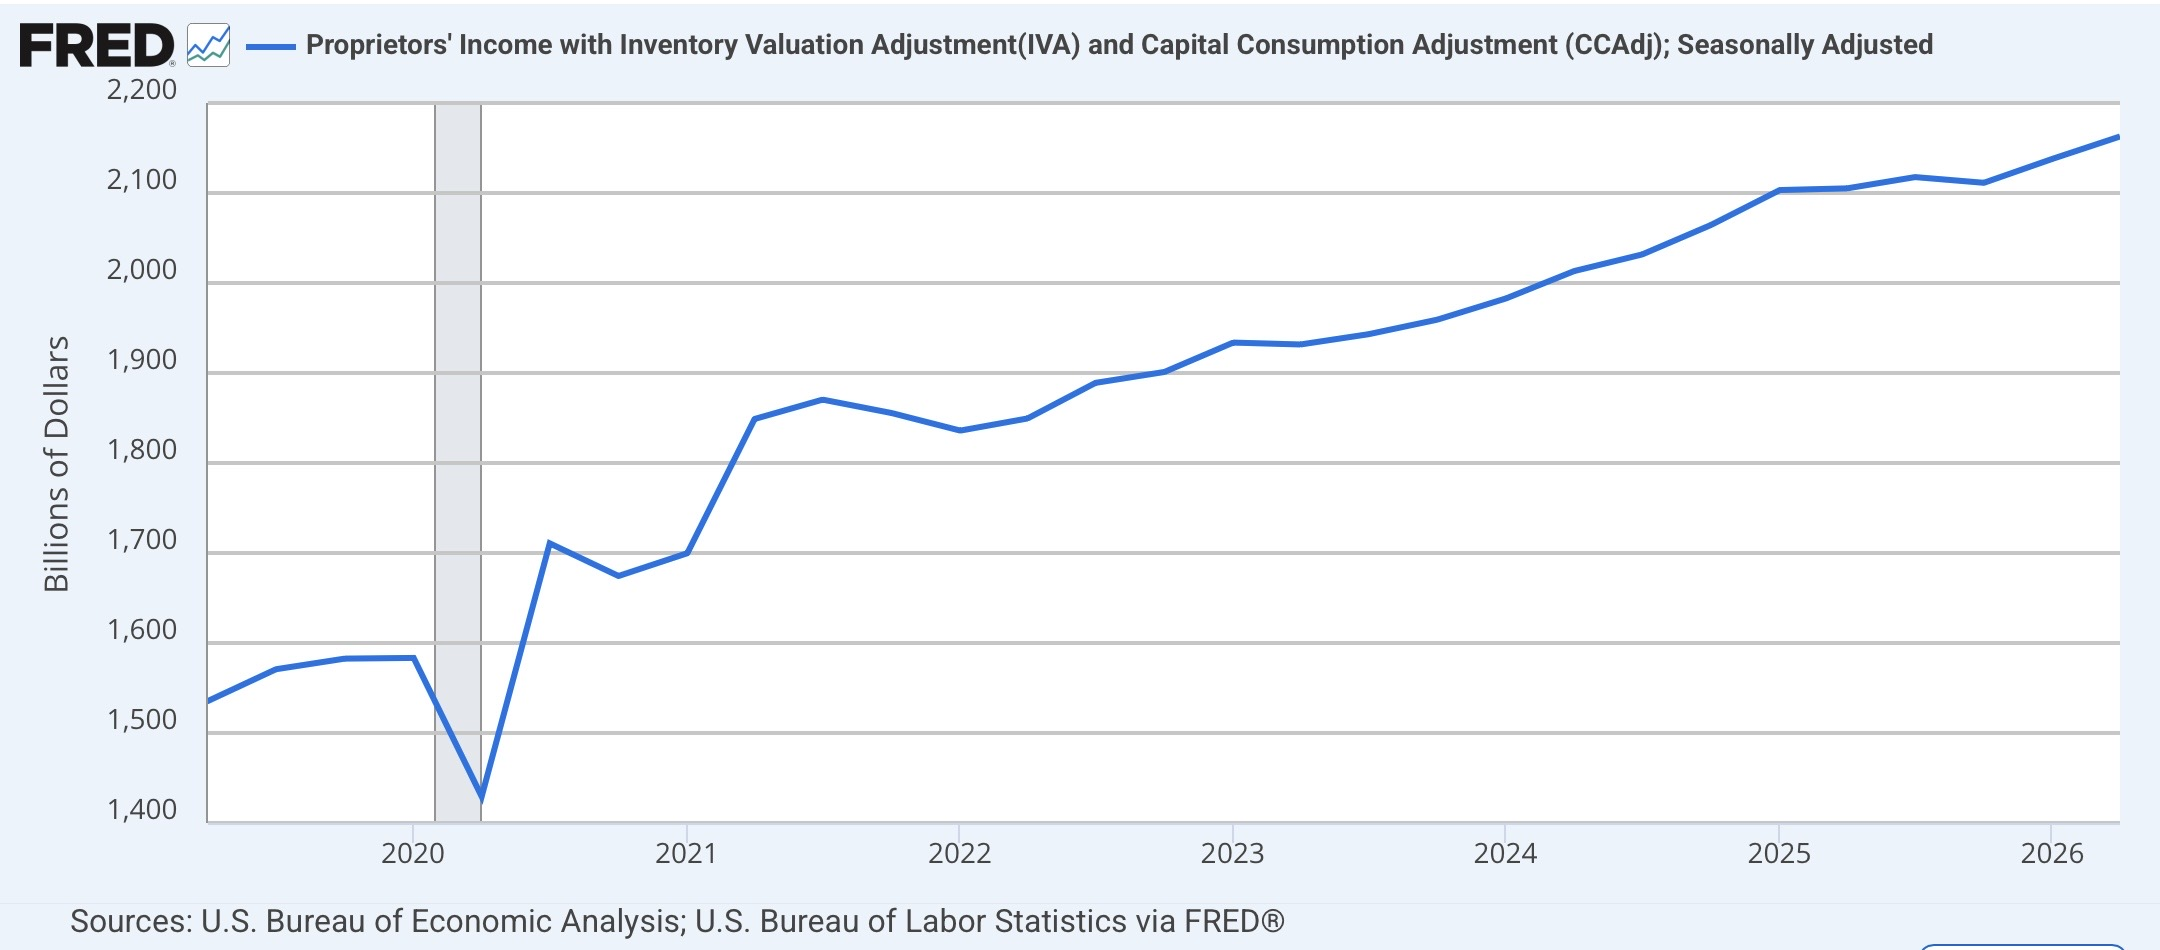
Since in the past few years unit labor costs (gold) have risen on average about 0.5% per quarter, it is almost certain that deflated proprietors’ income made a new high as well:
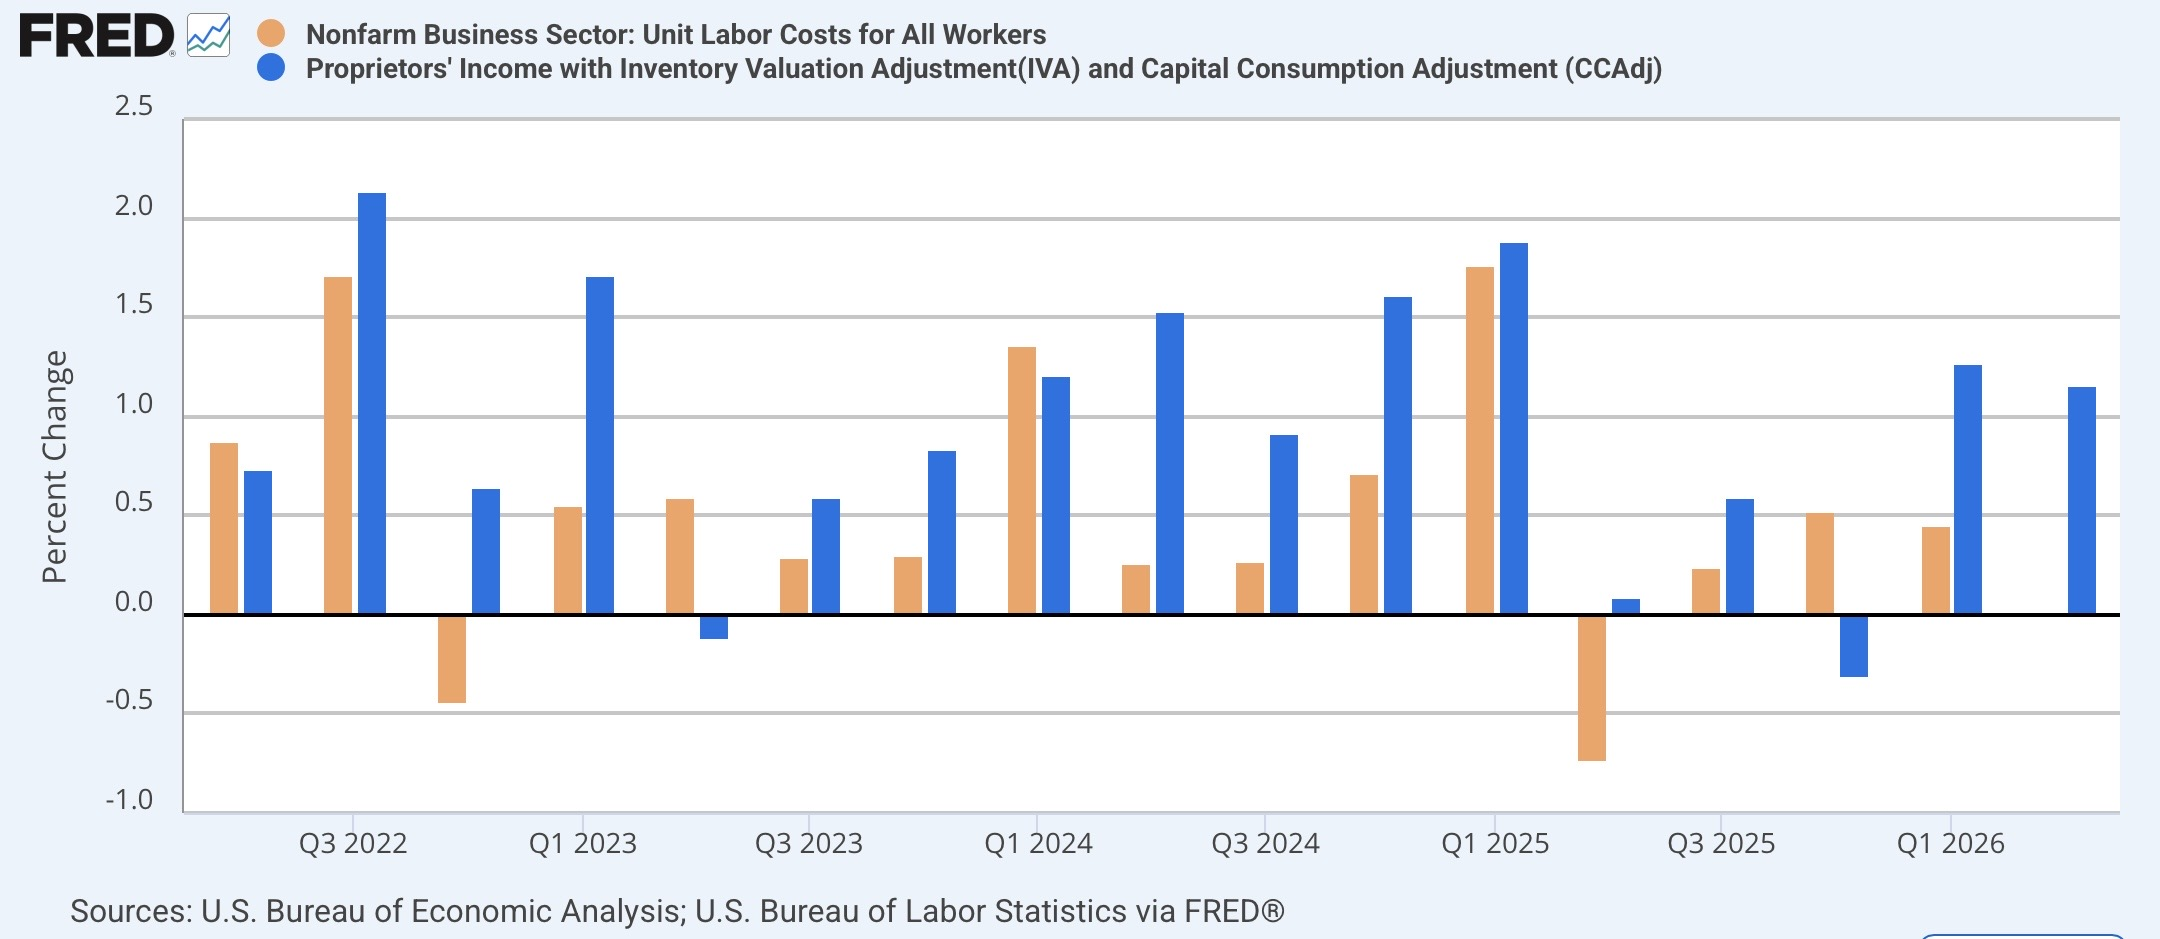
Recently I’ve indicated an added emphasis on the role that the increase or decrease in corporate profits have as a long leading indicator for the economy. Taken together, we have one ‘meh’ indicator and one that remains positive, suggesting that left to its own devices the economy would be likely to remain in expansion for another year.



Comments
Log in or sign up to join the conversation.