


As per usual, we start out the month with the ISM manufacturing report (for July) and the construction report (for June). The first was strong; the second was dismal.
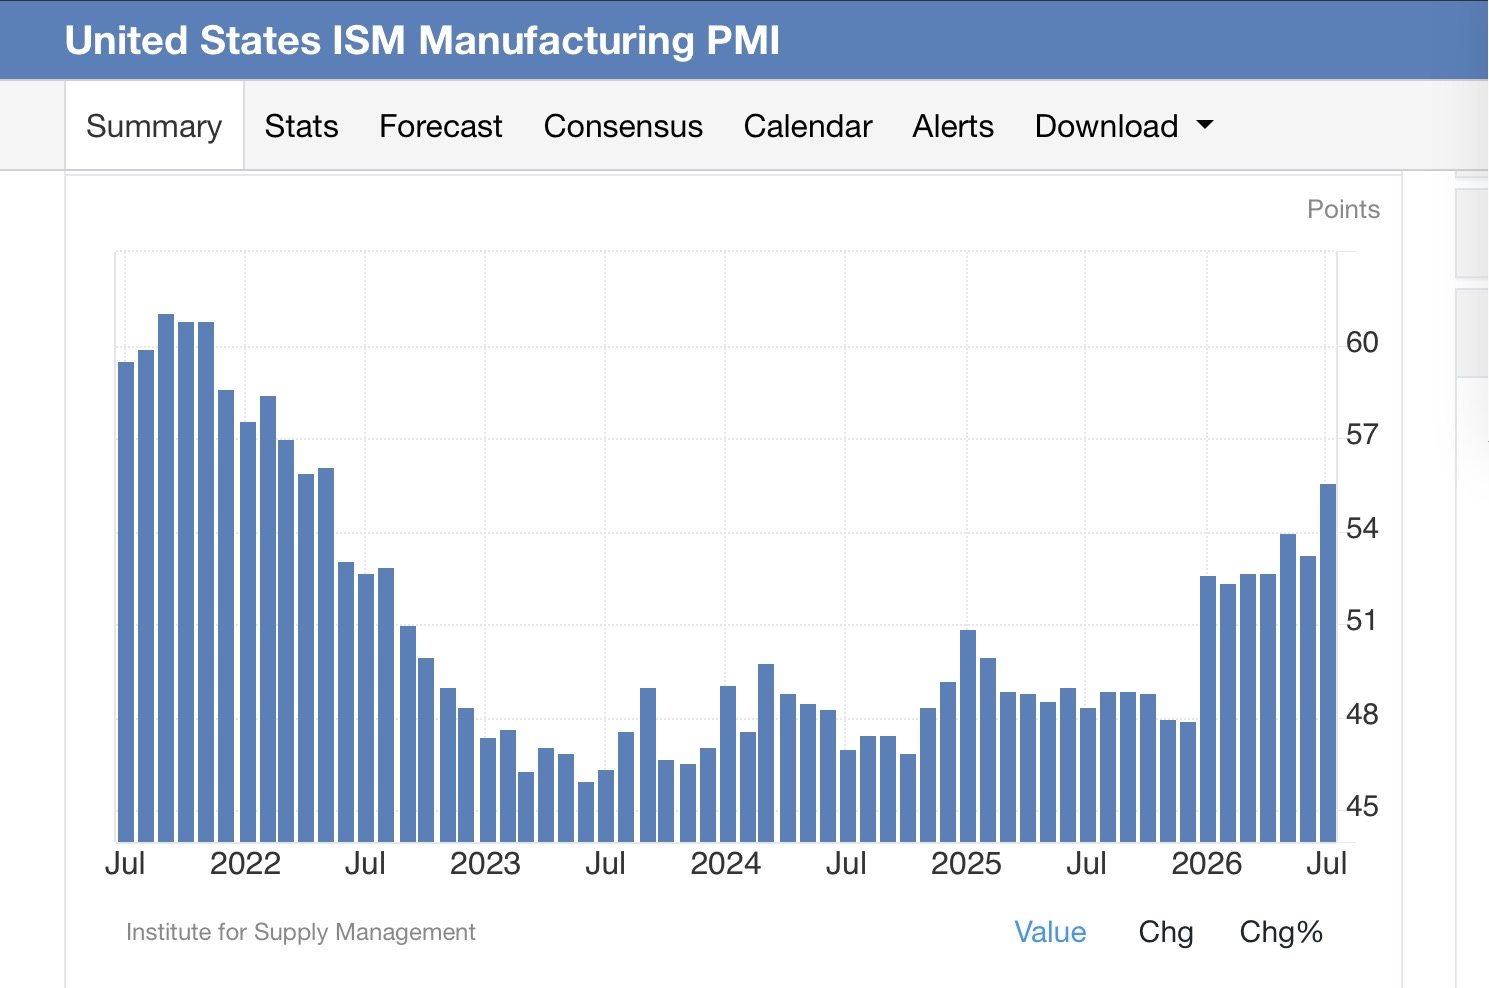
Let’s start with the (mainly) good news first. The headline number for the ISM manufacturing report was 55.6 (any number above 50 signifying expansion), the highest since 2022. For forecasting purposes, I average the last three months, which comes out to 54.3:
The more leading new orders subindex rose to 56.7, and the three-month average was 56.5:
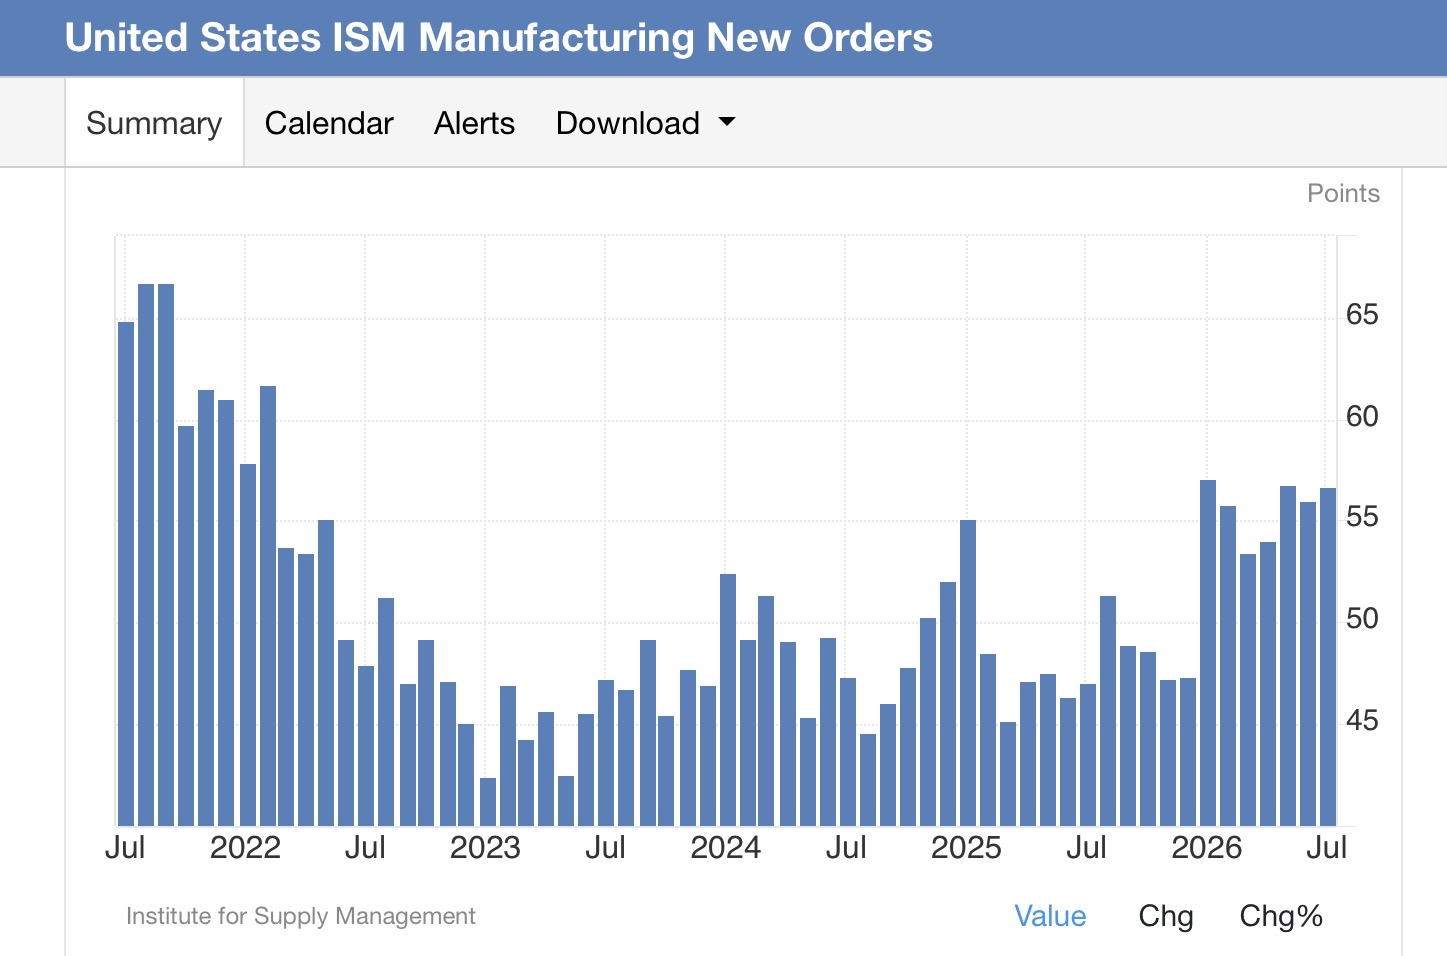
Both the headline and new orders numbers indicate a strong expansion, which can be expected to continue at least a few more months.
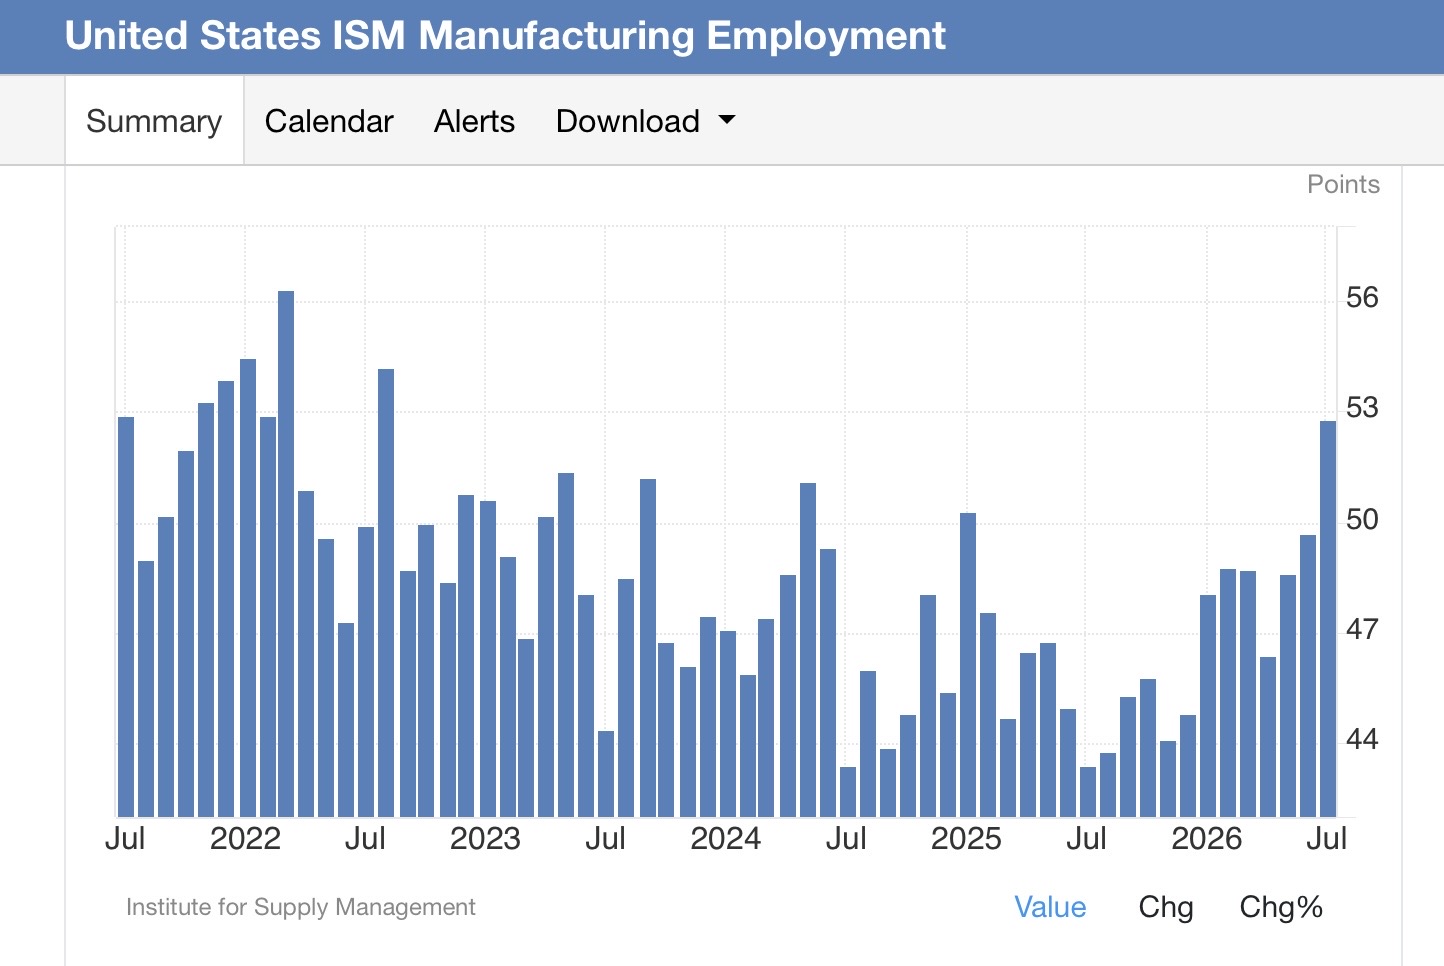
The good news didn’t stop there, because employment rose into positive territory at 52.8. The three-month average also crossed into expansion at 50.4:
The only aspect of the data which was negative was the prices paid subindex, which, while it declined to 71.1, still indicated very widespread price increases upstream. The three-month average was 75.4. These are readings very close to the post-pandemic inflationary peak:
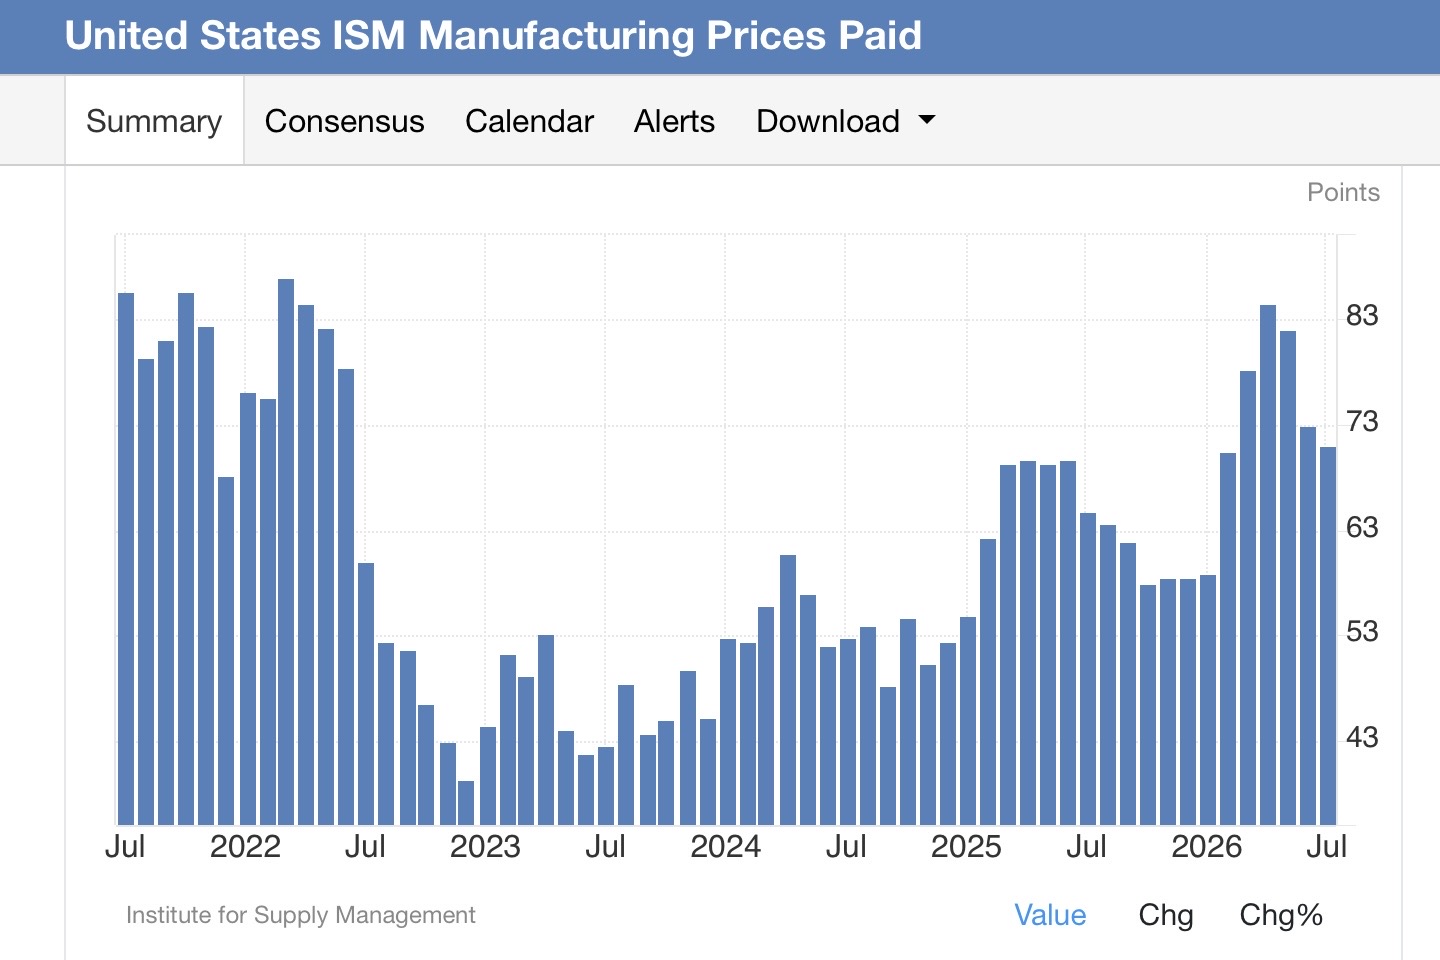
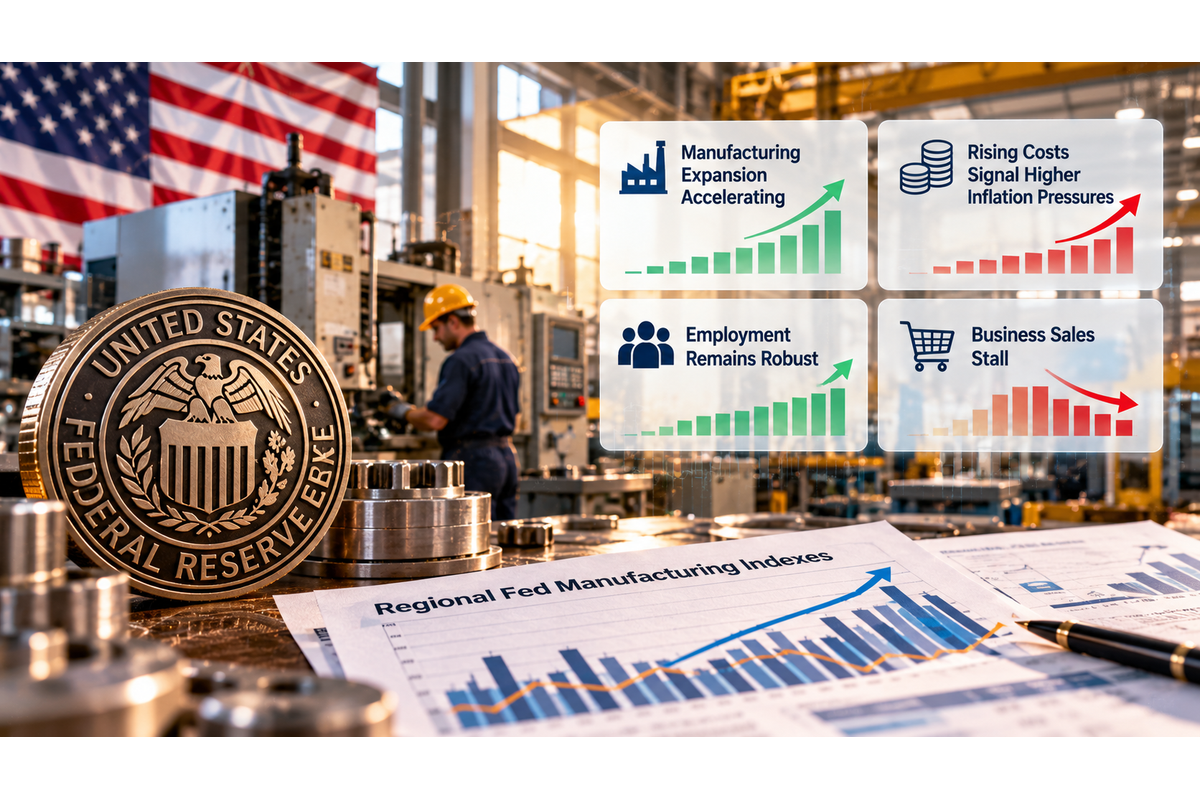
This is of a piece with the regional Fed reports and other manufacturing and production reports, which have shown a surprising rebound this year, but a strongly inflationary one. For forecasting purposes, I weigh manufacturing at 25%, and the other 75% from the ISM services report, which will be updated Wednesday. But that has been consistently positive all year. So again, the message is: positive, but with a strong inflationary current.
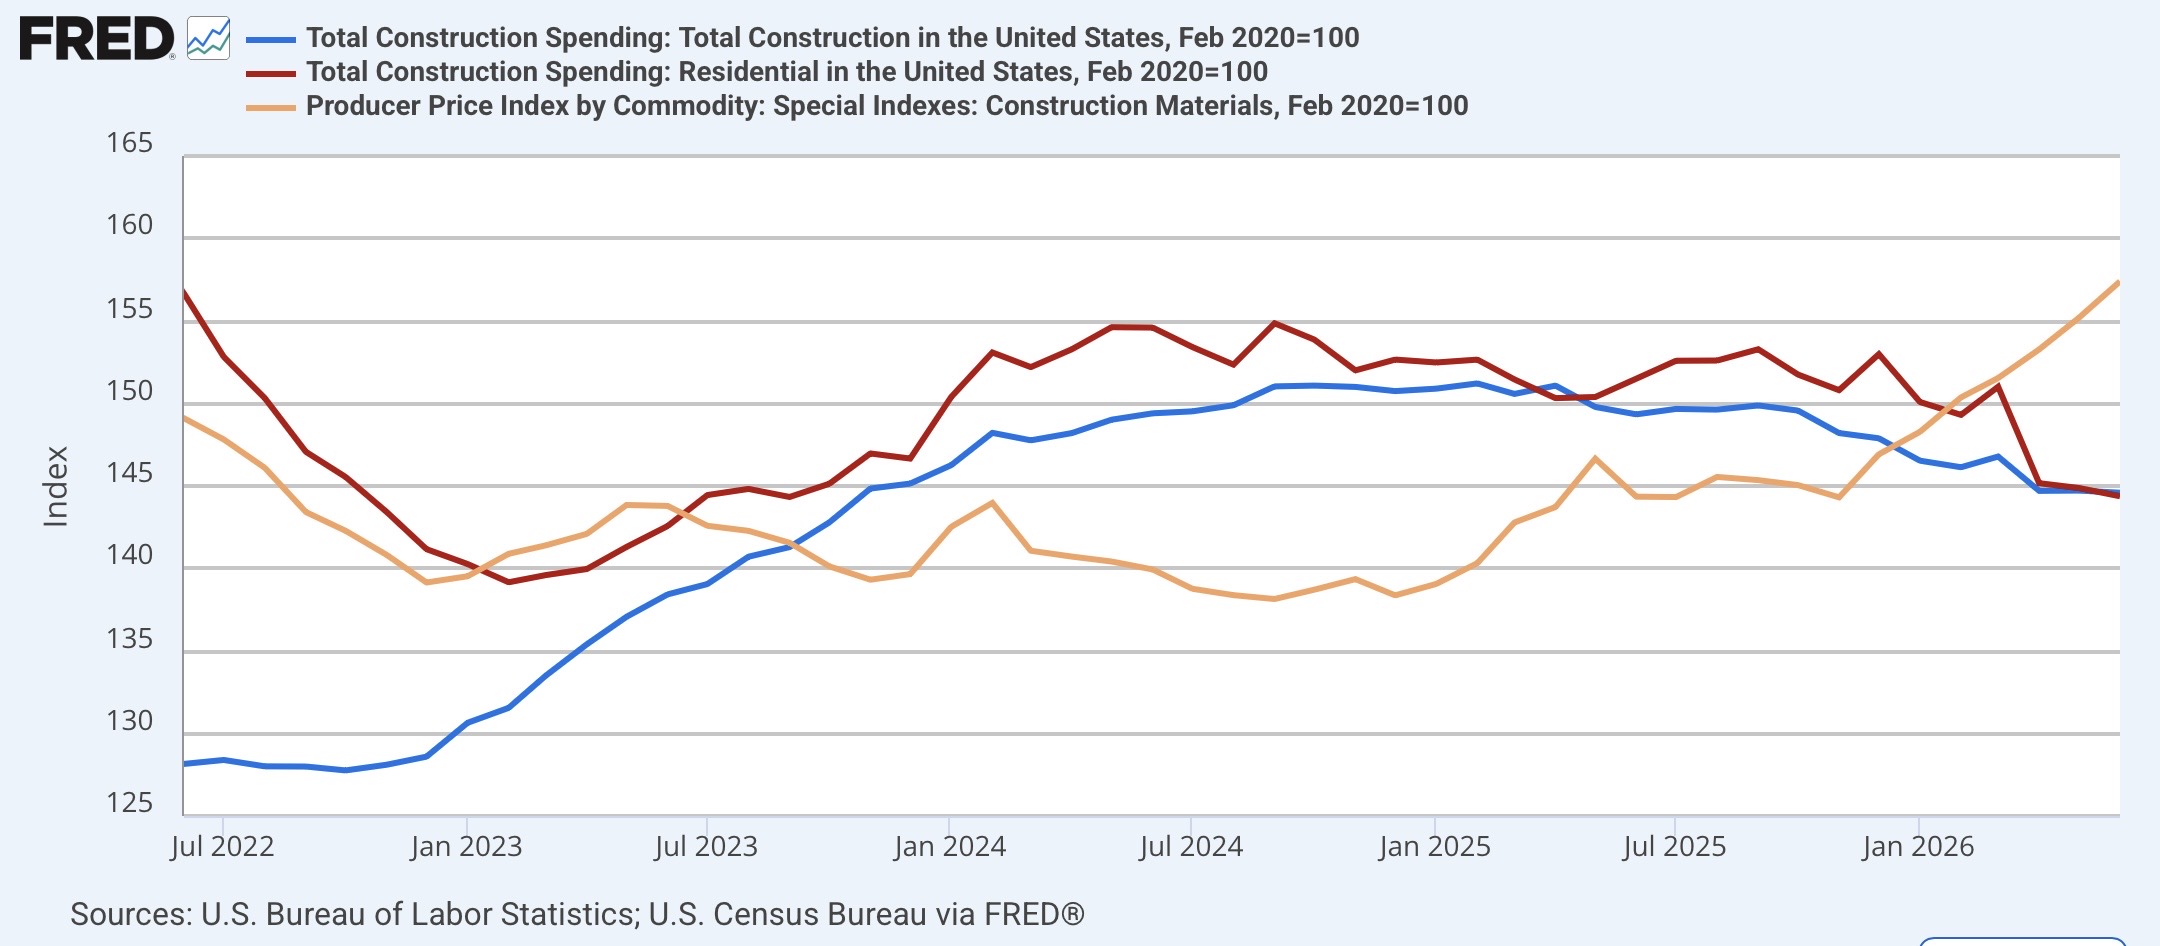
But if manufacturing was good, the construction spending report was if anything, recessionary. Total construction (blue in the graph below) declined -0.1% for the month, and is down -3.2% YoY. The more leading residential construction sector (red) declined -0.3% for the month, and is down -4.7% YoY. What makes these numbers worse is that they are nominal. The price of construction materials (gold) rose 1.4% in July and was up 9.0% YoY. The below graph norms all three to 100 just before the pandemic for easy comparison:
And here is a look at the YoY% change in both total and residential construction spending:
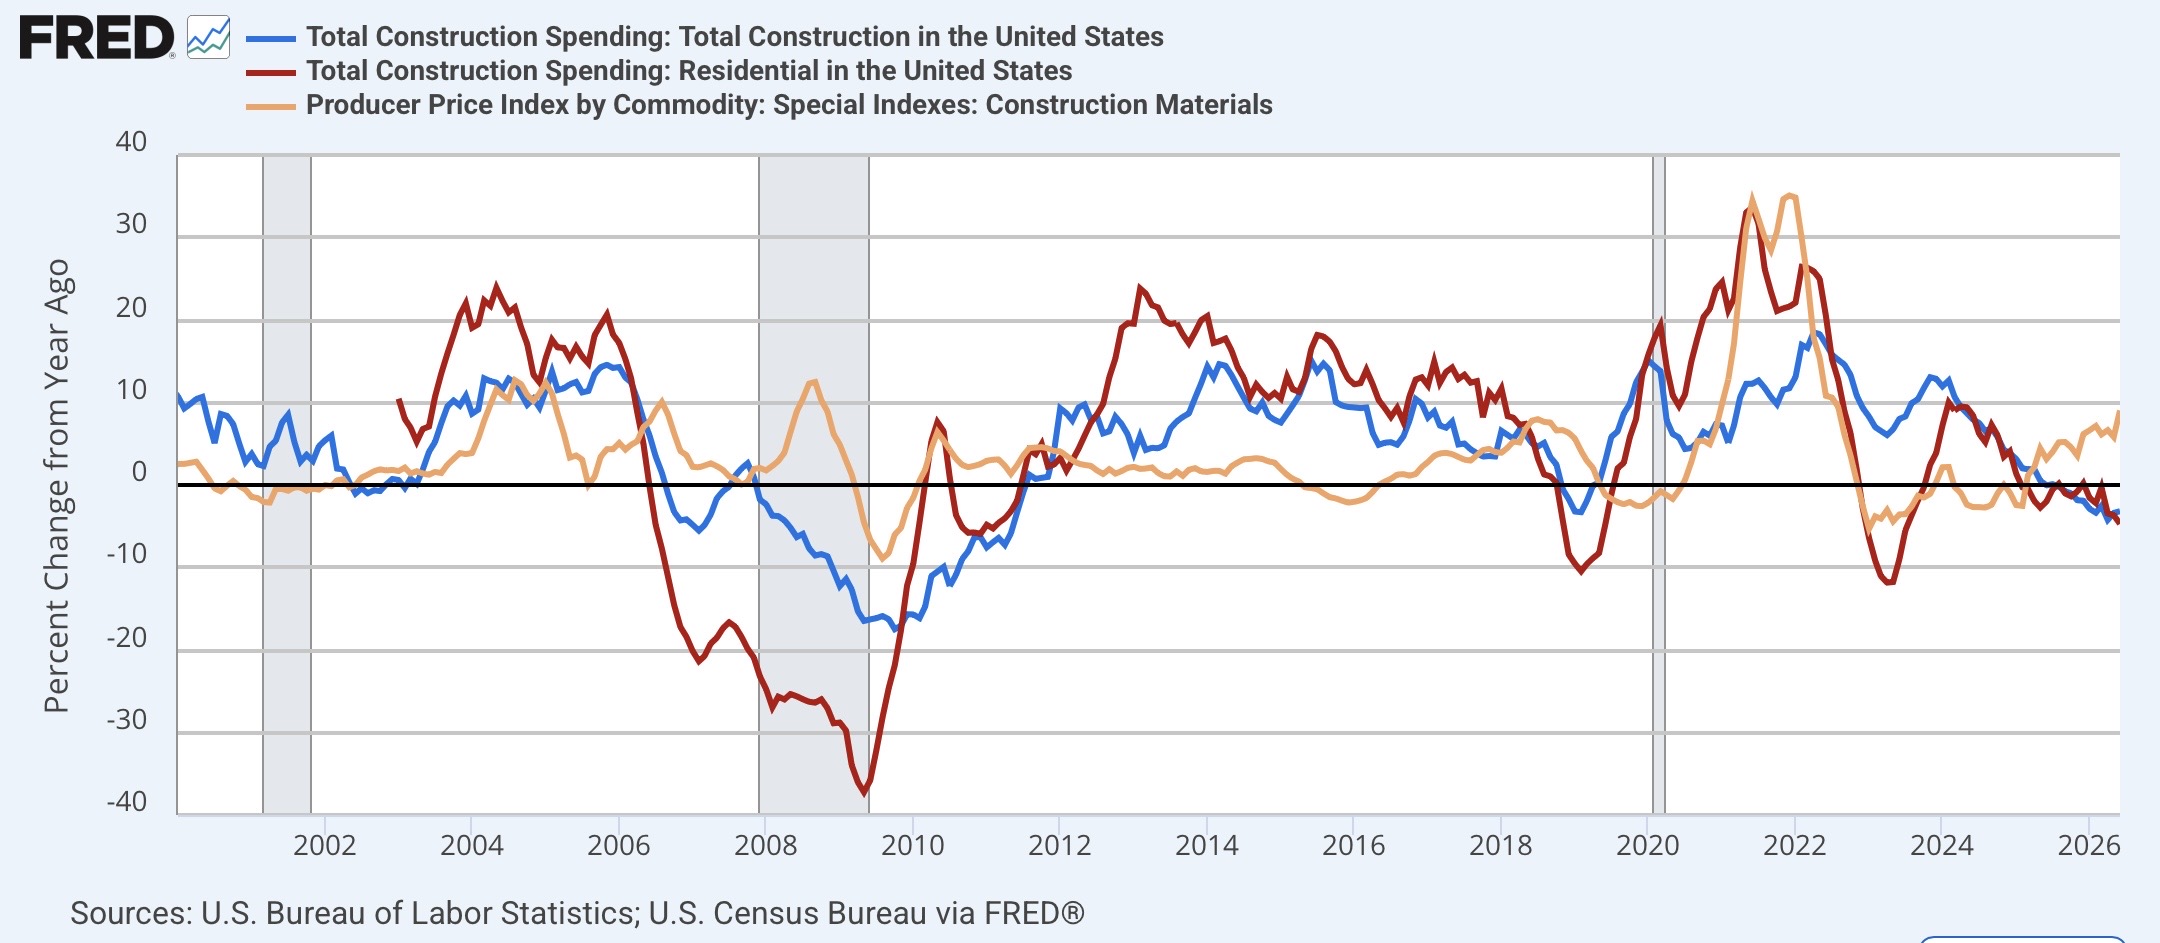
Quite simply, both are recessionary, especially when coupled with rising materials prices, as was the case in 2006 but not in 2019. Of course, housing has been in recessionary territory for over a year - without a recession having occurred.
The dismal news continued in manufacturing construction spending as well, down -1.2% for the month and down -31% from its September 2024 peak:
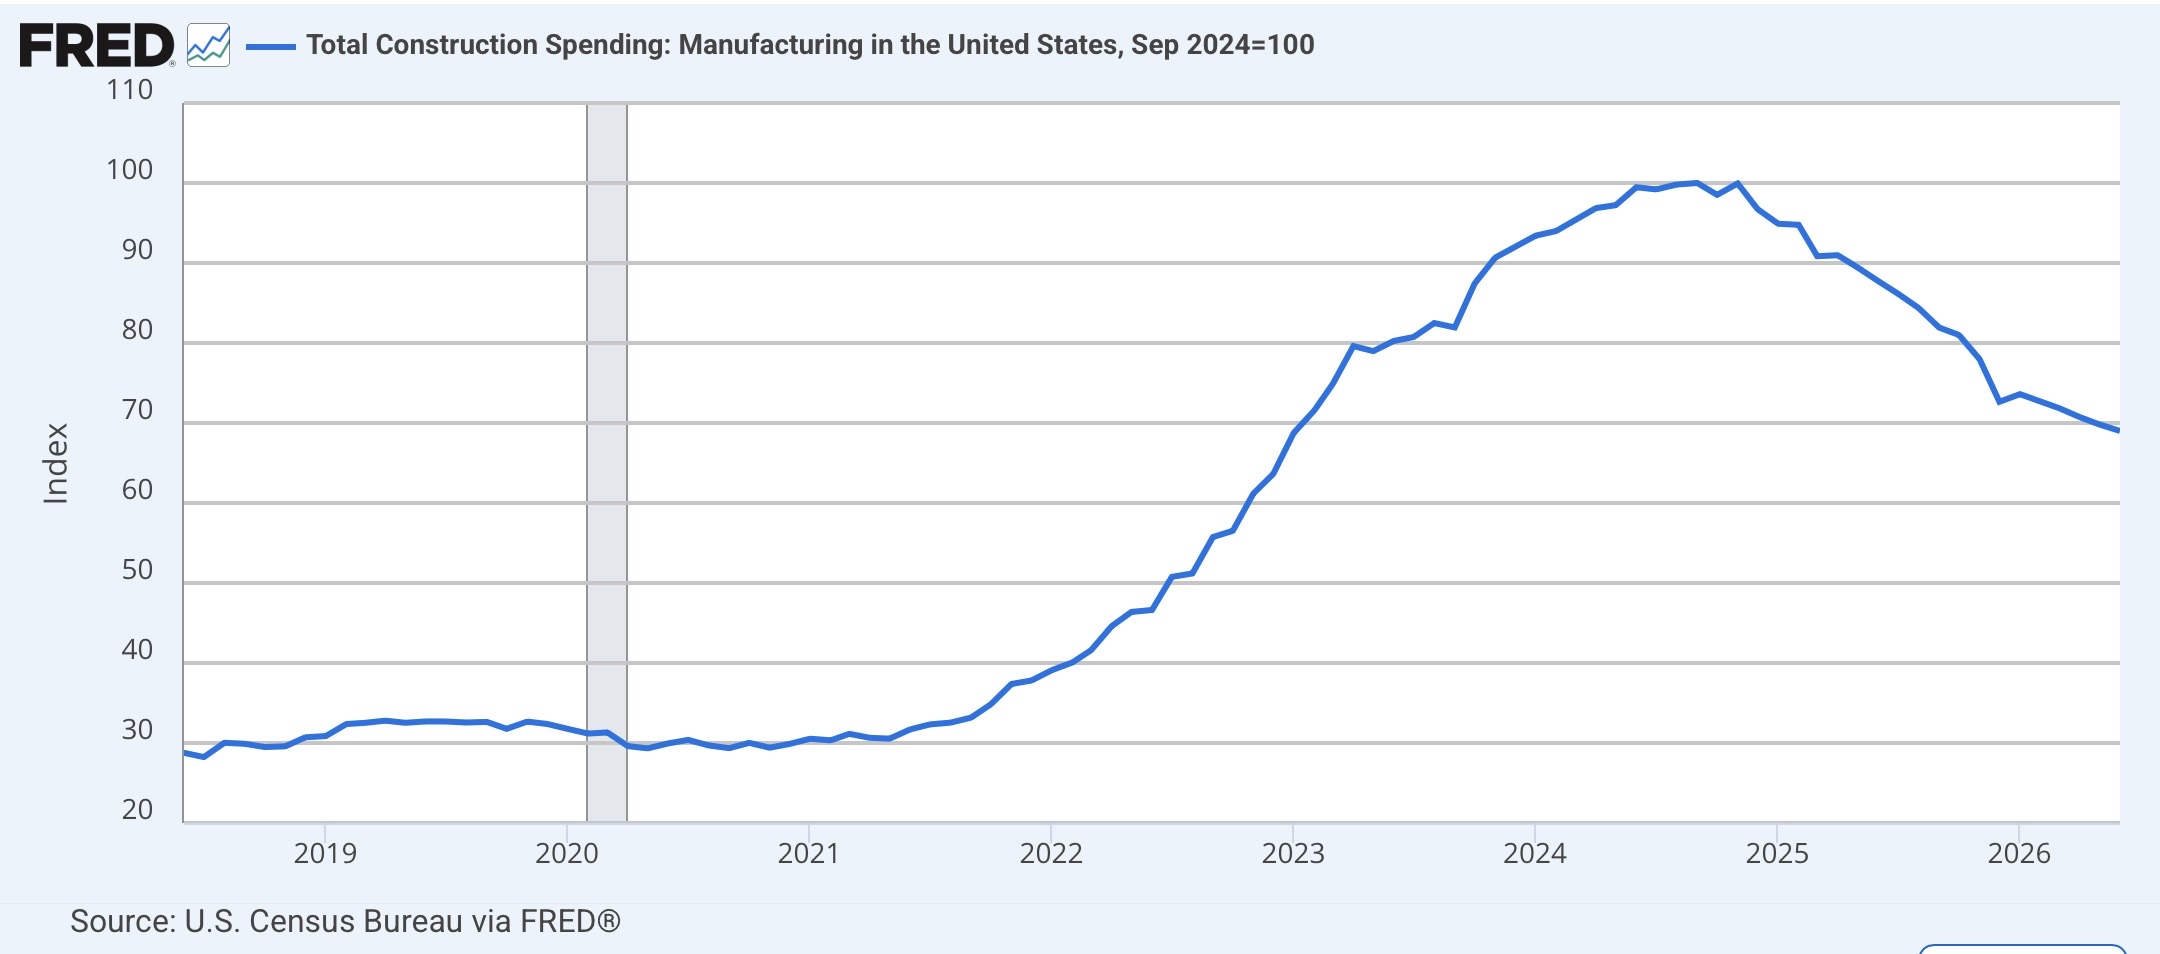
The only reason this isn’t recessionary is that the building of factories isn’t a big enough part of the economy anymore to be crucial.
Finally, here is an update on spending on power construction (blue, left scale) and water supply (orange, right scale), the two sectors most closely aligned with the AI data center Boom:
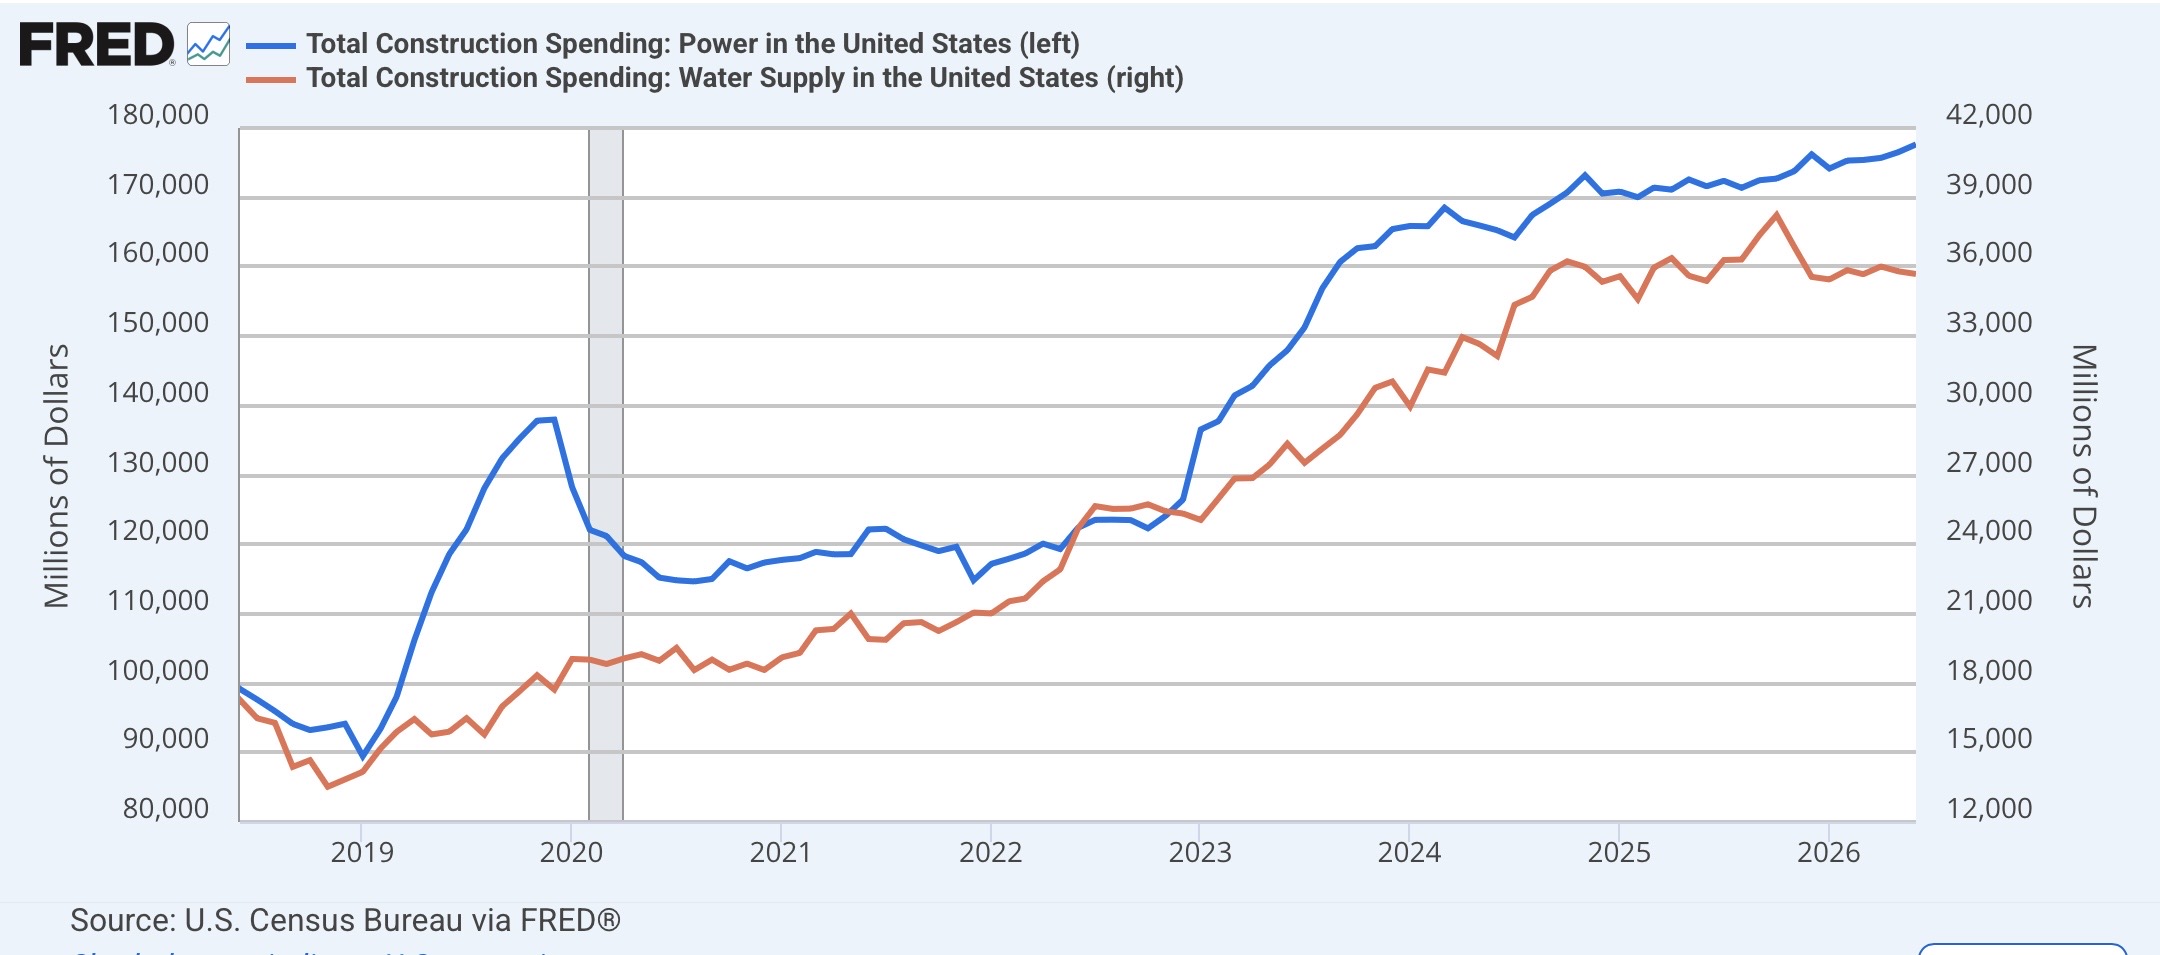
The former rose 0.6% for the month and is up 3.5% YoY, while the latter declined -0.3% and is up only 0.9% YoY at this point. Keep in mind once again that these are nominal figures and don’t take into account the 9.0% increase in construction materials YoY.
These were two very dissimilar reports to start the month. The manufacturing sector is doing quite well, but the construction sector is doing quite poorly. That’s one positive leading indicator and one negative.


Comments
Log in or sign up to join the conversation.