

Here is my delayed write-up on yesterday’s report on personal income and spending in June. To cut to the chase, it continues this year’s paradigm of weak income but strong spending, likely fueled by the ‘wealth effect’ from stock market gains among the upper income levels.
Let me start by reiterating that personal income and spending are among the most important of all monthly indicators, because they give us a detailed look at consumption by the broad range of American households. Further, since consumption leads employment, they also give us an idea of what is likely to happen with regard to jobs in the near future.
This morning’s data for June showed that, nominally, personal spending rose 0.3%, and personal income rose 0.2%. Since the PCE deflator declined -0.1%, real spending was up 0.4%, and real income up 0.5%. Here is what they look like since the pandemic:
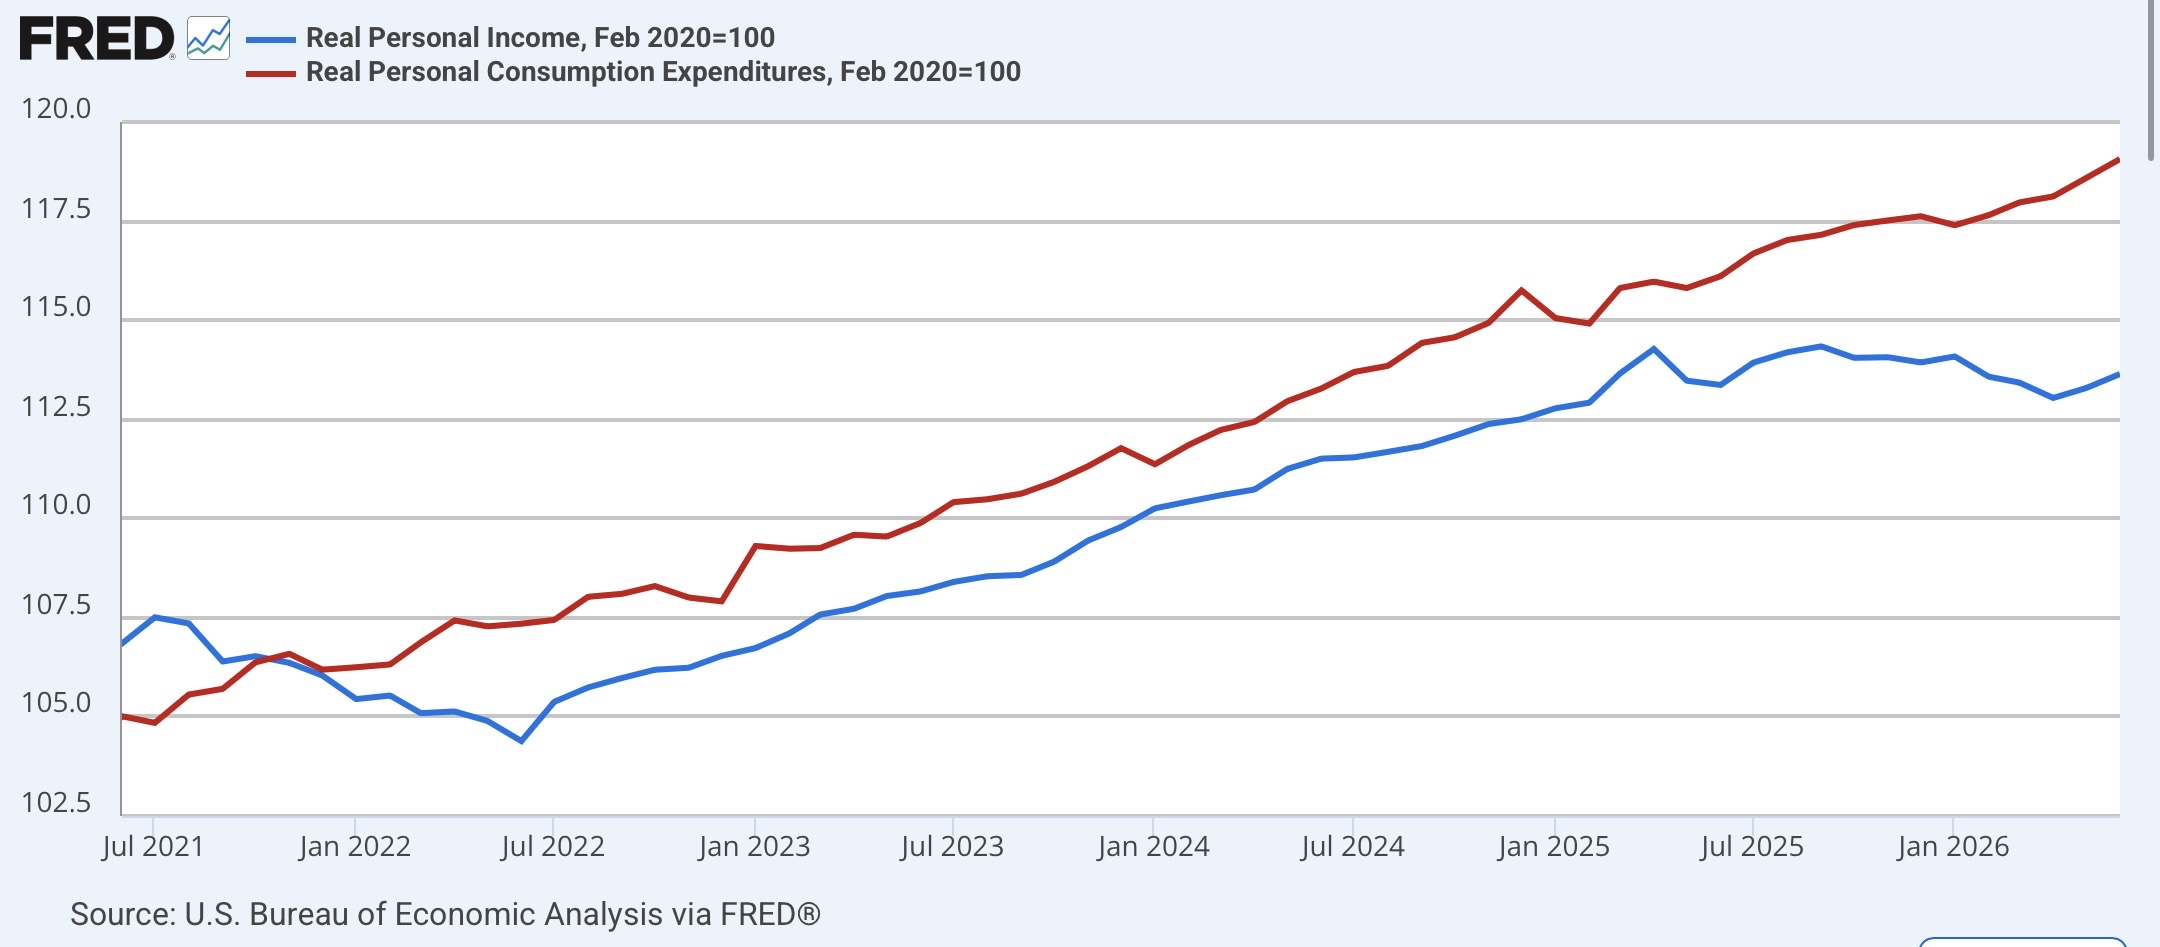
As per my intro above, while real personal spending has continued to increase at a steady clip, real personal income has been flat and even worse for over a year. On a YoY% basis, real spending is up 2.5%, while real income is barely positive at 0.2%:
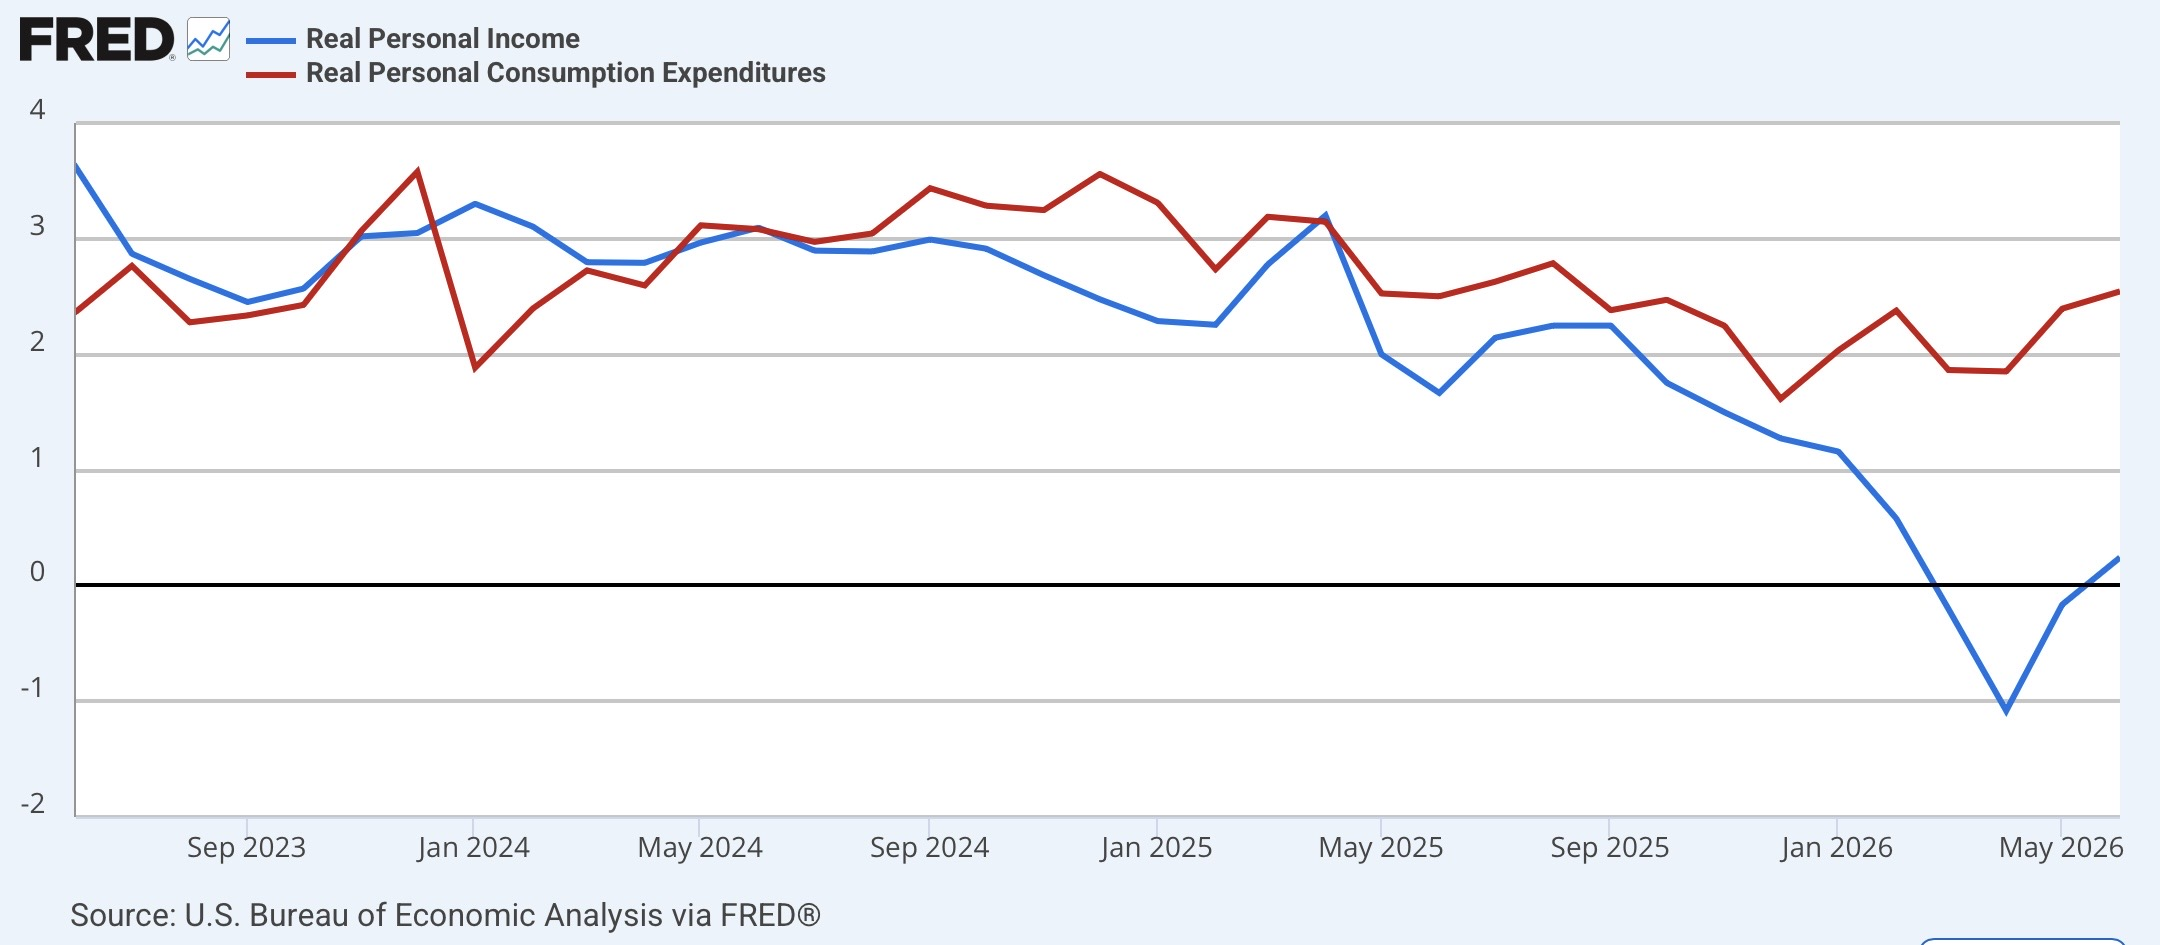
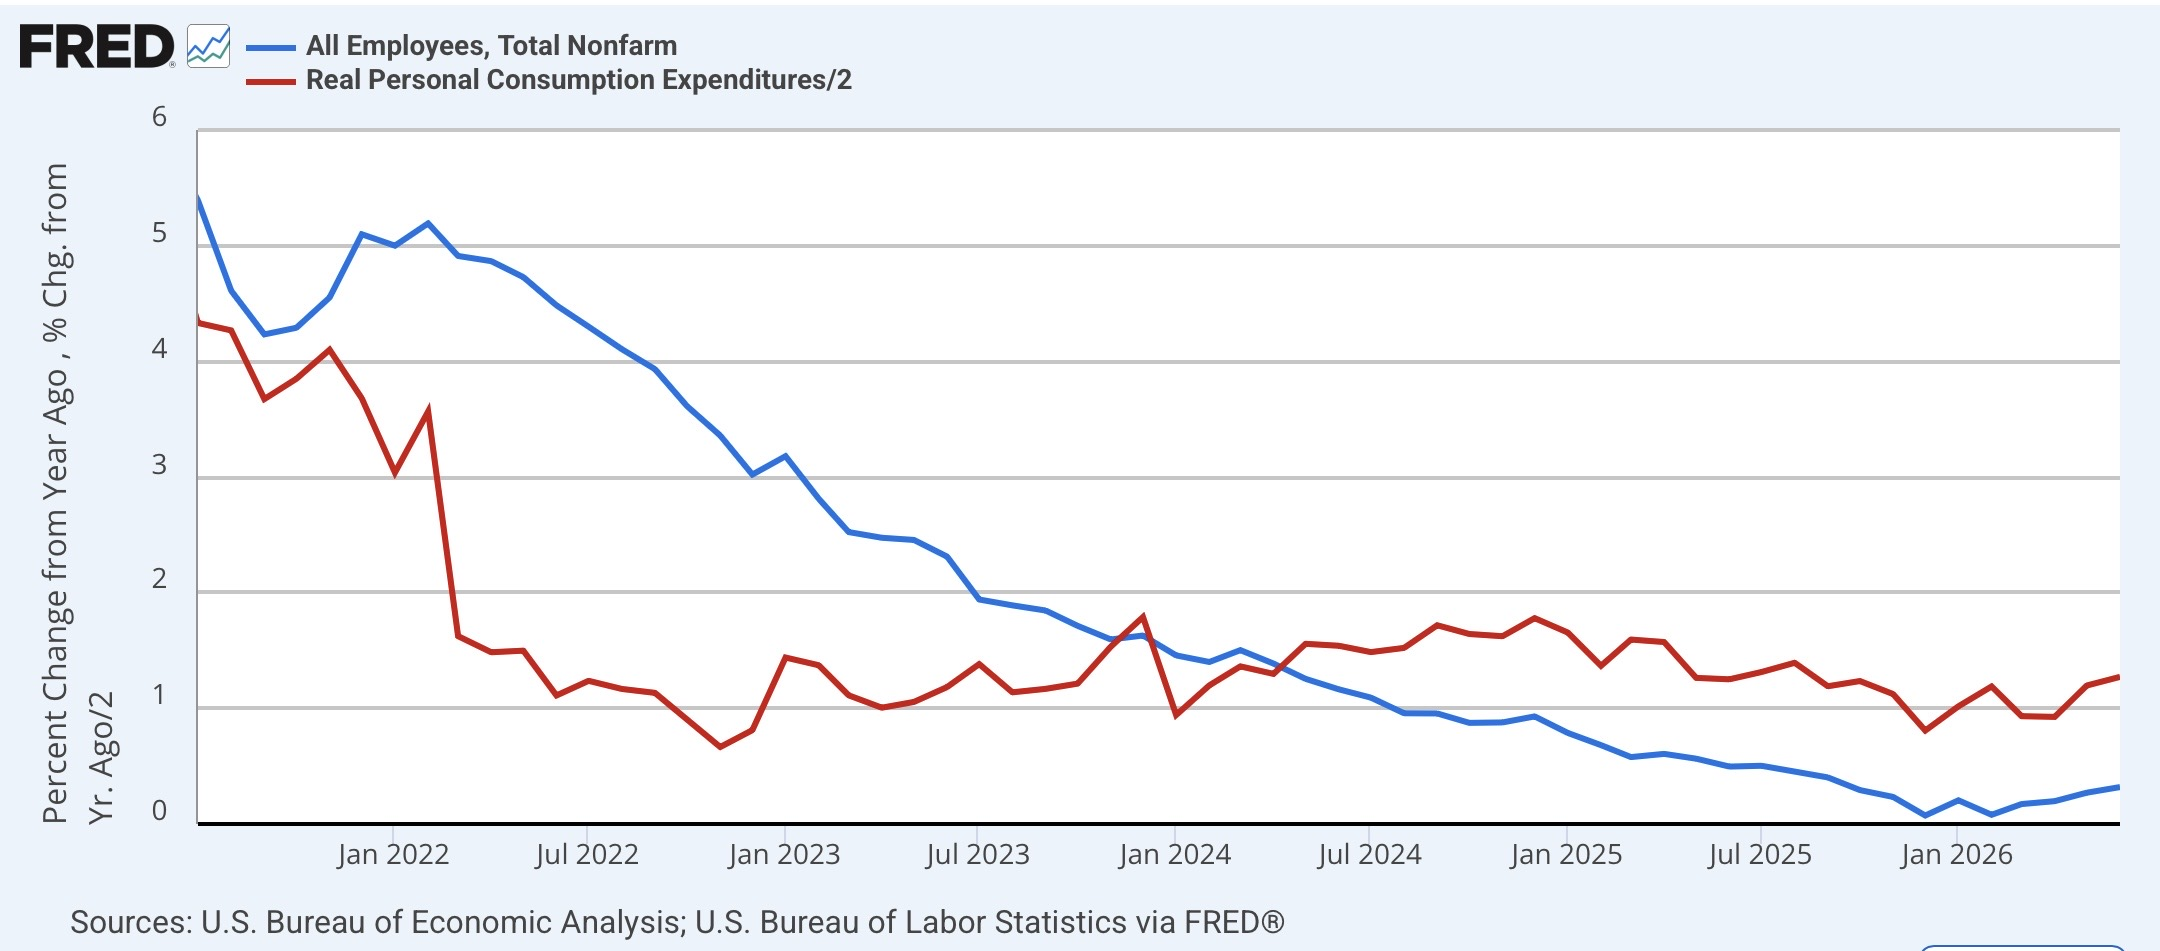
Although I won’t bother with a graph this month, historically when real personal income has been this low YoY, with the exception of several months in 2013, it has always meant a recession was already ongoing. On the other hand, since consumption leads employment, the still-strong spending suggests that the recent string of decently positive employment reports should continue for at least several more months:
With the -0.1% decline in PCE prices for the month, the YoY% change declined from 4.1% to 3.7%:
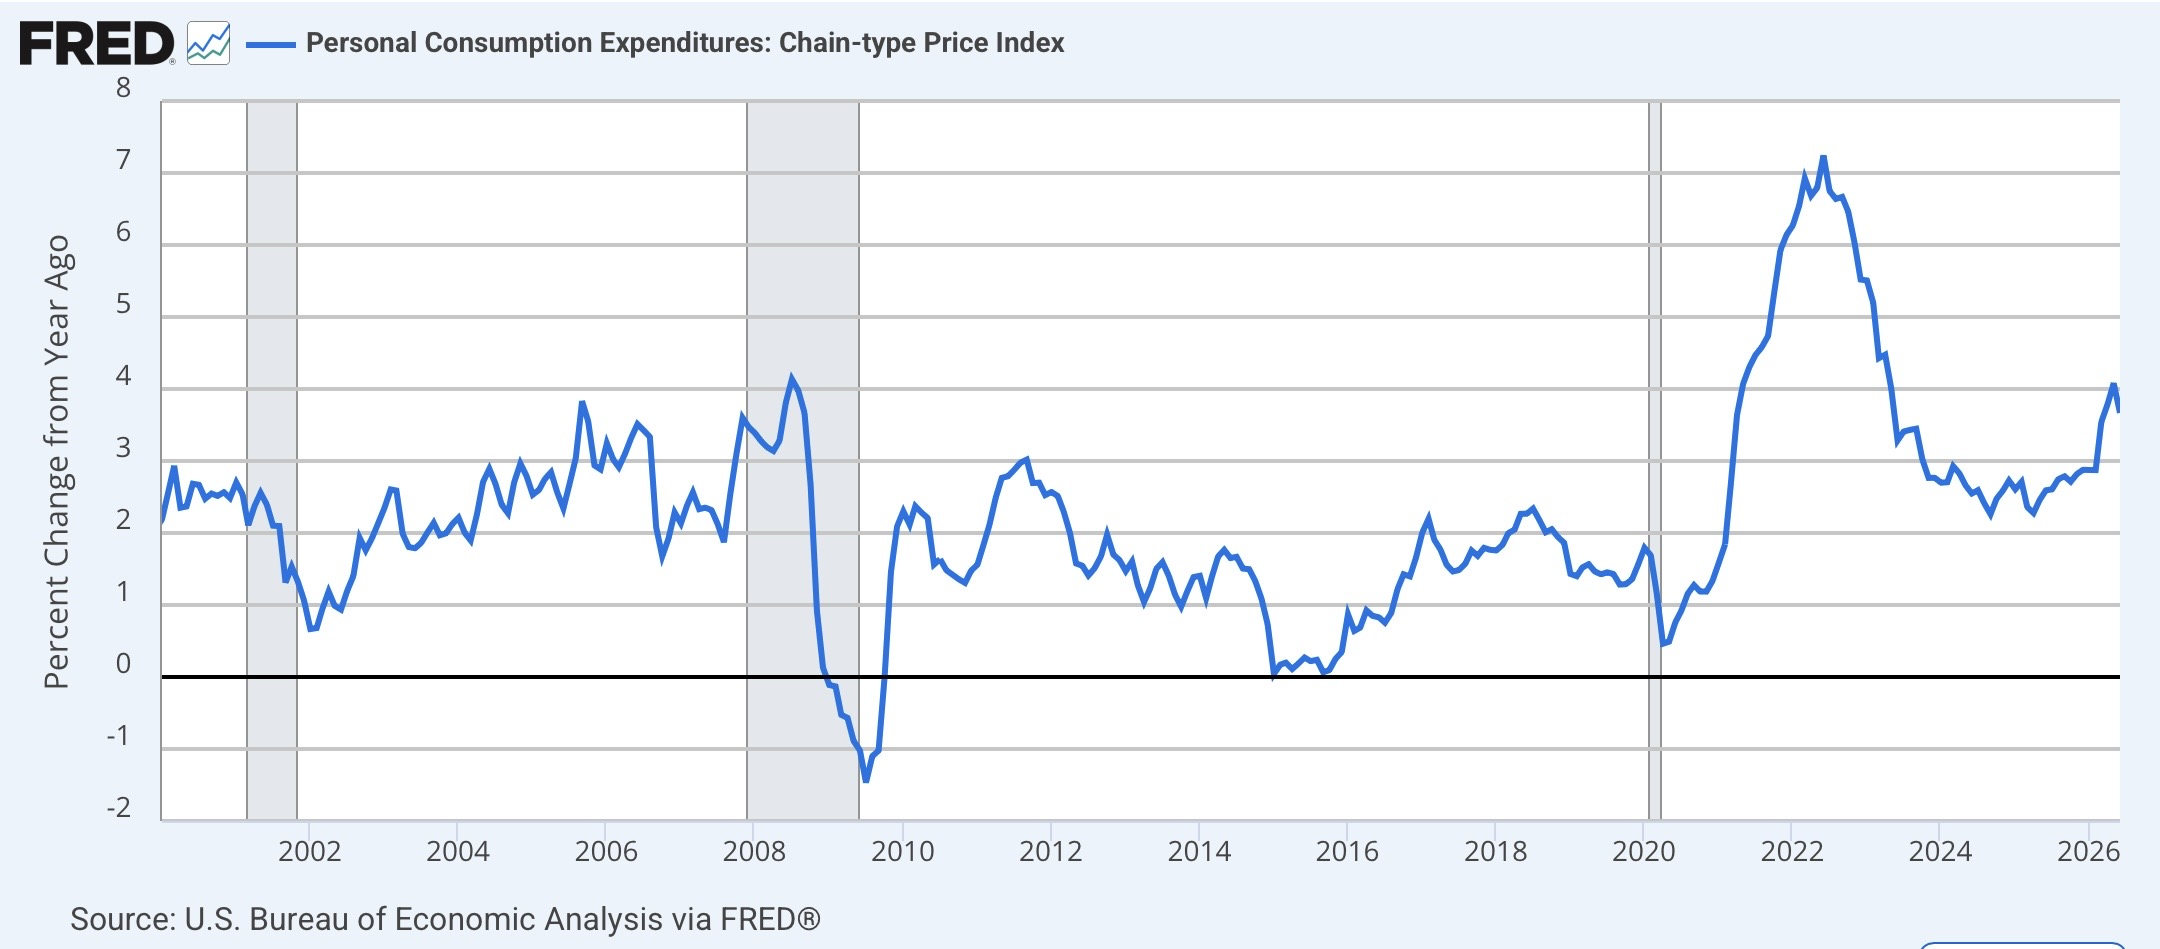
Nevertheless, aside from the post-pandemic inflationary spike, the only times this Milllennium that the PCE deflator has been higher were one month in 2005, and four months at the peak of gas prices in 2008. This is obviously not good.
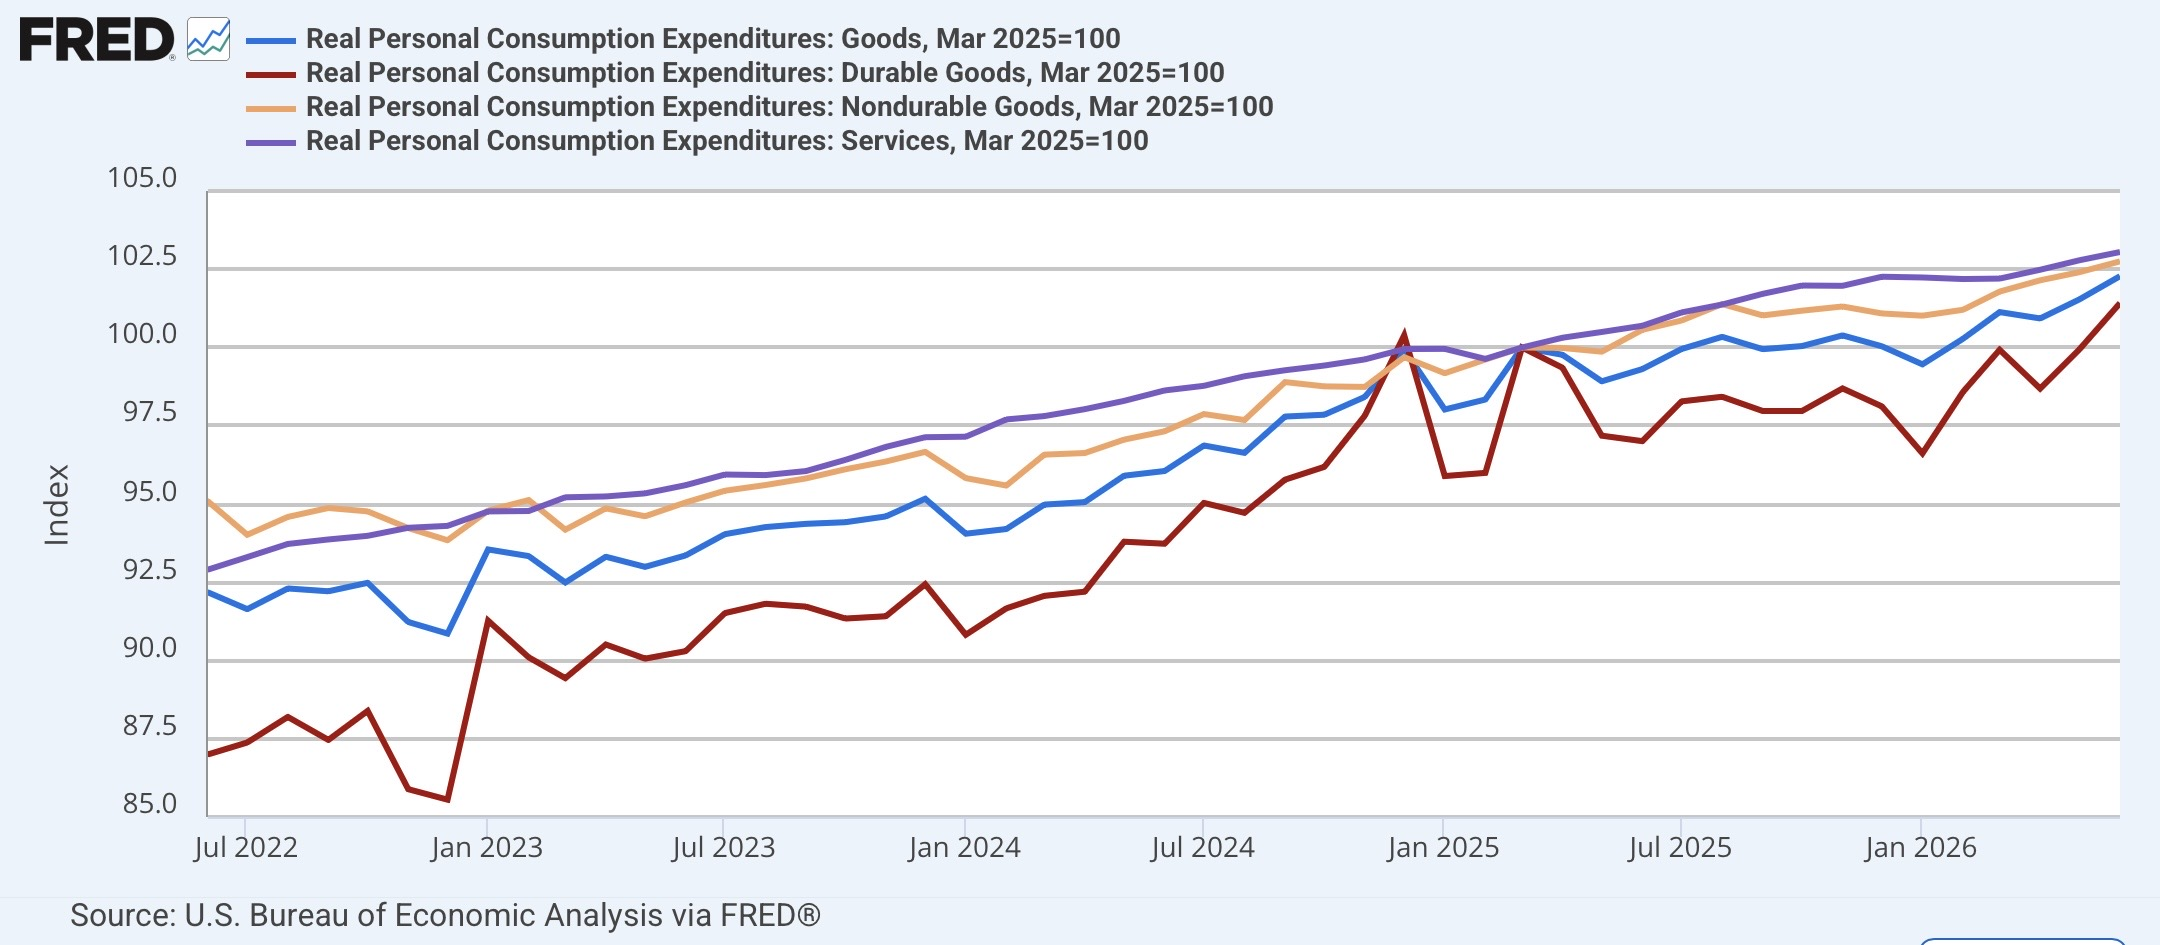
Another important component of the data is spending on goods, and in particular durable goods, which is a leading indicator. Historically, the pattern has been that real spending on goods (blue in the graph below) turns down in advance of recessions, and in particular spending on durable goods (red), which tends to turn down first. Real spending on nondurable goods (gold) has tended to turn down last, while real spending on services (purple) has tended to rise even during all but the most prolonged or deep recessions.
June was a good month for all of these metrics, as real spending on goods (blue) increased 0.7%, and on durable goods (red) increased a sharp 1.5%. Real spending on nondurable goods (gold) rose 0.3%, as did real spending on services (purple). The below graph is normed to 100 as of March of last year, to show the stall in the two most leading metrics for the remainder of last year, together with the rising trend this year:
The difference in robust personal spending and anemic personal income is explained by the downward trend in the personal saving rate, which declined -0.1% to 2.7% in June:
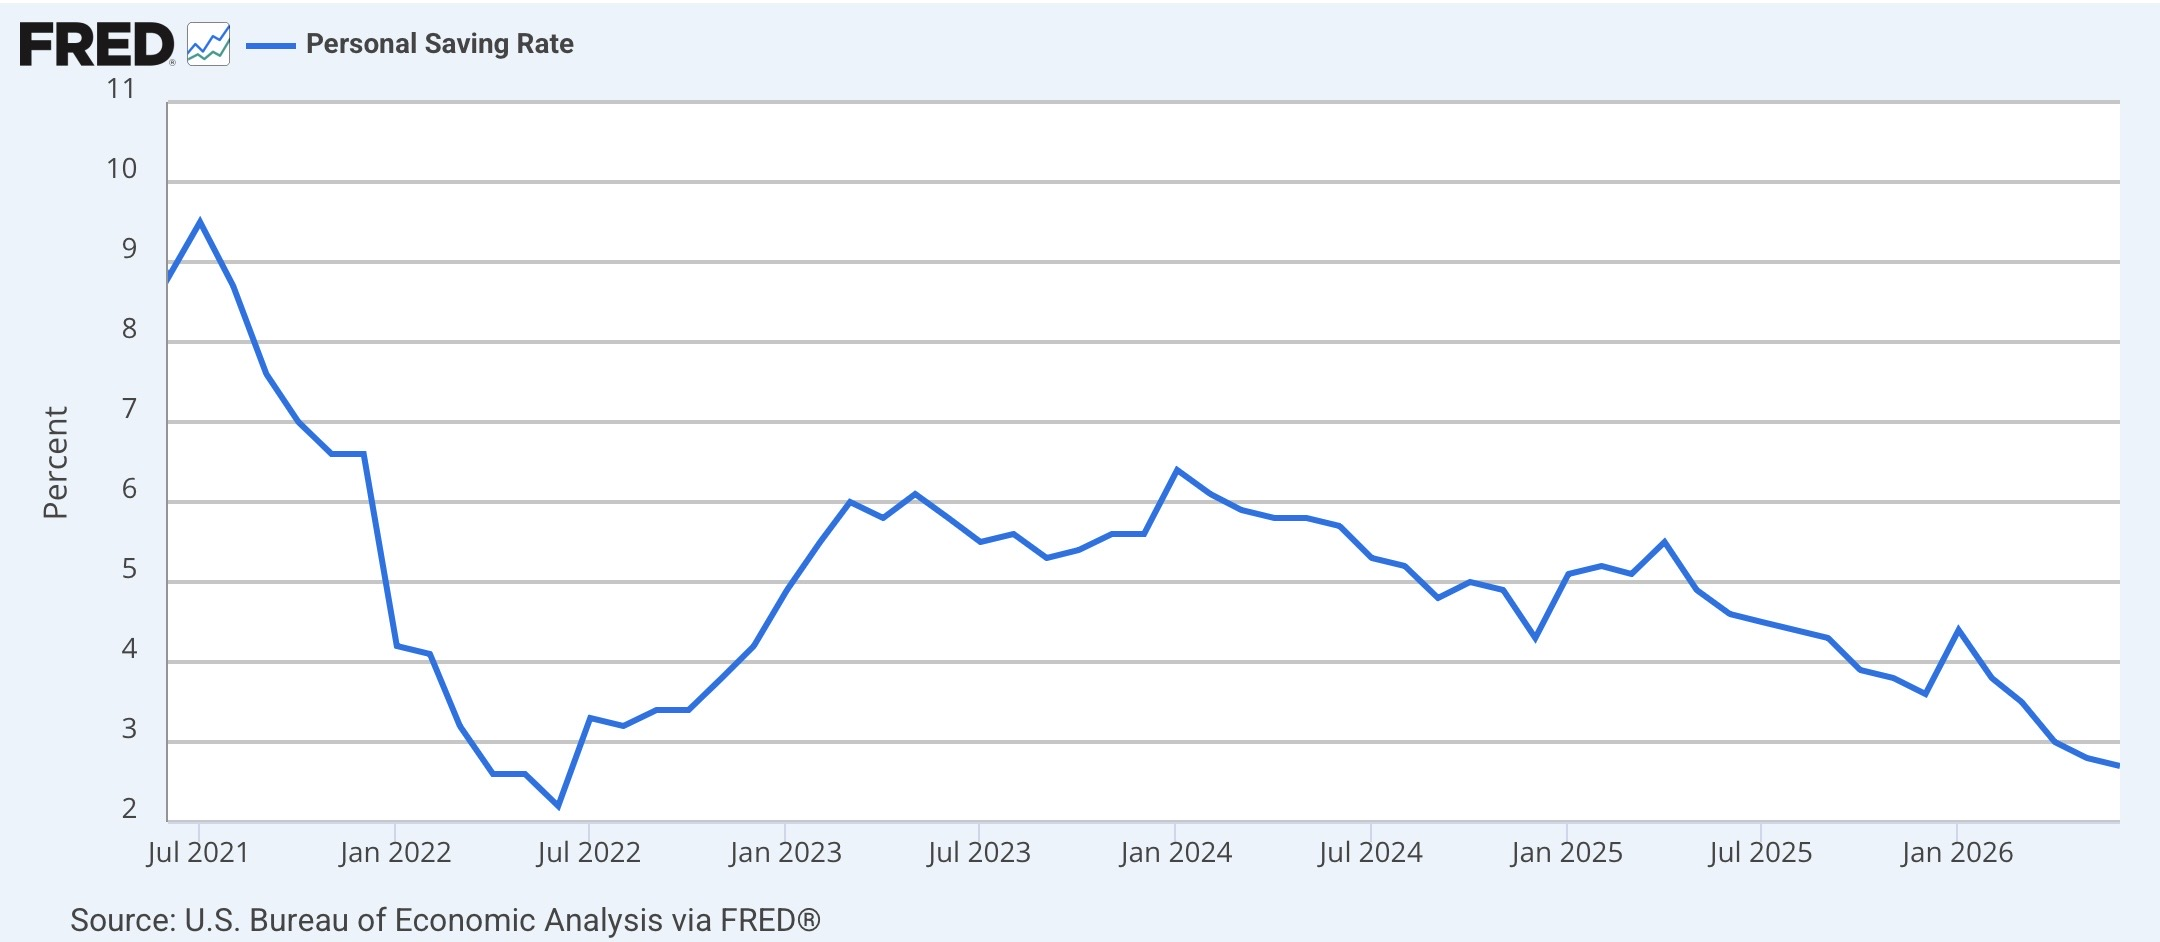
This has been trending down since 2004, and is now at nearly its post-pandemic low. Further, although I won’t bother with the historical graph this month, it is also in the range of its lowest readings, which remained below 3% from 2005 through early 2008. This means two things: first, that consumers in June remained confident enough to continue spending despite the income constraints, but also that this spending is very vulnerable to any adverse shock (like $6 gas and/or the bursting of a financial bubble).
This report also allows us to update two important data series used by the NBER to date recessions.
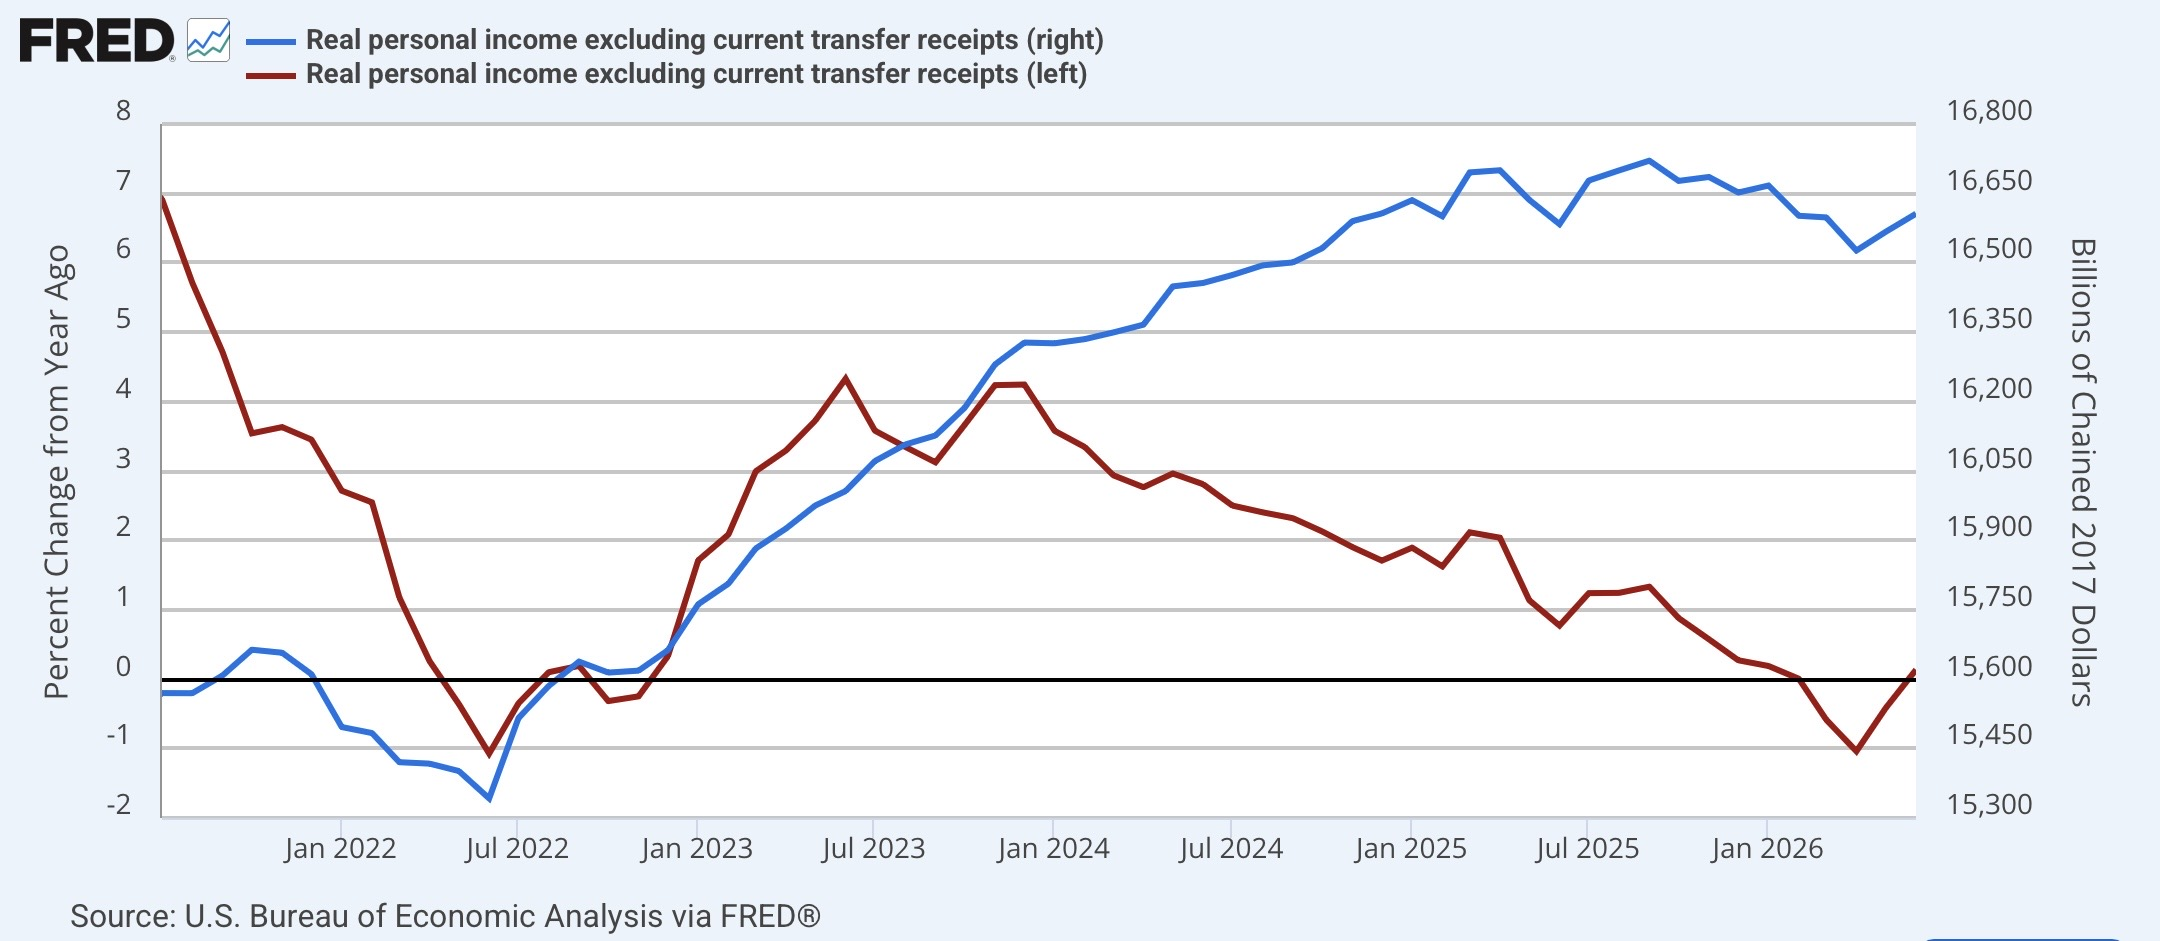
The first of these is real income less government transfers (like Social Security payments or unemployment benefits). This increased 0.2% in June, the second increase in a row. But this is still only 0.1% higher YoY (red, left scale), and -0.7% below its peak last September (blue, right scale):
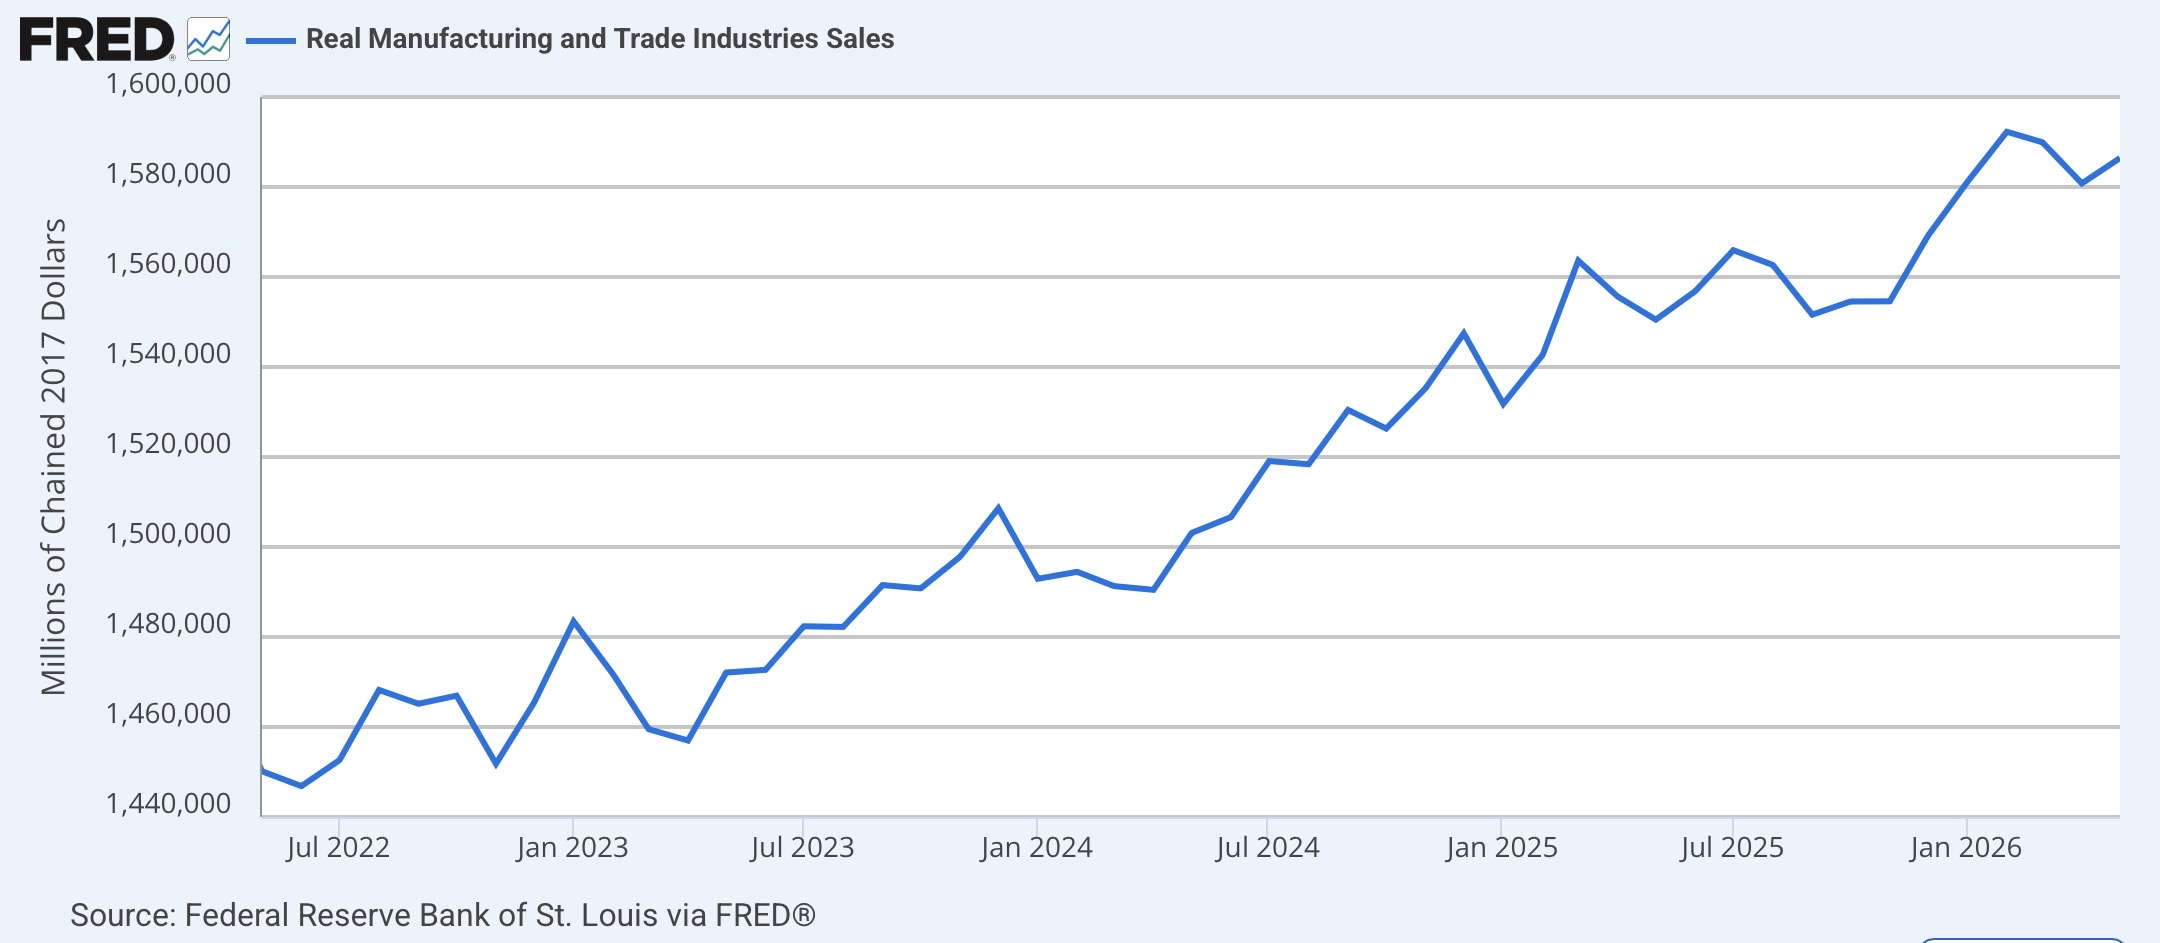
The second important coincident indicator, real manufacturing and trade sales, which is delayed by a month, increased 0.4% in May, but is also -0.4% below its peak in February:
But if these two coincident markers are recessionary, other components, including industrial production (blue), employment (red), and as discussed above real consumption (dark gray), have made new highs as of the last monrth:
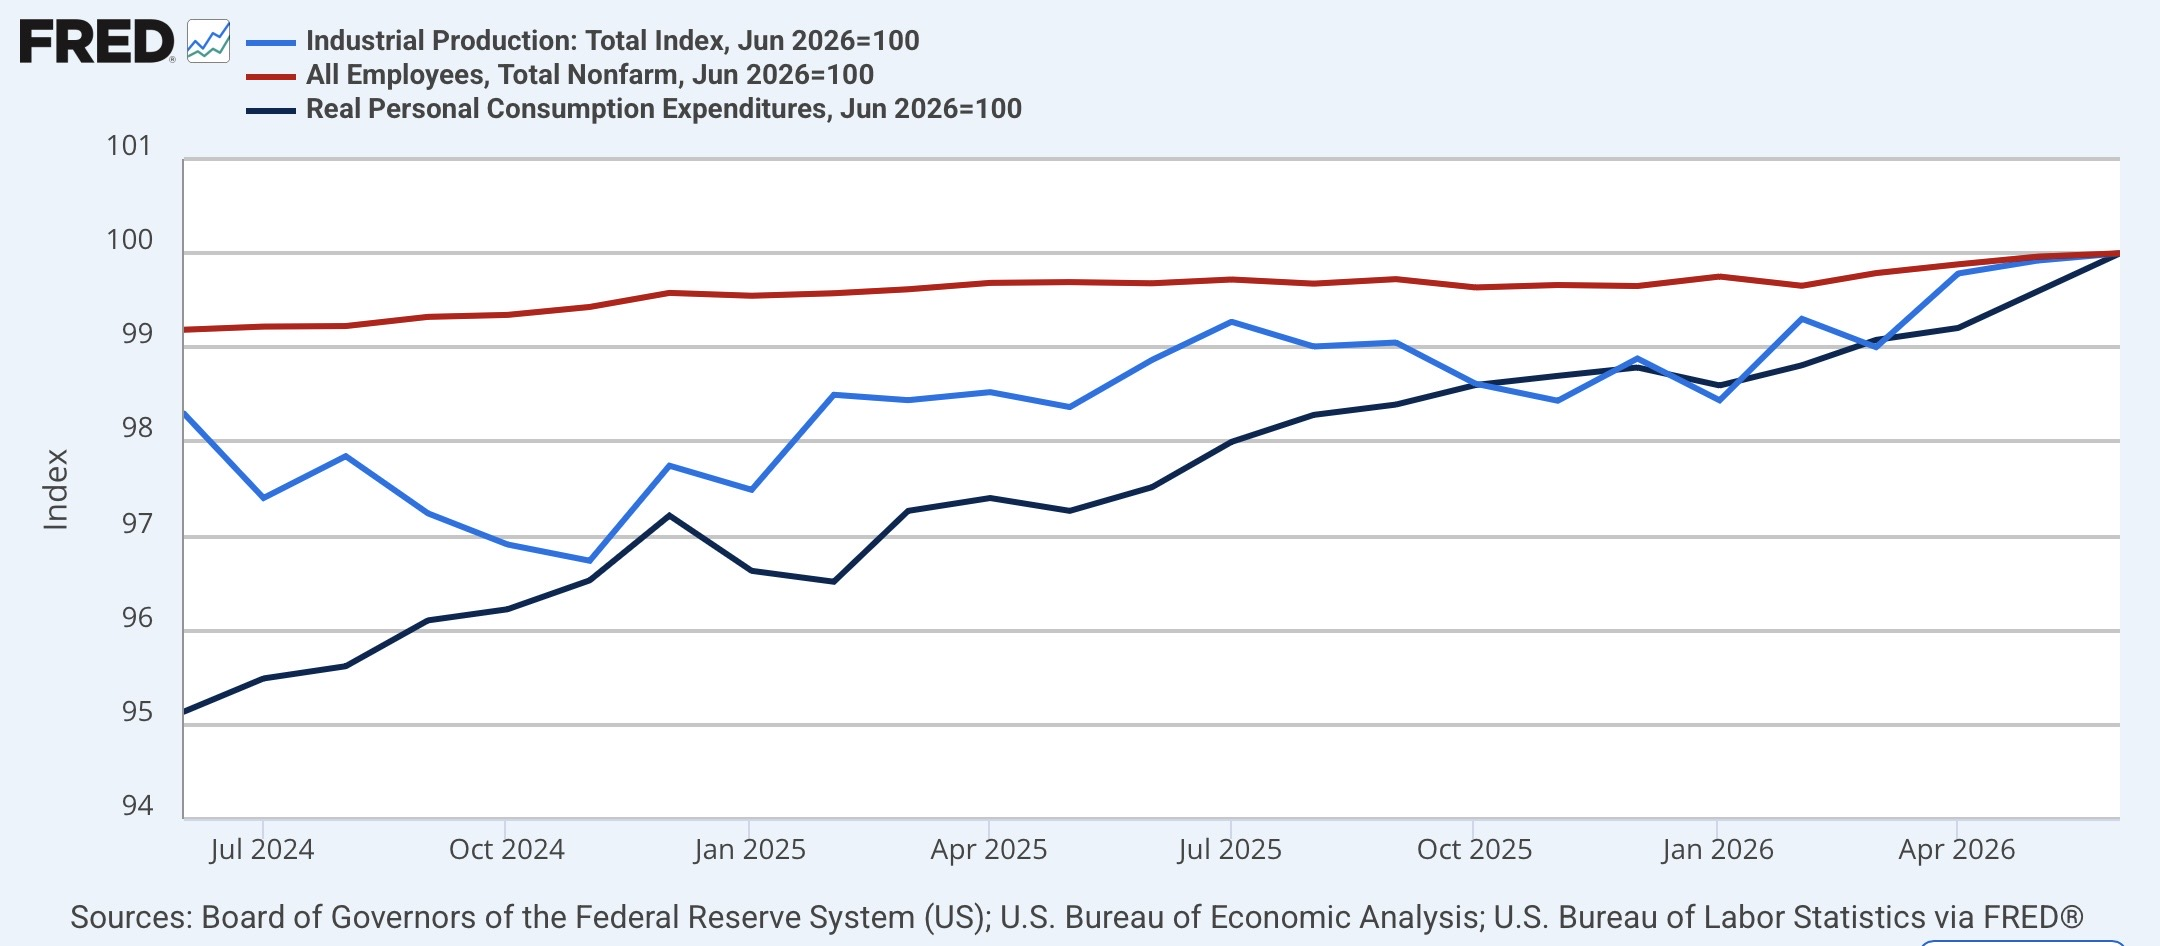
To sum up, consumers’ real incomes on average continue to languish, but their aggregate consumption continues to be strong. Production and sales have also been powering this year’s rebound from the near-miss or mini-recession of last summer and autumn. But households are continuing to dig into their savings. Unless incomes start to improve in real terms, then any reversal could easily lead to consumer retrenchment and a downturn. But we’re not there now.


Comments
Log in or sign up to join the conversation.