

Last week, we detailed why the June drop in gold and silver, following the post-war correction, was a paper-market-driven event, with higher-volume ETFs, futures, and quarter-end positioning moves overtaking the physical demand behind the longer-term rally.
The World Gold Council has since released its mid-year outlook for the second half of 2026, which points to the same conclusion on the demand side.
The forces that carried gold to its January record have not let up. The case for gold remains.
Central Banks Remain Strategic Buyers
Central banks continue to be the gold market anchor.
The World Gold Council expects 750 to 850 tonnes of buying in 2026, which is enough to place this year among the top five strongest for central bank gold buying since 1971 (for reference, the same year that Disney World opened in Florida).
That pace continued into this year, with an estimated 244 tonnes bought in the first quarter, more than the prior quarter and more than the five-year average. The strategic intent behind these buys has been fortified even more by the Iran War.
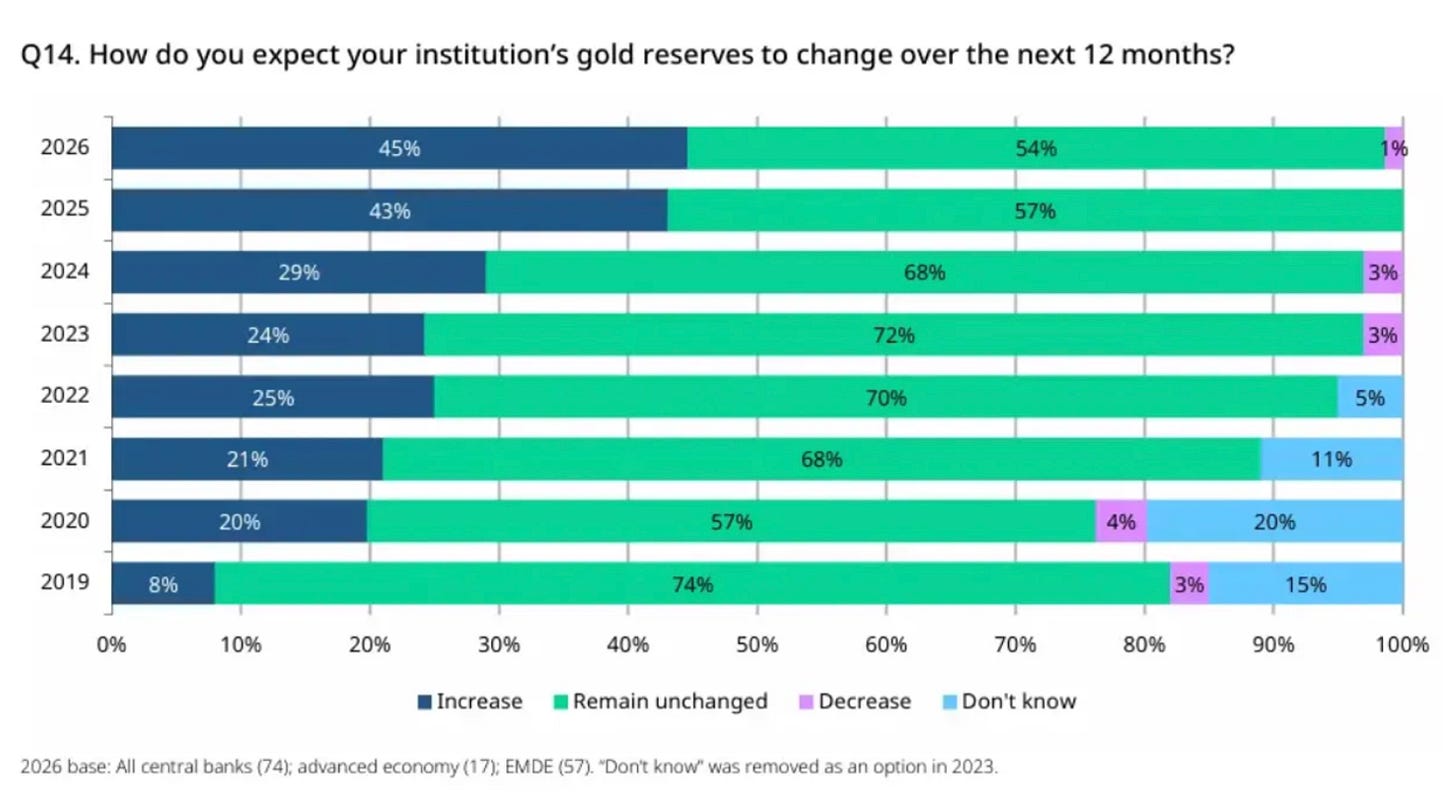
In its latest survey, 95% of central banks expect global gold reserves to keep rising over the next year, the highest reading on record, and 45% plan to add to their own holdings.
Buying on that scale never showed up on the June futures screen, and these are strategic buyers who keep accumulating regardless.
Investment Demand Held Up, Led by Asia
The other half of the equation is investment demand, and it is both holding up and worth paying attention to. That’s because the drivers are the same ones that have been in place for two years, which offer us a steady place to understand the trend and where it might be headed. Because war and political risk have not eased, there are few other places to park money that look safe, and a rising price tends to bring in more buyers. Currently, Asia is leading, with Chinese demand supported by safe-haven flows and a lack of good alternatives domestically available.
Western ETF holders did sell in the first half, which is the paper pressure we wrote about, but that is a different crowd from the buyers stacking metal for the long run. The World Gold Council expects that broader shift into gold to hold through the second half of 2026, even if the pace runs below last year.
Meanwhile, the paper pressure is already easing.
When we look at GLD, the largest gold ETF, it traded about 12.6 million shares on the June 24 selloff day, then fell back to near 5 million by the end of June, well under its 8 million daily average, as the forced selling ran out.
This is the July reset we flagged. The quarter-end selling was a paper event once again, which was driven in part by short sellers pressing into June 30, and that pressure tends to unwind once the new quarter opens and those positions reset.
The weak jobs report gave it a push. June nonfarm payrolls came in at just 57,000, well under the roughly 115,000 economists expected, so markets cut their bets on a Fed rate hike, and the CME’s FedWatch tool now puts the odds of a July 29 hike well below 30%. Higher-for-longer rates were the main weight on gold through June, and that weight is lifting.
What the Second Half of the Year Sets Up
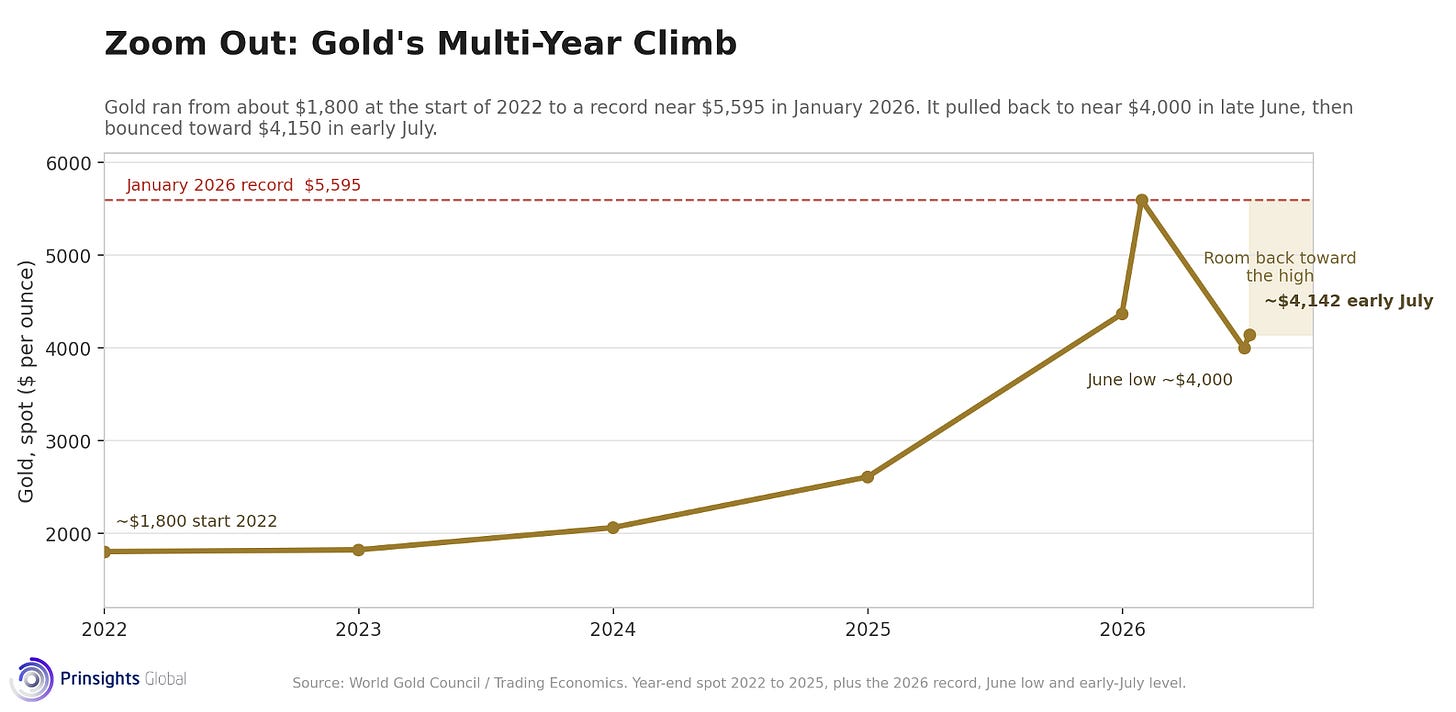
Over the near-term, we expect that volatility may remain, driven by any headline shifts and as a result gold could trade in a tighter range until it’s clearer that inflation has also dropped. And after a climb from under $2,000 to a January record of $5,595 an ounce, some consolidation is normal.
Right now, gold is trading near $4,190 an ounce, firming off the June low.
What matters more than this price action is the fundamental fact that the demand behind the move is still in place.
Central banks are still buying, investment demand is still positive, and mine supply cannot respond to either one quickly enough by extracting key metals and minerals from the earth. That near-term range is a small part of a longer-term trajectory that still points to higher prices.
All of this is (and because many of you have asked) why we are reaffirming our January $6,000 gold forecast. The war, Fed hike fears, and oil-driven inflation scare made the path even more volatile. The drivers behind that forecast are the same, central bank buying, debt, reserve diversification, and hard-asset demand. Recent geopolitical stress has continued to add to the pressure behind that longer-term case.
We are not alone in our view, though we are at the higher end of the range. The Official Monetary and Financial Institutions Forum (OMFIF) released its 2026 Global Public Investor survey last week, and 61% of the 90 central banks and public funds polled expect gold to settle between $5,000 and $6,000 an ounce within the next year.
Comments
Log in or sign up to join the conversation.