


According to an article published Wednesday in The Wall Street Journal, more than 40 S&P 500 companies have reported roughly $9.6 billion in tariff refunds. Apple leads at nearly $2.2 billion. Nike follows at $986 million, FedEx at about $800 million, Amazon at $640 million, and GM at $500 million.
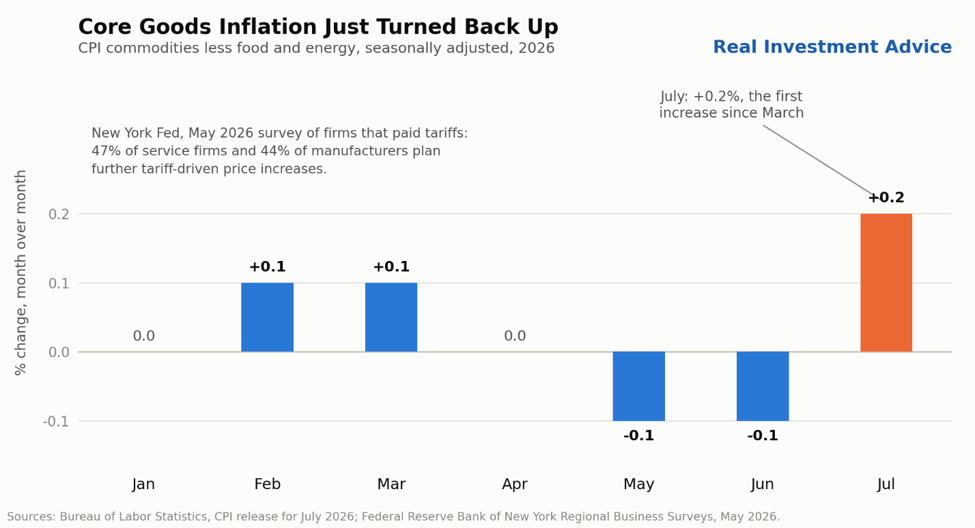
The timing is awkward. In July, the New York Fed published More Tariff Pass-Through Is in the Pipeline. Its May survey of firms that paid tariffs found that 47% of service firms and 44% of manufacturers still plan to raise prices further. About a third of those service firms and closer to 40% of the manufacturers intend to move within six months. Wednesday’s CPI backed them up. As we show below, core goods rose 0.2% in July after three flat-to-negative months, with motor vehicle parts up 0.6%.
Here is where tariff refunds counter the Fed narrative. That pipeline assumes firms still need to recover the cost increases they absorbed. A tariff refund does exactly that. Thus, businesses holding the cash have less reason to execute previously planned increases. Several are already spending it on price. Amazon CFO Brian Olsavsky told analysts in July that the company will “utilize refunds to continue to invest in low prices for customers.” Costco intends to pass refunds along “in some form.” FedEx starts cutting checks to shippers this month.
We are not calling for disinflation. Section 232 and 301 duties remain in force, and the Treasury intends to backfill under Section 122. Generously, tariff refunds are worth a tenth of a point on headline CPI. But they are still a reason to think the Fed’s pipeline drains slower than its survey implies.
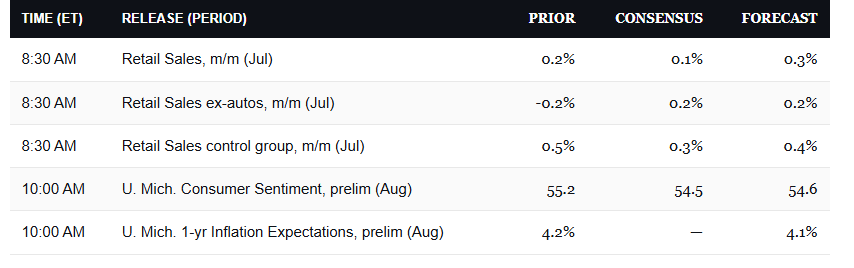
What To Watch Today
Earnings
No notable earnings reports today.
Economy
Market Trading Update
Yesterday, we walked through Citadel’s read on the market’s internals and why July’s “reset” changed the tape more than the headline index let on. Today, let’s put a hard number on the market breadth question and ask what a 70%-plus reading really means for the next few months.
Here’s the number. As of August 7, more than 72% of S&P 500 members traded above their 200-day moving average, the broadest participation since December 2024. That’s a long climb from the roughly 41% washout this spring. The average stock is healing even as the S&P 500 sits at 7,748.50 after Wednesday’s close, less than 1% below its record high.
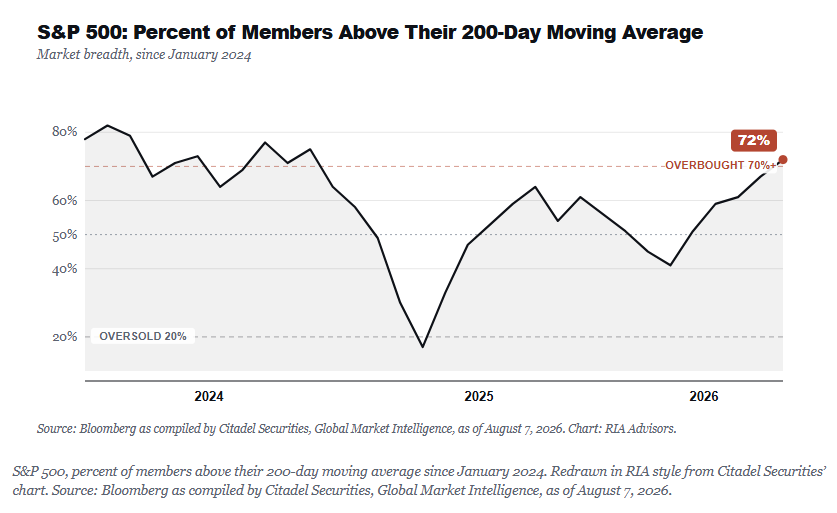
Does that mean the rally has room, or is it a warning? Both camps have a case, and the honest answer is that trajectory matters more than the level.
Start with the bullish read, because the base rates back it. When breadth thrusts higher near a record high, as it has since spring, SentimenTrader finds that the S&P 500 has been positive roughly 90% of the time over the following two months.
Anything above 50% of stocks trading above their 200-day moving average indicates a long-term uptrend regime. And as StockCharts has noted for years, readings north of 70% are technically overbought, yet in a real uptrend, overbought stays overbought. Over six to twelve months, broad participation like this has been a tailwind far more often than a headwind. Citadel’s own point reinforces this: breadth is rising while cross-stock correlation sits near record lows, indicating a wide market, not a narrow pocket of leadership.
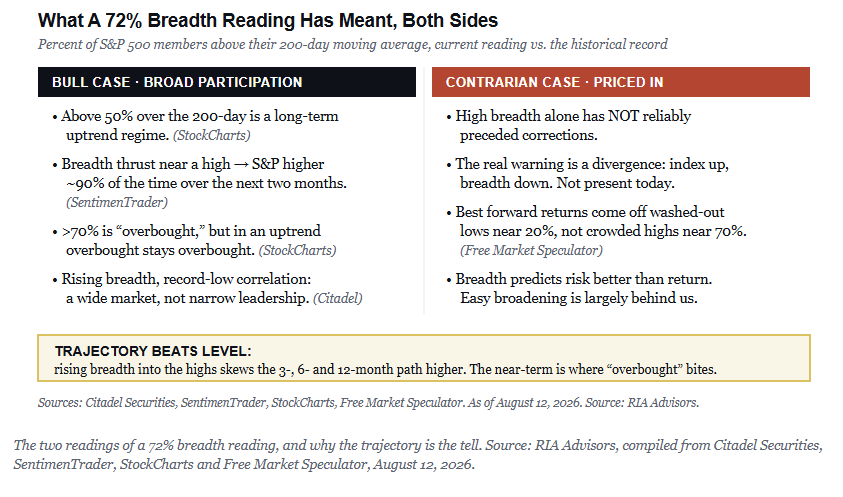
Now the contrarian side, because that’s where the risk hides. Elevated breadth by itself has NOT reliably preceded corrections. What precedes them is a divergence, the index pushing to new highs while fewer stocks tag along. We don’t have that today, as breadth is rising into the highs rather than fading beneath them.
The sharper caveat is subtler: the biggest forward returns show up after washed-out lows near 20%, not after the crowd is already all-in near 70%. Put simply, breadth predicts risk better than it predicts return. So by horizon, the odds tilt higher over three, six, and twelve months, while the next month is the stretch where an overbought tape can chop or shed a few percent without changing the larger trend.
That’s the read for the models. In our Equity Models, we’re used the broadening to rebalance, not to chase, trimming the most stretched winners back to target weight, lifting quality, and keeping the cash buffer intact. Manage risk into the strength, not after it breaks.
The Consumer Balance Sheet Is Not Cracking
On Tuesday the New York Fed released its Quarterly Report on Household Debt and Credit for the second quarter. Total household debt fell $13 billion to $18.771 trillion, a rare quarterly decline, led by a $74 billion drop in mortgage balances. Debt now equals 79.4% of disposable income. That is the lowest reading since 2003 outside the stimulus quarters. It ran above 110% before the 2008 crisis.
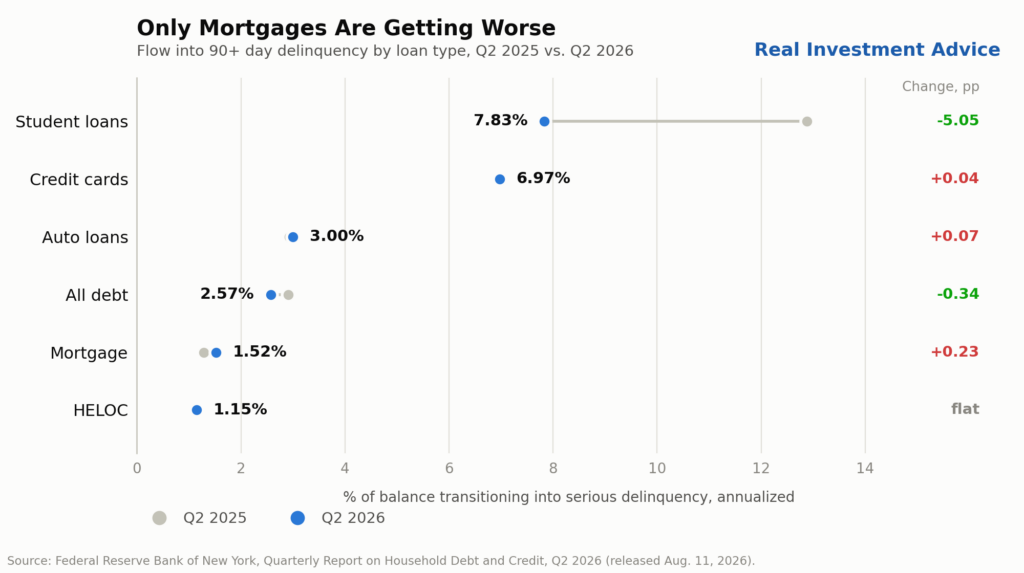
Delinquencies improved as well. The share of balances flowing into serious delinquency fell to 2.57% from 2.91% a year ago. Student loans did most of that work, dropping from 12.88% to 7.83% as the 2025 forbearance-exit distortion washes out of the data. Fresh delinquencies, 30 to 119 days past due, sit at 1.7% of balances. That is close to pre-pandemic lows. Foreclosures totaled 55,160, below where they ran in 2019.
Joelle Scally of the New York Fed put it simply: “Delinquency rates across most products have held steady over the past two years.”
As we show below, mortgage delinquency transitions climbed to 1.52% from 1.29%. Every other category held flat or improved. Credit cards still sit near 7% and autos at 3%, high in absolute terms but no longer deteriorating.
All of this refutes the consumer-is-cracking narrative. Households carry less debt relative to income than at any point in the past twenty years. Housing is the exception, which makes it the category to watch through the fall.
Tweet of the Day



Comments
Log in or sign up to join the conversation.