


For months, we’ve been told the Fed won’t be in the business of giving forward guidance, with Fed Chair Warsh using Jackson Hole to explain the Fed’s thinking while leaving the market to play ball. Then Fed Governor Chris Waller came out this week and said the coming CPI report will be super important in determining whether there should be a September rate hike.
Oddly, PPI comes out before CPI this week, on Thursday (9/10), followed by CPI on Friday (9/11), and we rarely get CPI on a Friday at all. Core CPI is expected to rise 0.2%, with the year-over-year rate slipping to 2.4% from 2.5%, while headline CPI is expected to rise 0.4% from 0.1%, for a 3.4% year-over-year increase. Kalshi and the swap market are in line with those numbers, so nothing on the surface suggests a super-hot reading. Core CPI has also felt screwed up since the October government shutdown, when a lot of data was missing; November should give us a better idea of the real inflation rate.
However, the ISM Services Prices Index climbed to around 72 this past week, its highest since September 2022, and it has diverged from CPI since 2024; prices paid tend to lead CPI year-over-year. Services inflation is the piece the Fed hasn’t been able to get down for five years, with goods prices becoming a problem more recently. Energy, diesel, and gasoline prices are also up this month, providing a potential positive impulse to CPI, with spillover into PPI, and it all eventually feeds through to core PCE.
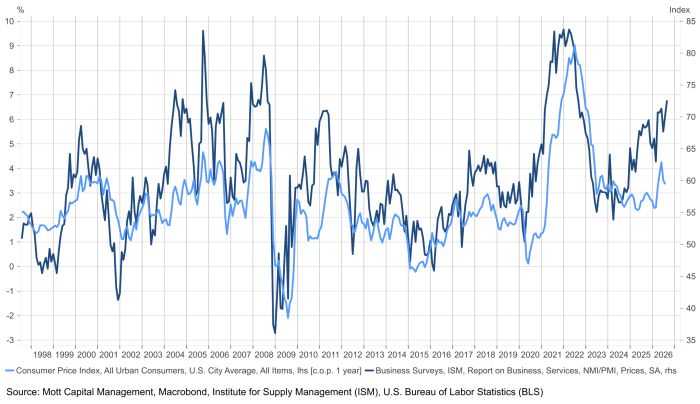
Factor in the energy move along with rates rising at the front of the curve, and there’s a risk we get a hotter-than-expected report. That would leave the Fed in a box, because not raising rates puts things in the market’s hands, which would then have to adjust to a Fed that isn’t responding to hotter inflation, especially with a governor saying just before the blackout period that a hot reading would push him toward hiking. They would need a lot of good evidence not to hike, since most members seem to think rates probably need to start going up, and after a really strong jobs report, labor-market softness is no longer an excuse to lean on.
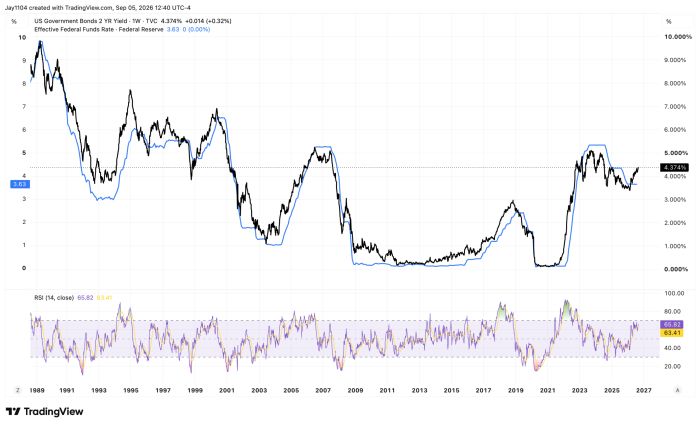
Pointing in the same direction is the 2-year rate, which tends to lead the effective funds rate. It turned higher in March 2004, October 2016, and September 2021, with the Fed hiking within months each time. The 2-year has now been rising for about six months, so we’re in the window where the Fed should be starting to hike, and the longer it runs, the more it will weigh on them. The administration wants rates lower, but the market is dictating higher rates, and if the Fed doesn’t go along, I think 10-year rates go significantly higher, with the market punishing the Fed.
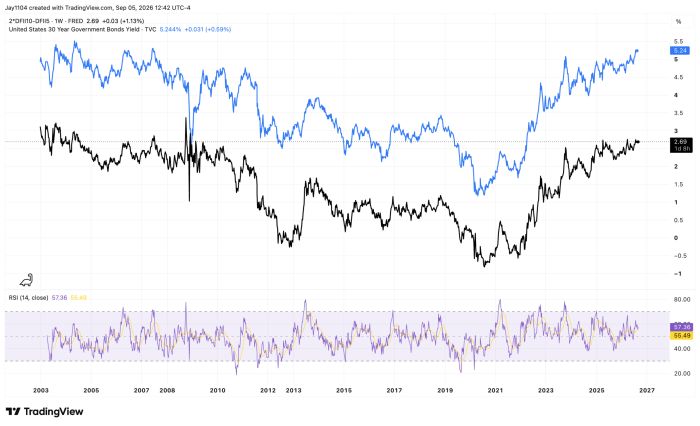
The 10-year closed the week at 4.78%, its highest weekly close since October 2023, suggesting we’re getting closer to the 5% area. The 30-year didn’t make a new weekly closing high, but at about 5.25%, it remains well above its October 2023 close. I think the market is repricing the neutral rate and the economy’s longer-term growth rate. A derivative of the 5-year, 5-year forward real rate has been climbing and looks just like the 30-year Treasury rate—essentially the same chart for years. The market is pricing in a higher neutral rate to keep inflation at bay, which is ultimately the driving force and potentially a big problem if the Fed doesn’t start raising rates.
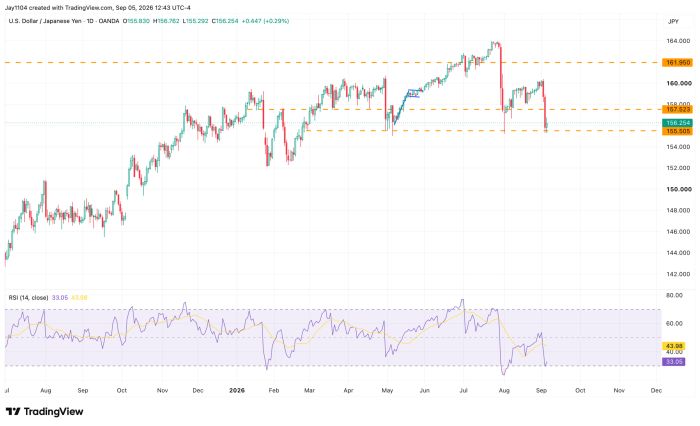
Rates are rising around the world, too, though Japanese yields fell this week as the market began to expect more aggressive BOJ hikes, which notably strengthened the yen against the dollar. The yen hasn’t broken the important level around 155 yet; if it does, things get more interesting.
The Korean won also continued to strengthen, closing at its strongest level since October 2024. I watch it because of its relationship with semiconductor implied volatility, and it probably represents the foreign inflows from Asia that chased the AI trade here, with South Korea running its own AI bubble in SK Hynix (HXSCF) and Samsung (SSNLF). The strengthening could be a sign of repatriation, with capital allocated to the U.S., perhaps played through options, going back home, and the SMH shows a similar picture. It suggests a lot of that capital has left with no sign of returning, which may weigh on semiconductors, since new buying would have to come from a different part of the market, and software is already beaten down.
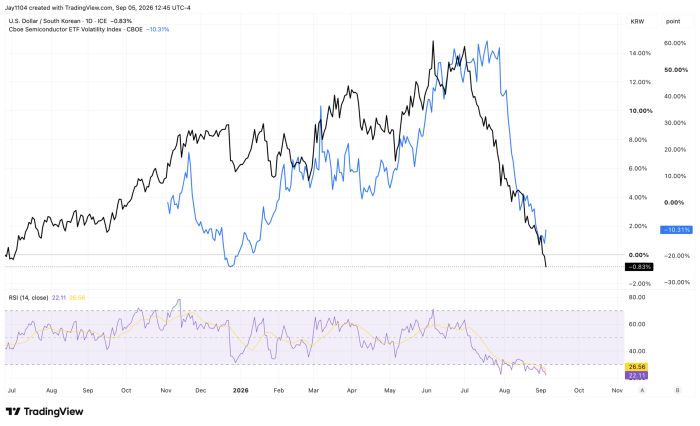
Outside of that, the week is about the CPI report and a Fed that’s in a box if the number comes in hot. Given the ISM readings and the energy move this month, I think there’s a reasonable chance that happens.


Comments
Log in or sign up to join the conversation.