


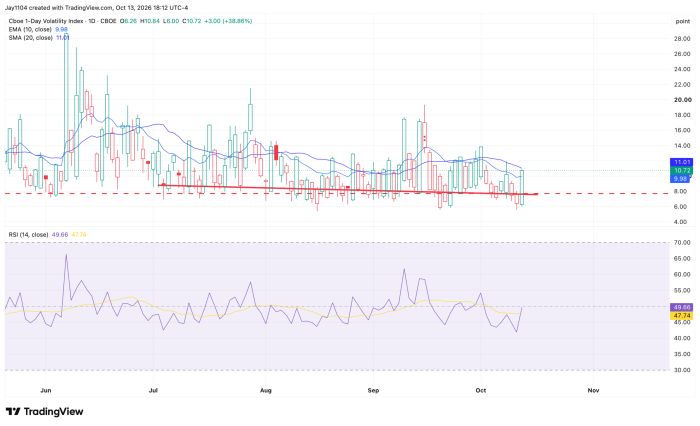
The VIX 1-Day hit 10.7. Wow. On the day before a CPI report, that’s pretty low. But hey, double digits beat single digits, and it could open at 7 or 15 tomorrow, depending on the data.
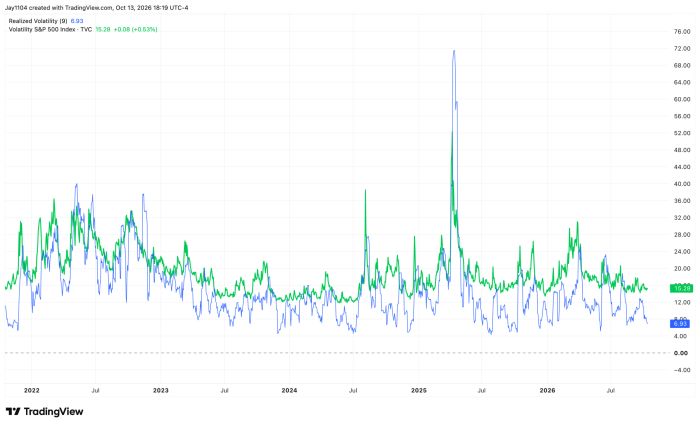
In the meantime, 9-day realized volatility slipped below 7 to 6.93%, putting it in the zone where any move in the S&P 500 of more than about 40 bps will start pushing realized volatility higher. It could certainly keep falling, but that would mean the index can’t move more than 40 bps in either direction. Not long ago, 9-day realized volatility was in the 4s, but again, a measure of volatility is hitting its lower limits.
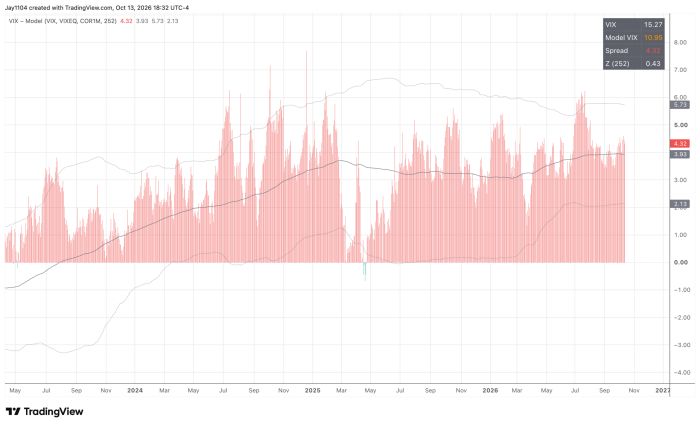
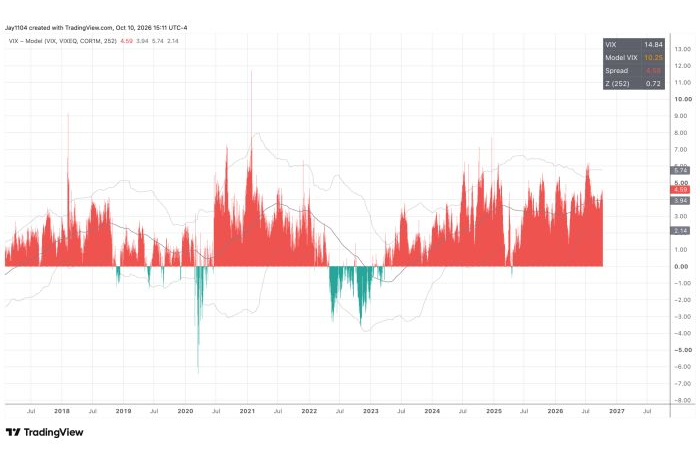
This is where understanding the relationship between implied correlations and single-stock volatility really helps. Even with the decline in realized volatility, the VIX has stayed fairly grounded in the 14 to 16 range, as our model has been telling us. Implied correlations are too low to produce a meaningful drop in the VIX. Even if the 1-month implied correlation index goes to 4 and the VIXEQ goes to 50, the model suggests a VIX of about 10, and if the usual spread stays within 3 to 4 points, we are talking about a VIX of 13 or 14. Could the spread narrow to 2? Sure. But again, we are talking about minor moves lower in the VIX versus the risk of it going much higher.
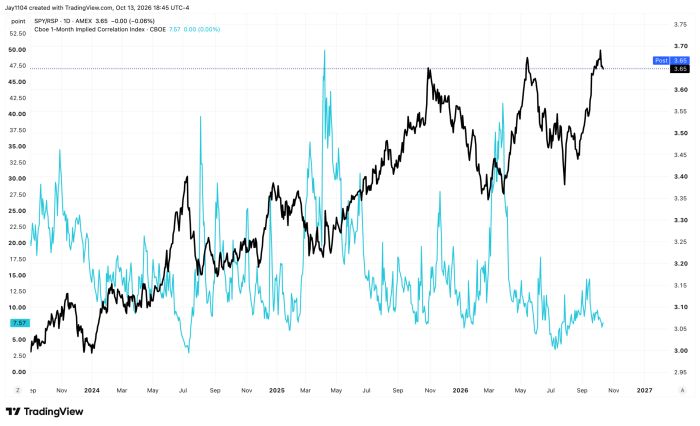
Finally, the SPY-to-RSP ratio is at an inflection point, forming what looks like a triple top, and that probably means the RSP and SPY will become much more correlated in the days ahead. It could mean the S&P 500 falls faster than the RSP, the RSP rises faster than the SPY, or the SPY falls and the RSP rises. Either way, we could be at an important regime shift again.
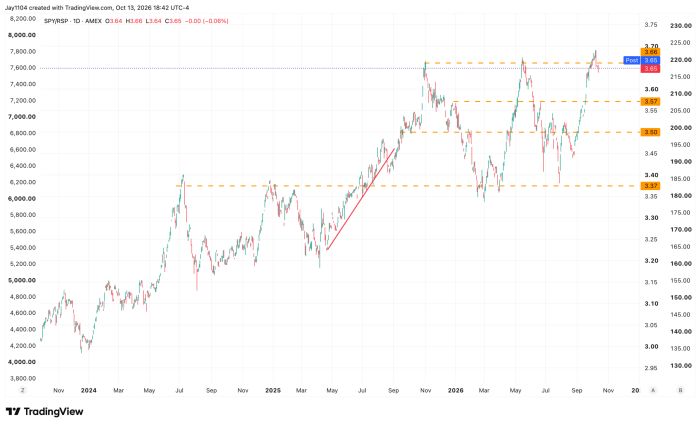
Fun fact: the last couple of times this happened, the SPY-to-RSP ratio implied correlation rose a lot. Volatility ahead is probably pretty likely.


Comments
Log in or sign up to join the conversation.