

The S&P 500 had a rough week, finishing down about 8.5%, and the Nasdaq finished down about 10.5%. Even after that, the S&P 500 is only about 6% below its 200-day moving average, and it was last in this range in March. In previous corrective phases, the index has gotten a lot lower, about 13% below in April 2025, about 17% in the 2022 bear market, and about 25% during COVID.
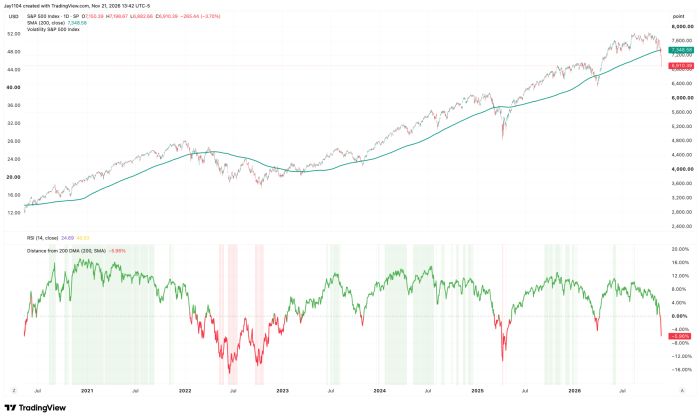
So if this is a deeper correction, there might still be a little further to go. If this is just a sharp V-shaped recovery, then we have probably gone far enough to satisfy it. The only issue I see with a V-shaped recovery is that Nvidia (NVDA) is the key to this, and right now there are lots of questions around Nvidia.
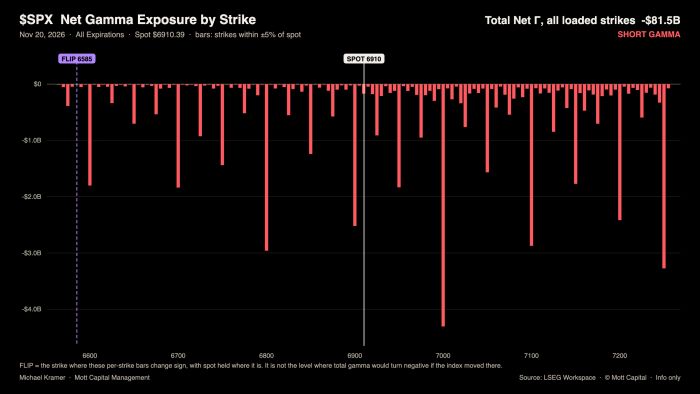
From an options standpoint, Nvidia could keep falling because there isn’t much support until the put wall. The SMH closed Friday right around its put wall, about 23% off its 200-day moving average, and for the S&P 500 the put wall is quite a distance below Friday’s close. The option market and the technical charts align here. If we do not get a rally to start the day on Monday, there could be a little more air underneath us before the market starts finding a floor.
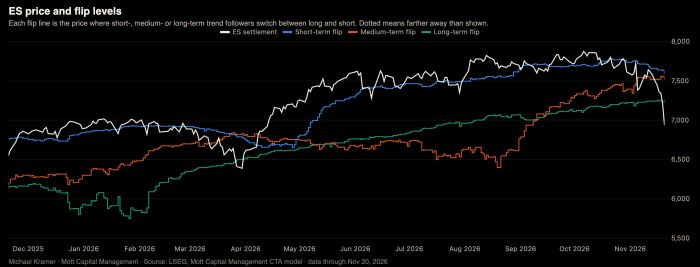
I also built a model that tracks where systematic flows are headed, and it suggests potential for more systematic selling in the S&P 500 and the Nasdaq. Systematic funds don’t look at fundamentals. Rates have come down a little, but they are still higher than they were on November 6, so we are not getting a full flight to safety yet.
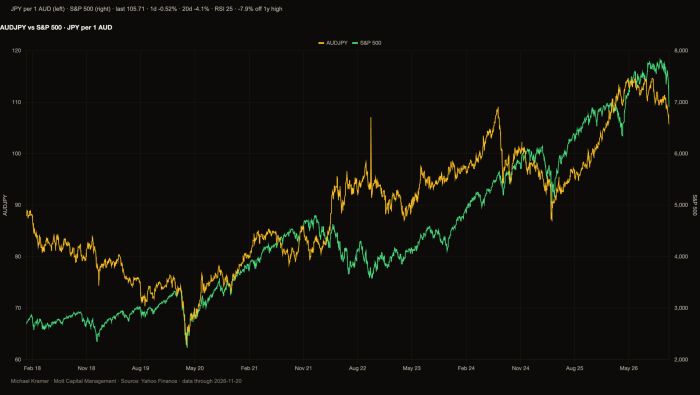
The AUD/JPY is one of the risk gauges I like to watch closely. Its relationship with the VIX has turned positive more recently, and now it is returning to its more inverse nature; the same is happening with the S&P 500. This perhaps suggests global de-risking, with some of the carry trades of the last couple of years beginning to unwind, rates in Japan higher, and the loss of the AI trade in Nvidia.
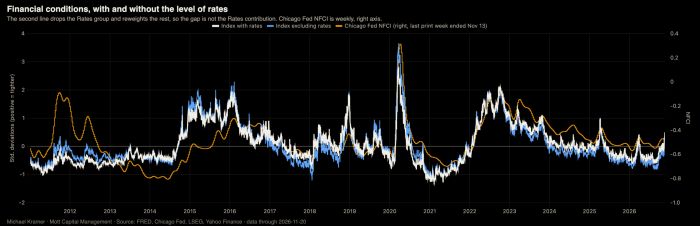
If the sell-off continues, it creates a bit of a problem for the Fed. The financial conditions index I built has tightened a lot over the last couple of days, and if that continues, it will limit how much the Fed can raise rates, because tighter conditions are doing the job for the Fed. It is early for that, and it is more about conditions staying tight for a while. That is what happened in 2015 and 2016, when the Fed raised rates in late 2015, conditions continued to tighten, and it eventually had to back off.
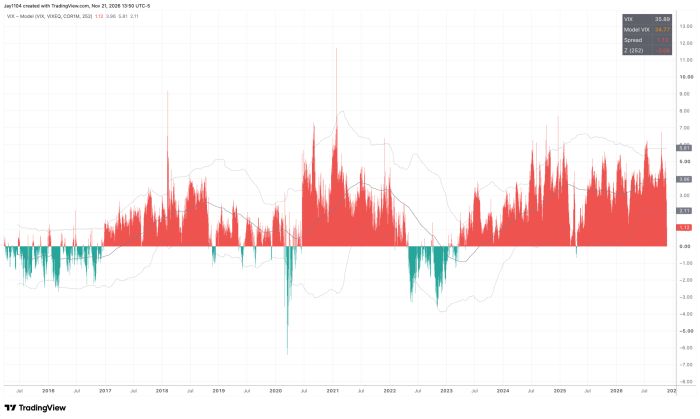
The VIX closed around 36 on Friday, and my VIX model suggests it should be higher than where it is, based on correlations and single-stock volatility. During the 2022 bear market, it inverted and stayed that way until March 2023. If this indicator stays below or near zero for a prolonged period, it could mean the market is assigning all the risk to single stocks rather than the broader index, and that we could be in a longer pullback. Right now we don’t have that signal, but it is worth watching over the next couple of weeks.



Comments
Log in or sign up to join the conversation.