


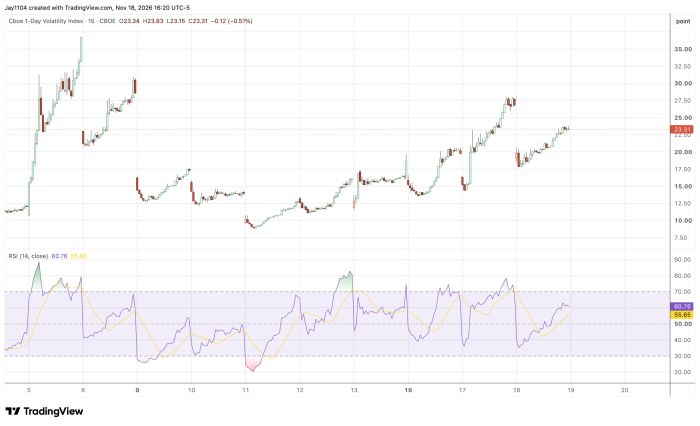
It was a mixed trading session, with the S&P 500 finishing the day down 23 basis points, while the Nasdaq 100 gained 42 basis points. I’m a bit surprised the S&P 500 didn’t rally more today, considering how sharply the 1-day VIX fell at the open, dropping from 26.9 to 19.
Still, the 1-day VIX finished the session at 23.2, leaving room for another decline tomorrow. With little in the way of economic data on the calendar, it’s possible we could see implied volatility come down again. The Fed minutes didn’t appear to play any meaningful role in today’s implied volatility moves.
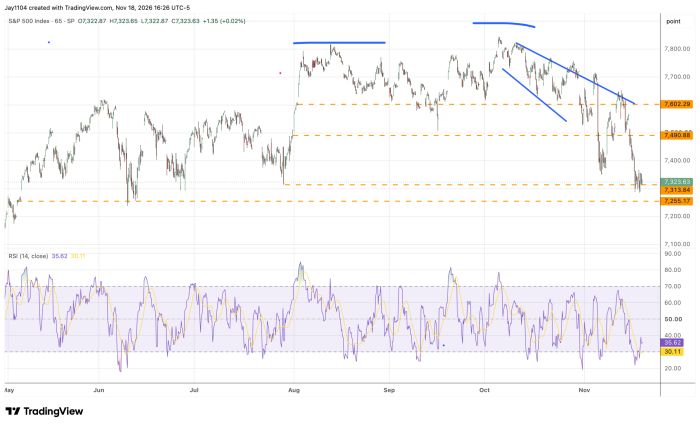
The S&P 500 is sitting on the put wall at 7,300, which is an important support level right now. It would likely take a gap down to push the index below that level, and with monthly options expiration on Friday, I’m not convinced a break of support is likely just yet.
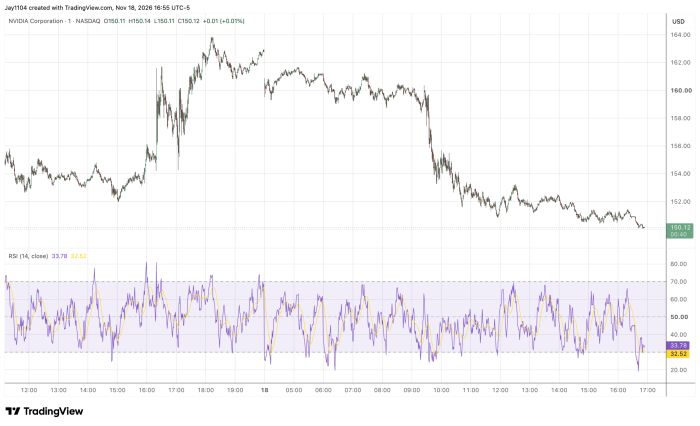
The put wall at $150 held for Nvidia (NVDA) today, and if those puts aren’t monetized soon, we could see the stock snap higher again, even if the move is purely mechanical in nature.
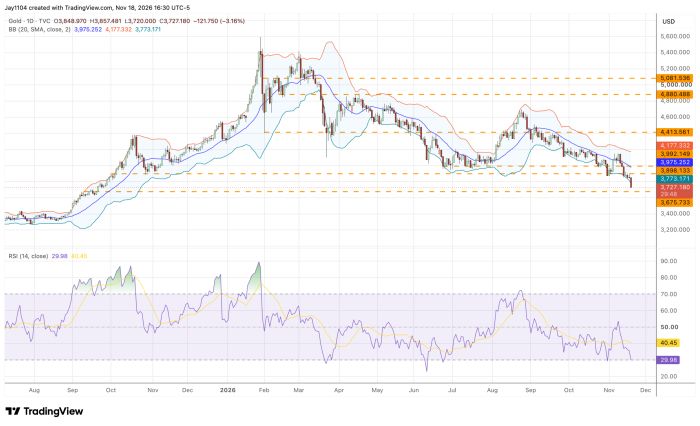
Gold is also breaking support, falling 3% today and now trading around $3,700. At this point, it is starting to look oversold, with the price reaching its lower Bollinger Band and the RSI dipping below 30. A bounce or a period of sideways consolidation seems likely to follow. Whether gold eventually moves even lower will depend on how much further the dollar strengthens and interest rates rise, even if that decline doesn’t happen immediately.
Silver fell by about 5% today, breaking below support around $46.50. It is also approaching oversold conditions, and I wouldn’t be surprised to see the decline pause.
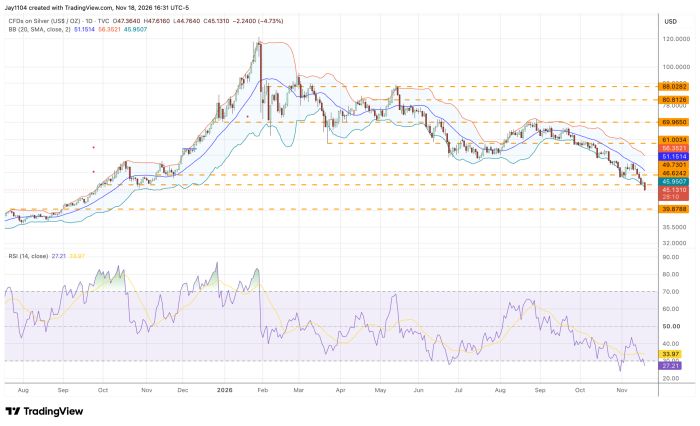
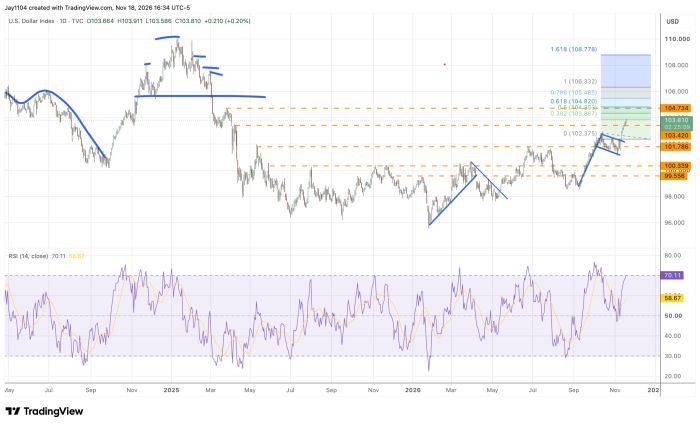
One reason gold and silver are getting crushed is that the dollar continues to strengthen. Unfortunately for both metals, I think the Dollar Index has room to move even higher, potentially returning to around 104.75.
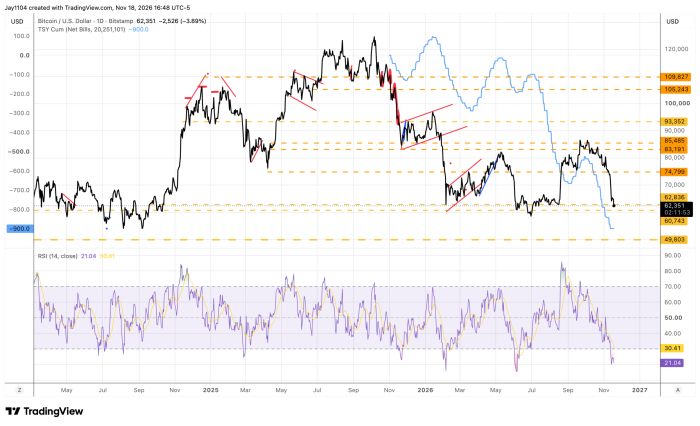
Bitcoin (BTC.X) fell another 4% today and is now sitting on support around $63,000. Tomorrow, another $14.2 billion in T-bills will settle, followed by $51.3 billion on Tuesday, November 24. At this point, I still think there is room for Bitcoin to move lower, potentially heading toward the low-$50,000 range.



Comments
Log in or sign up to join the conversation.