


It will be a shortened holiday week for the S&P 500, but that doesn’t mean it won’t be important, especially after last week’s sharp sell-off. Perhaps most importantly, the market will get the all-important October PCE report on Wednesday. Headline PCE is expected to rise by 0.3% month over month, down from 0.5% in September, while increasing by 3.8% year over year, up from 3.6% in September. Core PCE is expected to rise by 0.3% month over month, matching September’s pace, while climbing by 3.2% year over year, up from 3.1% in September.
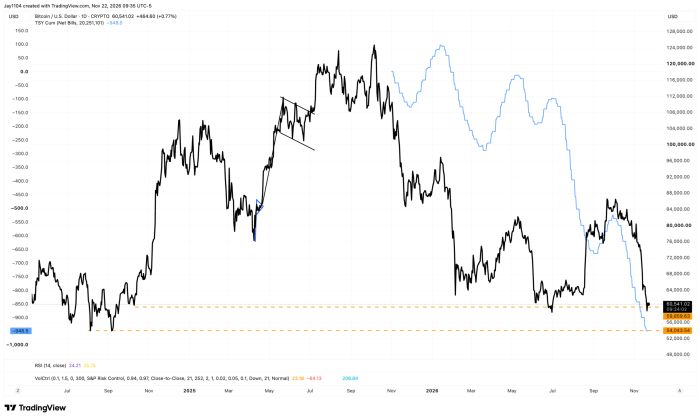
On top of that, this will be a big week for Treasury settlements, with $51.3 billion settling on Tuesday, followed by $28 billion in coupon securities and $16.6 billion in Treasury bills on November 27. With net issuance likely to continue rising through the week of December 7, risk assets are likely to feel the pinch. Bitcoin (BTC.X) certainly has, as it has been testing a break below $60,000 and now faces the risk of a further decline toward $54,000.
Periods of heavy Treasury issuance also tend to coincide with rising implied volatility, and this period has been no different. The 1-day VIX climbed to 51 on Friday, suggesting there is a good chance of a volatility crush on Monday. With the holiday-shortened trading week, implied volatility should fall sharply, potentially helping stocks rally. The question is whether those mechanical forces can overcome the liquidity pressures created by Treasury issuance, even during a shortened trading week. Certainly, Tuesday’s settlement day, along with Wednesday morning’s PCE report, argues against that continuing past Monday.
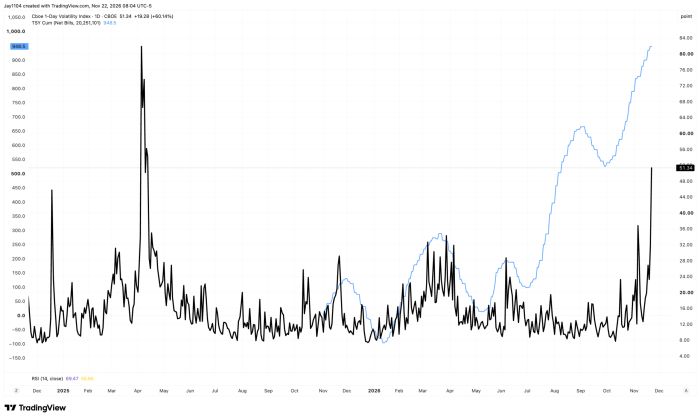
The bigger issue is that any volatility crush is likely to be short-lived, given the high-stakes PCE report on Wednesday. That means implied volatility will probably start to rise again on Tuesday ahead of the report. The biggest question this week is which force will prevail: liquidity pressures or mechanical forces. Given how the market has performed recently, one would think liquidity pressures would win out. The problem is that positioning has become so stretched that it’s difficult to bet against a sharp snapback rally.
In fact, the current heat map of implied volatility and skew shows the top 50 stocks in the S&P 500 clustered in the upper-left corner. At this point, the options market is about as bearish as it can get.
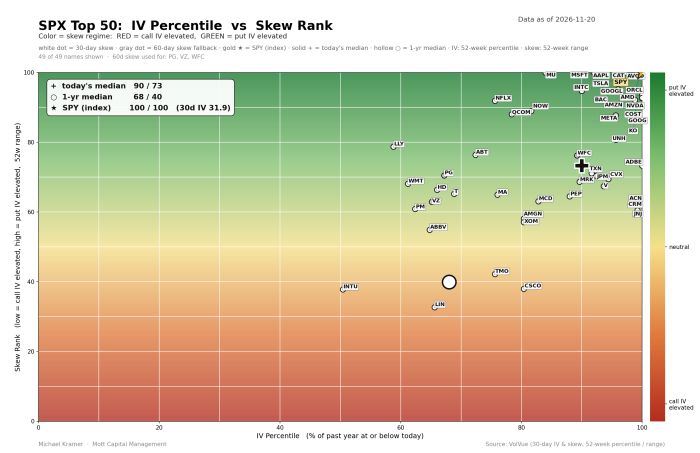
The main difference between this year’s Thanksgiving period and last year is that the circumstances surrounding Nvidia (NVDA) and the broader AI trade are entirely different. Ultimately, if volatility sellers fail to show up this week, it could be a very long week for the markets. With both the VIX and realized volatility at such elevated levels, it seems unlikely that volatility sellers will step in aggressively. On top of that, CTA positioning suggests these strategies are likely to be sellers as well, which could make for a particularly challenging week for stocks.
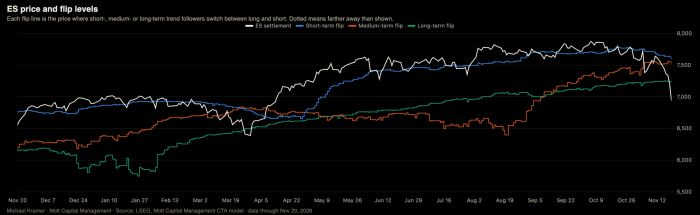
My best guess is that any bounce we see on Monday, driven by the volatility unwind following last Friday’s close, is unlikely to last beyond Monday. From there, the rest of the holiday-shortened trading week could turn into a back-and-forth battle between liquidity pressures and mechanical forces.


Comments
Log in or sign up to join the conversation.