

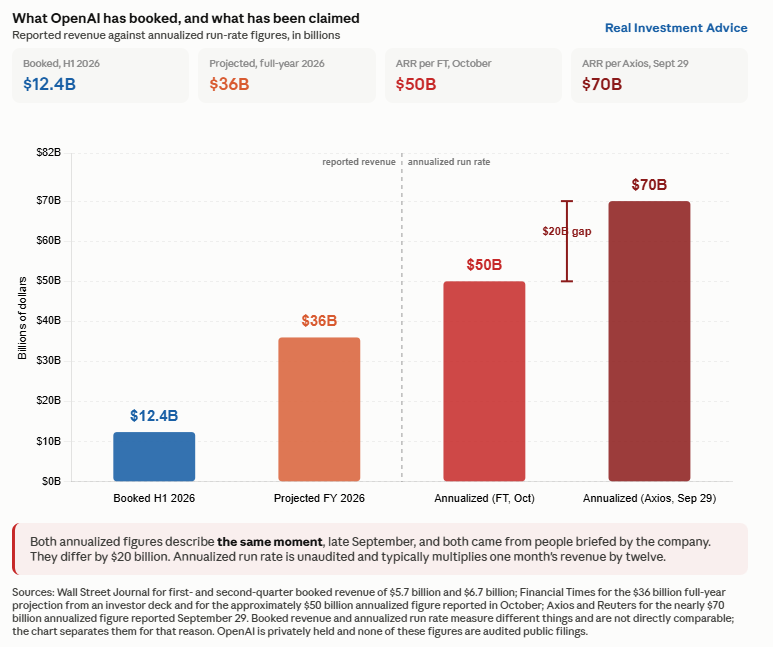
Over the last couple of months, the technology sector has grossly outperformed the market, as many other sectors have fallen victim to higher yields and oil prices. While seemingly immune to the bond market, Tech stocks were hit late last week after the Financial Times reported that OpenAI told investors its annualized revenue was approaching $50 billion as of the end of September. Nine days earlier, Reuters reported the same figure at nearly $70 billion, citing people familiar with the financials. Because OpenAI is private, both estimates came from people employed by or briefed by the company.
The abrupt change in the forecast is probably not deception or a lower revision. It is the annualized revenue metric itself. Annualized recurring revenue (ARR) typically means taking one month’s revenue and multiplying by twelve. Reuters noted the issue in its own story, calling ARR “sometimes misleading” and discussing the multiplication problem. Different months may define recurring differently, and different treatment of enterprise contracts can produce different answers. OpenAI’s ARR numbers are not audited like a public company.
In leaked SEC filings for an IPO, OpenAI reported $5.7 billion of revenue in the first quarter and $6.7 billion in the second, per the Wall Street Journal. That is $12.4 billion in the first half. Per the FT, an OpenAI investor deck in September projected $36 billion for the full year.
So three different revenue numbers describe the same company: $36 billion projected for 2026, $70 billion annualized at the end of September, and $50 billion annualized now. When valuations are based on a self-reported, unaudited metric that can move $20 billion depending on who provides it, the number deserves less weight than it gets, and it certainly shouldn’t affect other companies. However, if OpenAI sees weakening revenue and earnings forecasts, the initial negative impact on technology stocks may be correct. Unfortunately, until OpenAI goes public, it’s largely just a guessing game!
What To Watch Today
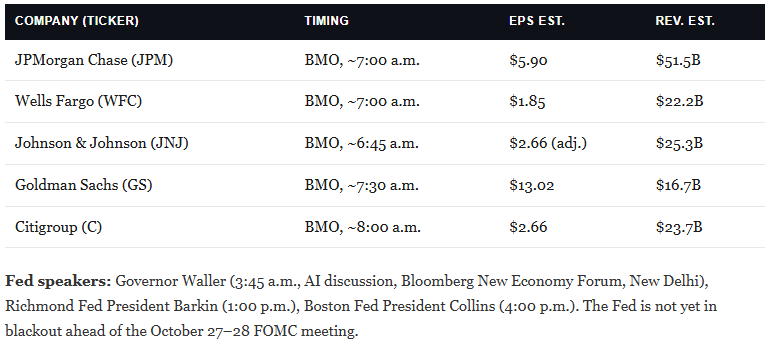
Earnings
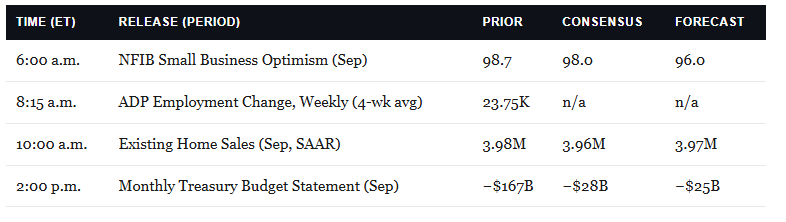
Economy
Market Trading Update
Yesterday, we discussed the bond auctions you never hear about, and our tape read flagged narrow market leadership, with only three of 11 sector ETFs above their 50-day moving averages as the S&P 500 pressed against its record. Today, I want to stay with that thread, because Spencer Jakab at the Wall Street Journal just put a sharper historical frame around it.
To wit: only a third of S&P 500 members traded above their 50-day average on Friday. Since ChatGPT’s release in November 2022, the cap-weighted index has out-earned its equal-weighted twin by nearly 50 percentage points of total return. The kicker is the analog. The same number of trading days after Yahoo’s April 1996 IPO, the gap was almost identical.
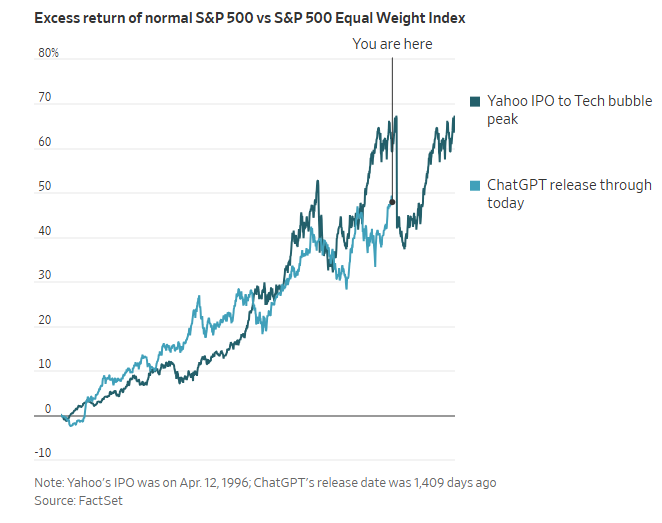
Notice the dark line doesn’t stop at “You are here.” It keeps climbing for the rest of the dot-com run before the reckoning arrives. That’s Bob Farrell’s Rule #4 in one picture. Excesses run further than you think, but they don’t correct by going sideways. The analog doesn’t tell you to sell today. It tells you how the reversal behaves when it finally comes.
Our own read of the RSP/SPY price ratio says the rubber band is badly stretched. The ratio set a three-year low on October 7, and its September month-end was the weakest in the decade of data we pull. It sits 2.9% below its 50-day average and 4.2% below its 200-day. Equal weight actually led into late February, and the ratio has given back 8.4% since its February 27 peak. Three closes below the lower 2-standard-deviation band in September, plus an RSI that touched 21 last week, tell me this move is mature.
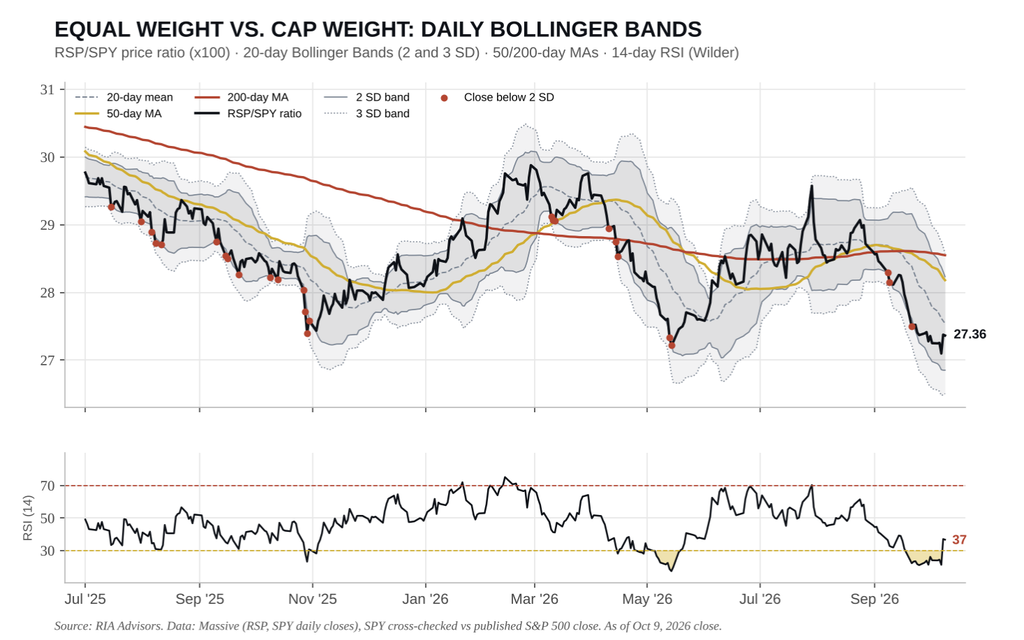
Of course, the “breadth doesn’t matter” crowd has a point. The skeptic’s rebuttal writes itself: “Stocks have been narrow for three years, and the index keeps rising.” Fair enough. Jakab concedes that short-term breadth readings usually flag only minor pullbacks. BUT he also shows equal weight has beaten the S&P 500 since 1990. When it wins, it catches up far faster than it fell behind. Such is the nature of a rubber band.
So, what do we do? We don’t abandon the leaders over one chart. We also don’t add money to the most crowded trade in the market. The big banks kick off earnings season this morning, and that’s a good moment to act. In the Equity Aggressive Growth model, we’re trimming mega-cap technology winners back to target weight, and the proceeds are going toward equal-weight laggards with improving relative strength, while stops on the leaders sit close to their 50-day averages. The gap can stretch further, as long as you aren’t the one holding the overweight positions when it snaps back. Nobody rings a bell before a rubber band breaks. It just hurts the hand holding it.
Breadth Moderates- Year-End Rally Ahead?
This past weekend’s Bull Bear Report laid out a condition that would make us more comfortable about a bull market into year-end. To wit:
Oversold sectors are exactly where a broadening move has to come from, and the equal-weight index outperformed this week. But the defensive rally came as semiconductors fell 4.5%, with chips driving earnings growth. Evercore also counts a record 140 S&P 500 members with negative beta, per Friday’s commentary. A record standing on a few names is NOT the same as a broad advance.
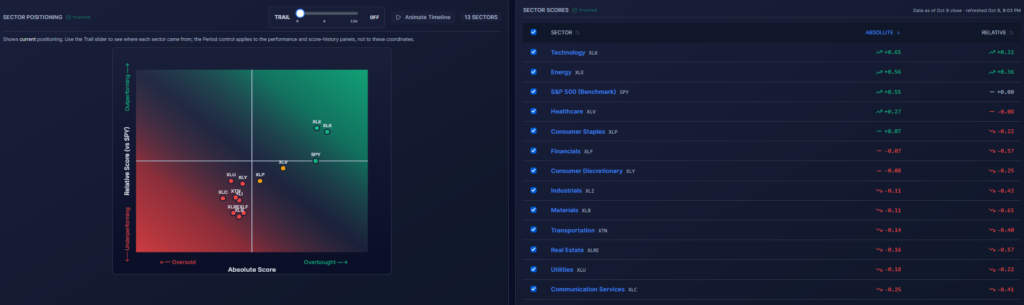
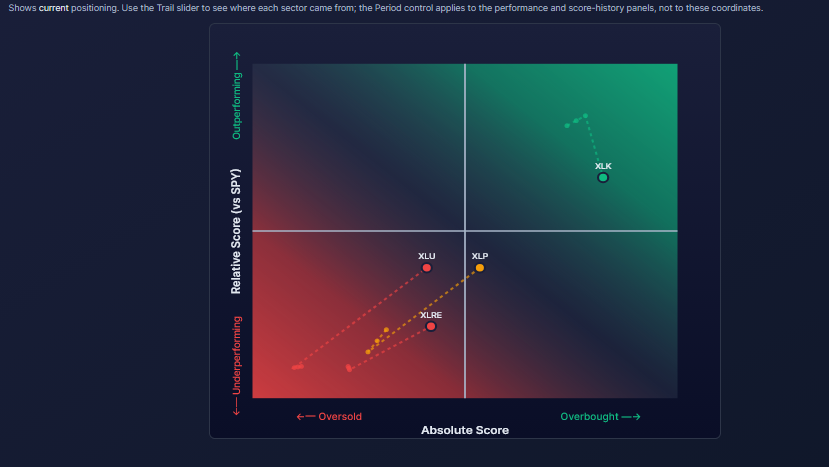
Breadth did improve last week. As we share below, the scores for the sectors have all gravitated toward fair value- the center of the graph. The bottom graph isolates the changes in the absolute and relative score for the most overbought sector Technology and those most oversold like Utilities, Real Estate, and Staples. While dispersion is still wide, trading over the last week is a little more encouraging. It also leads to a question of whether the years underperformers will lead a year-end rally with the high flying technology sector falling back. Earnings, which will come out for the banks this week, and the majority of companies over the next few weeks may be an indication of whether that can occur.
Bonds At 5%: Is The Ten-Year Treasury Finally A Buy?
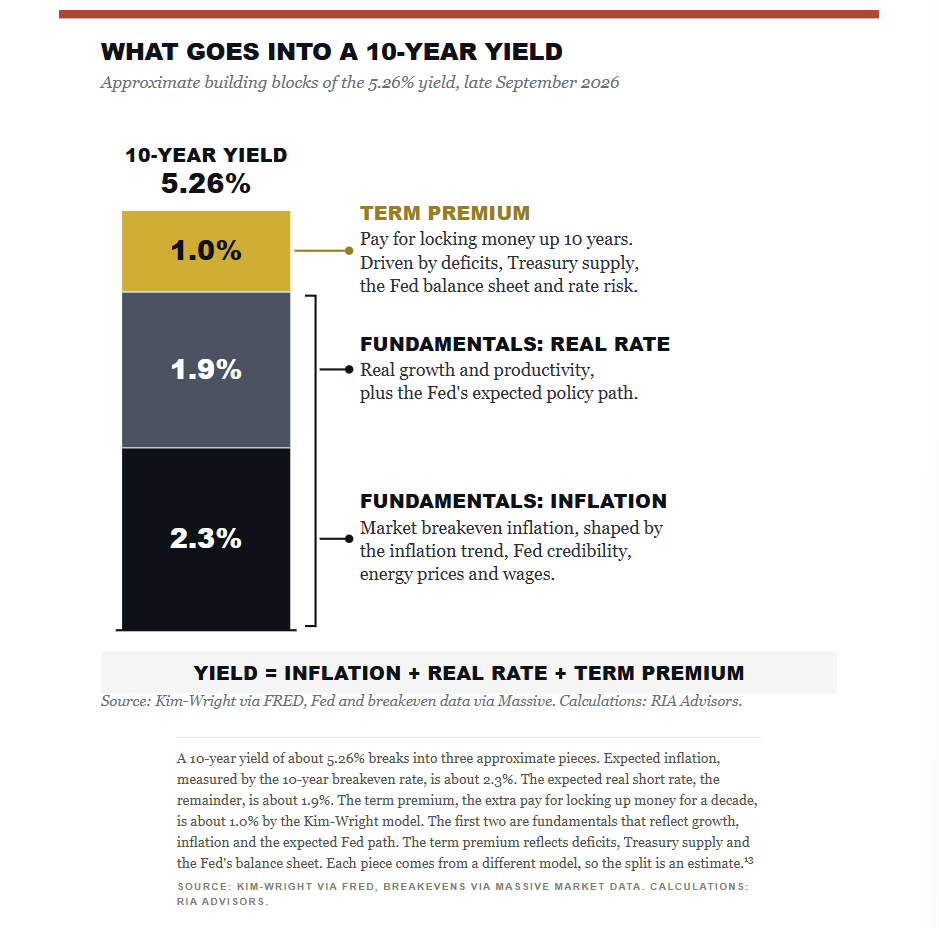
The 10-year Treasury yield closed September north of 5.2%, the highest level in roughly 24 years. Most of the headlines treat that as a warning. I think it’s the most interesting opportunity investors have seen in bonds since before the Financial Crisis. The question I keep getting is simple: are bonds at 5% actually worth owning, or is this just another trap after the worst bond bear market in modern history?
That answer depends on three things that most mainstream coverage skips.
How bonds are priced,
Why do you own them in the first place, and
What the starting yield tells you about the decade ahead.
Let’s work through each one.
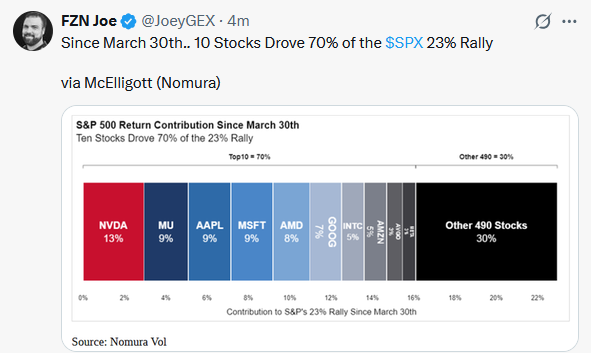
Tweet of the Day

Comments
Log in or sign up to join the conversation.