


Diversification is the practice of accepting a lower potential return to reduce risk and increase the likelihood of reaching your financial goals. A recent NFL game clearly illustrated the value of managing portfolio risk.
The Tampa Bay Buccaneers led the Dallas Cowboys 24-10 with 8:36 remaining. With the lead and a likely victory, the Buccaneers faced fourth-and-goal from the Cowboys’ one-yard line. They had two options.
A chip-shot field goal would have made it 27-10, a three-score game. Doing so would have forced the Cowboys to score three times in under nine minutes. Two of those scores had to have been touchdowns.
Go for the touchdown, which is the option they chose. The Buccaneer’s running back did not score. Within minutes, Dallas drove 99 yards, made it a one-score game, and had plenty of time left to play good defense, get the ball back, and try to tie it up.
The Buccaneers held on and won 24-16. Buccaneers coach Todd Bowles was asked about the questionable decision afterward and said, “We talked about it, and I knew three was better,” yet he went for seven. Bowles admits the low-risk option was sufficient to win. But while pushing for a higher score, he nearly turned a near-certain win into a loss.
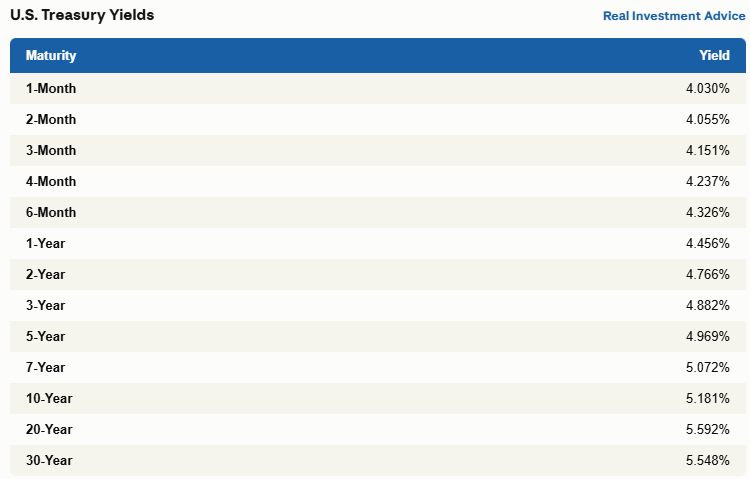
Investors face the same decision today. A five-year Treasury offers 5% returns and roughly 9.4% if yields fall a point. Yields would have to climb 116 basis points before a 5-year buyer loses anything. Moreover, if they hold the bond to maturity, they lock in 5%. Stocks may outperform 5%, but an investor already ahead in the race to fund retirement does not need to maximize the margin. They need to avoid losing.
This is not a message to sell stocks and buy bonds, but properly adjusting your stock-bond allocation for potential risks and returns can give you a better chance of winning the ultimate game: meeting your financial objectives.
What To Watch Today
Earnings
Economy
Market Trading Update
Yesterday, we looked at how narrow leadership has pushed the equal-weight index to a three-year relative low, and why we’re steering trimmed mega-cap gains toward lagging groups. Tuesday’s big bank earnings reports put one of those laggards under the microscope. The message was far more split than the headlines suggest.
Goldman Sachs blew the doors off, earning $17.01 a share against estimates near $13. Equities trading revenue jumped 72% from a year ago. JPMorgan posted a “rare” miss at $5.57 versus roughly $5.90. Jamie Dimon conceded that trading and dealmaking “did moderate somewhat during the quarter.” Wells Fargo squeaked past on earnings at $1.87, but revenue and net interest income both came in light.
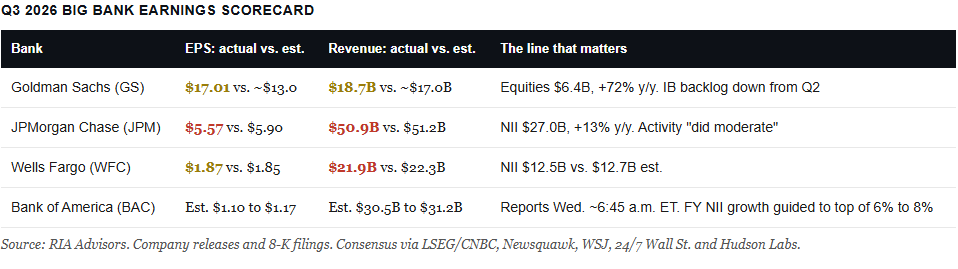
Here’s where it gets interesting. The firms tied to trading, deals, and financing are booming, while the lenders grind through thinner margins. When Wall Street’s trading desks outrun Main Street’s loan books, you are usually closer to the end of a cycle than the beginning. Goldman also disclosed that its investment banking backlog fell at the end of June. That pipeline is the forward-looking number, and it’s shrinking.
A skeptic in the back row would ask, “If the banks are posting near-record quarters, why have the stocks gone nowhere?” The market priced the good news in by summer. Our equal-weight composite of JPM, GS, BAC, and WFC peaked on August 12 and closed Monday 11.1% below that high. Notice in the chart below that it now sits 6.4% below its 50-day moving average and about 1% below its 200-day moving average. RSI reads 38 after dipping under 30 last week.
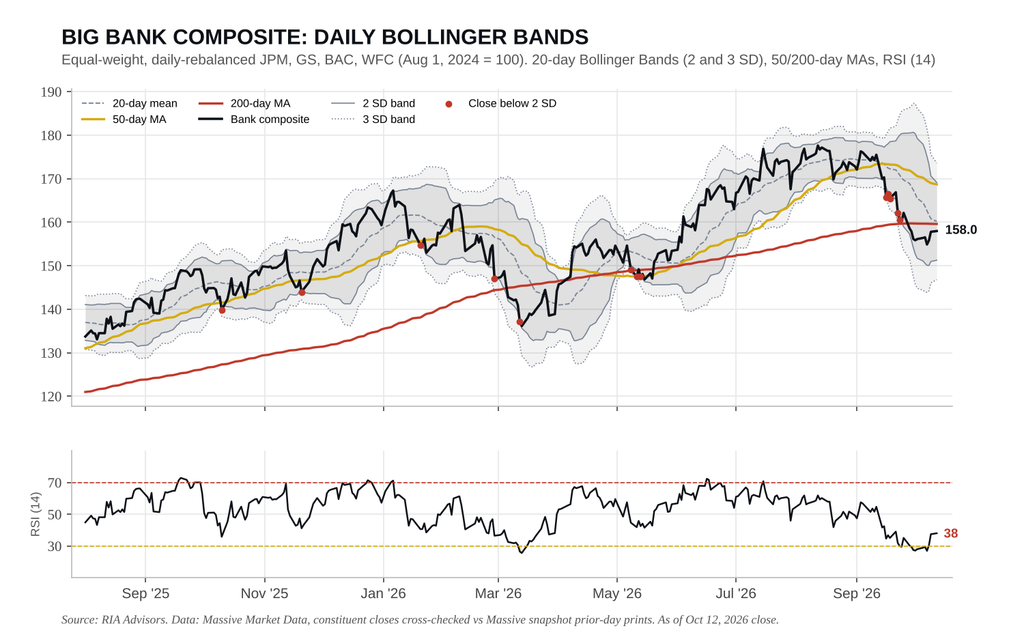
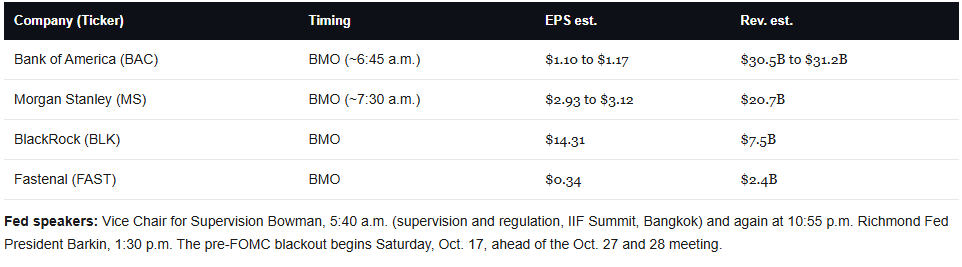
That’s an oversold bounce attempt, NOT a confirmed turn. “Banks always beat in October” was about as consensus as it gets. This morning brings the second test, as Bank of America and Morgan Stanley report before the open alongside September CPI. Bank of America sits squarely on the lending side of this split. Its net interest income guidance matters more than any headline beat.
Here’s how we’re handling it. The composite’s 200-day average near 159.6 is the line, and we’ll respect it rather than argue with it. In the Equity Aggressive Growth model, we’ve added to our financial holdings and increased weights slightly heading into earnings. We favor the capital-markets names over pure lenders, with stops just under the October 7 low near 154.9. A failure there opens the lower band near 151.
Such is the nature of late-cycle earnings. The best quarters tend to arrive right before the worst guidance.
Banks Kick Off Earnings Season
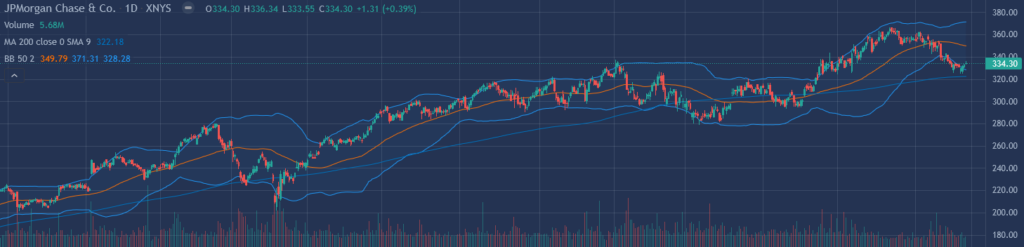
JPMorgan missed on earnings Tuesday, reporting $5.57 per share compared to expectations of $5.90. JPM shares rose despite the miss, as the underperformance came from markdowns in its corporate book due to higher yields and wider spreads, rather than its loan book. Outside of EPS, everything else was good, with net interest income up 13% and net income of $15.3 billion, up 6%.
Credit improved across the board. Provisions for losses fell 19% year over year to $2.7 billion. This signals JPM’s positive outlook for its loan book. This optimism likely stems from a decline in net charge-offs to $2.2 billion from $2.4 billion in the second quarter and $2.6 billion a year earlier. Furthermore, its credit card services net charge-off rate fell to 2.91% from 3.34% last quarter, well below the roughly 3.2% full-year rate management guided to last quarter.
Goldman Sachs blew out EPS, posting $17.01 versus roughly $13.07 expected. Revenues were up 23%, with equities revenue up 72%. It also added a $368 million loss provision, driven by impairments on wholesale loans.
Credit is not deteriorating at the consumer level. Card losses are falling at JPM, the country’s largest card issuer. Instead, credit concerns appear to be increasing at the commercial level, as both firms are building reserves against wholesale and commercial exposures.
CPI Preview
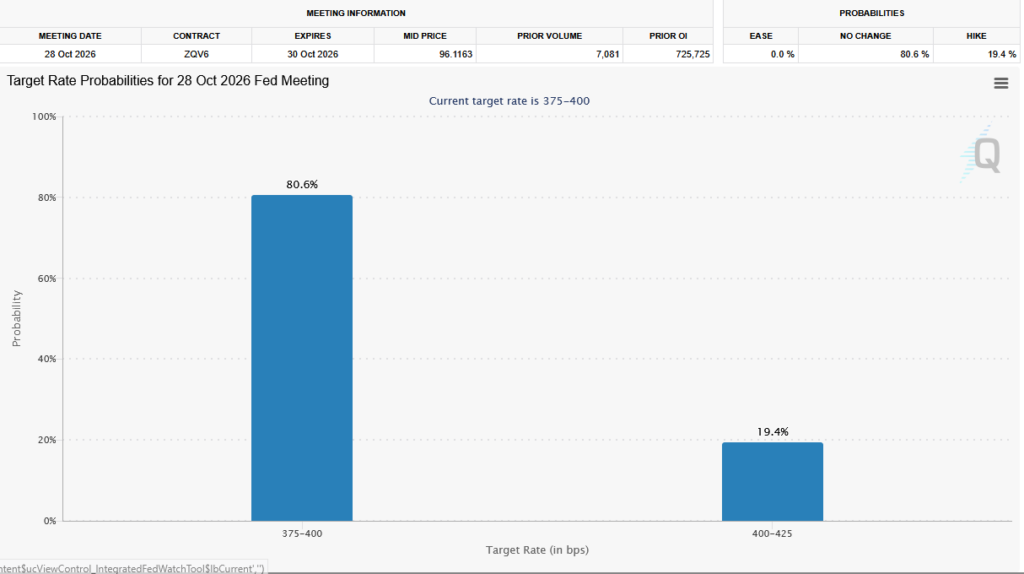
Today’s CPI report may be the tail wagging the Fed’s rate decision on October 28th. Accordingly, let’s review expectations and consider how various scenarios could impact the outcome from that meeting.
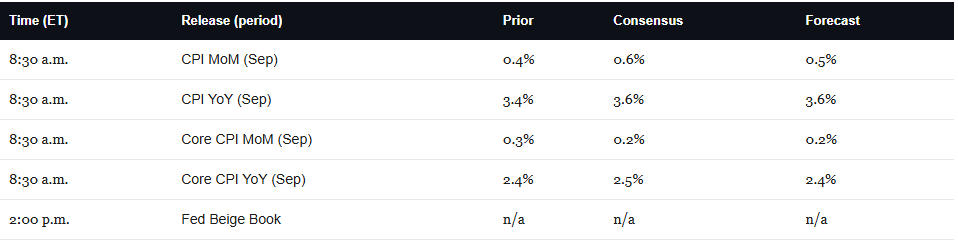
Wall Street expects headline CPI of 0.5% monthly and 3.6% annually, with core at 0.2% and 2.4%. As we share below, the Fed Funds futures market has largely stopped expecting a hike. October odds sit near 20%, down from above 60% three weeks ago, after core PCE came in at 3.0% against a 3.4% estimate and September payrolls were a paltry 29,000 with 60,000 in downward revisions.
A core CPI print at or below 0.2% likely confirms market expectations and makes an October hold likely. The next rate hike debate would shift to December.
A core print at 0.3% or higher could change rate expectations. It would validate Lorie Logan, who estimates another 50 basis points or more is needed, and the September minutes, which showed most participants expecting another increase by year-end.
Despite the high CPI expectation of 0.5%, the market and Fed will likely look through it, as it’s largely driven by oil prices.
Tweet of the Day


Comments
Log in or sign up to join the conversation.