


AI boom encounters the ancient discipline of cash flow
Wall Street has rediscovered an old principle: money spent is not quite the same thing as money earned. Amazon (AMZN) and Microsoft (MSFT) reported results that were, in the customary fashion of the AI age, spectacular by ordinary standards and merely adequate by the standards investors had already capitalized in their expectations. Revenue surged, cloud demand accelerated, backlogs expanded, and profits exceeded estimates. The surprise was not that artificial intelligence continues to grow. The surprise was that investors welcomed the growth even after being reminded of its prodigious appetite for capital.
This year, announcements of larger AI budgets were treated as confessions of fiscal imprudence. Meta (META), Oracle (ORCL) and other large technology companies have discovered that Wall Street admires investment in the future most enthusiastically when someone else is paying for it. Amazon’s latest report may mark a subtle change in that disposition. AWS revenue increased nearly 37%, its fastest growth in 18 quarters, while Amazon’s AI and custom-chip businesses each surpassed a $25 billion annualized revenue run rate. The company nevertheless raised expected 2026 capital expenditures to approximately $220 billion. Trailing 12-month free cash flow fell from an $18.2 billion inflow a year earlier to a $7.6 billion outflow, primarily because property and equipment purchases increased by $66.1 billion. Yet investors applauded rather than fled. Amazon’s second-quarter release supplied something the market had been demanding: evidence that the enormous spending is being matched by enormous demand and that the return on capital investment would be months, not years.
Microsoft offered the complementary argument. Its software and cloud franchises continue to generate the cash needed to finance their own expansion. Microsoft Cloud revenue rose 27% to $59.3 billion, while contracted work- awaiting recognition—jumped 84% to $678 billion. Microsoft is not immune to the cost of AI infrastructure, but it remains the member of the hyperscaler fraternity most able to pay the initiation fee from current earnings. Snow was our favorite software play, overcoming the vulnerability fear of AI removing barriers to entry. We would add Microsoft to our short list of companies that should benefit from AI this year and next. Microsoft’s fiscal fourth-quarter results reinforced its status as both an AI builder and a toll collector.
The distinction is becoming essential. The first phase of the AI boom rewarded companies for announcing capacity. The second will reward them for monetizing it quickly.
Capital expenditure is not a sacrament
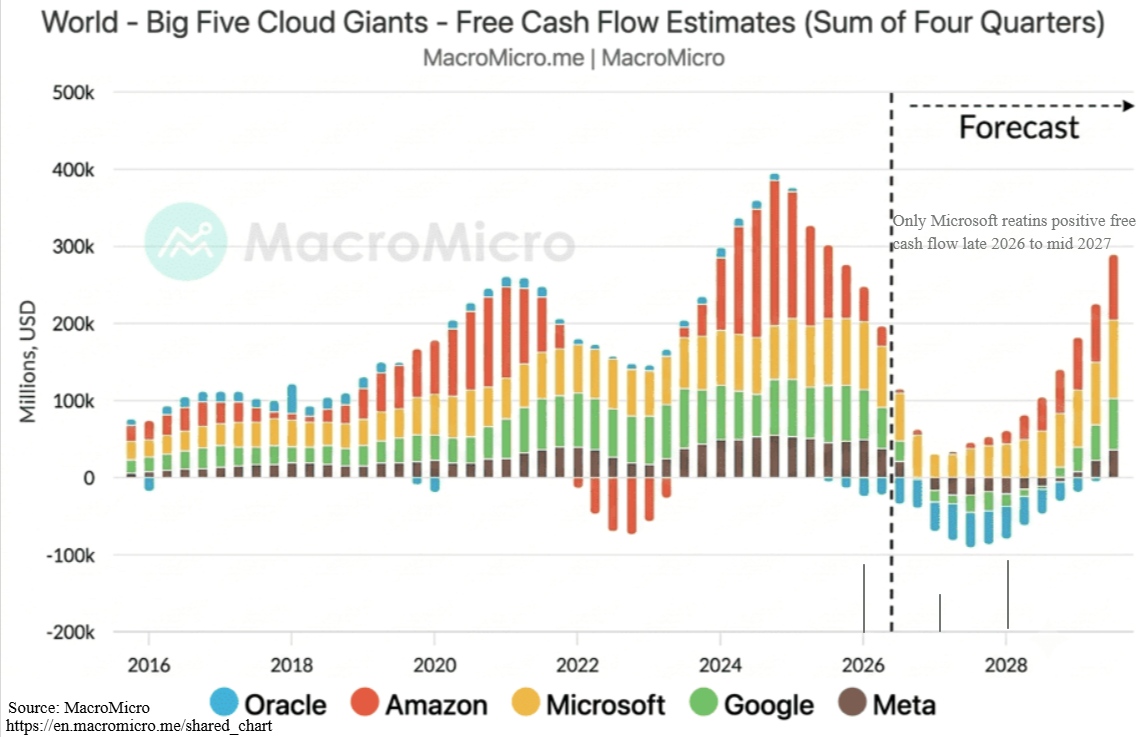
Amazon’s free cash flow was approximately $38 billion in 2024, fell sharply in 2025, and has now turned negative on a trailing basis. Current forecasts contemplate another large cash deficit during the peak 2026 construction cycle, followed by a powerful recovery in 2027 and 2028 as completed data centers begin producing revenue. That projected recovery is not guaranteed, but Amazon has a more credible case than many competitors. Its AWS backlog has risen toward $500 billion, cloud growth is accelerating, and demand for computing capacity continues to exceed supply. Much of the capacity is being constructed against identifiable demand.
This separates Amazon from enterprises whose capital-spending plans require investors to accept a longer engagement before seeing any financial consummation. Meta must prove that AI spending can materially improve advertising efficiency, engagement and new-product economics. Oracle must show that its vast cloud commitments can be financed without turning the balance sheet into an artifact from the 1990s tech boom and bust.
The free-cash-flow chart of the five cloud giants illustrates the issue vividly. Aggregate cash generation falls sharply as AI investment crests, with several companies temporarily dropping below zero. Microsoft alone appears positioned to remain consistently positive through the investment trough.
From chips to software—and from glamour to price
The stock market’s recent behavior suggests that investors are beginning to distinguish between AI beneficiaries rather than purchasing the entire theme as though it were an index fund with a halo. Semiconductor shares have endured significant profit-taking after a nearly parabolic advance. Some leveraged funds appear to have encountered margin pressure, turning an orderly rotation into a more indiscriminate liquidation. The companies have not suddenly stopped growing, far from it. Their stocks have merely encountered the inconvenient fact that even excellent businesses can become temporarily poor investments when everyone already owns them.
This week’s response to Amazon and Microsoft is therefore encouraging. Buyers returned to both the infrastructure and software sides of the AI economy despite elevated capital spending. That suggests the sector may be approaching a tradable low—or at least the end of the period in which every additional data-center dollar is automatically treated as evidence of managerial misconduct.
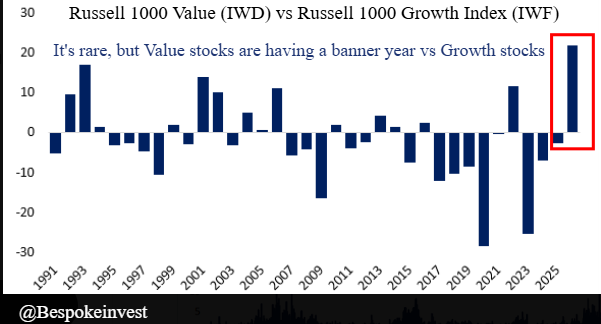
Still, the leadership beneath the major averages has changed. Value stocks are enjoying one of their strongest years relative to growth stocks in decades. Financials, industrials, telecom companies, selected consumer businesses and smaller-capitalization stocks have benefited from lower valuations, improving earnings and the search for shelter from overcrowded AI trades. Yesterday’s neglected bench players have become today’s starting lineup, partly because they improved and partly because the stars became expensive enough to require perfect weather to stay in the game.
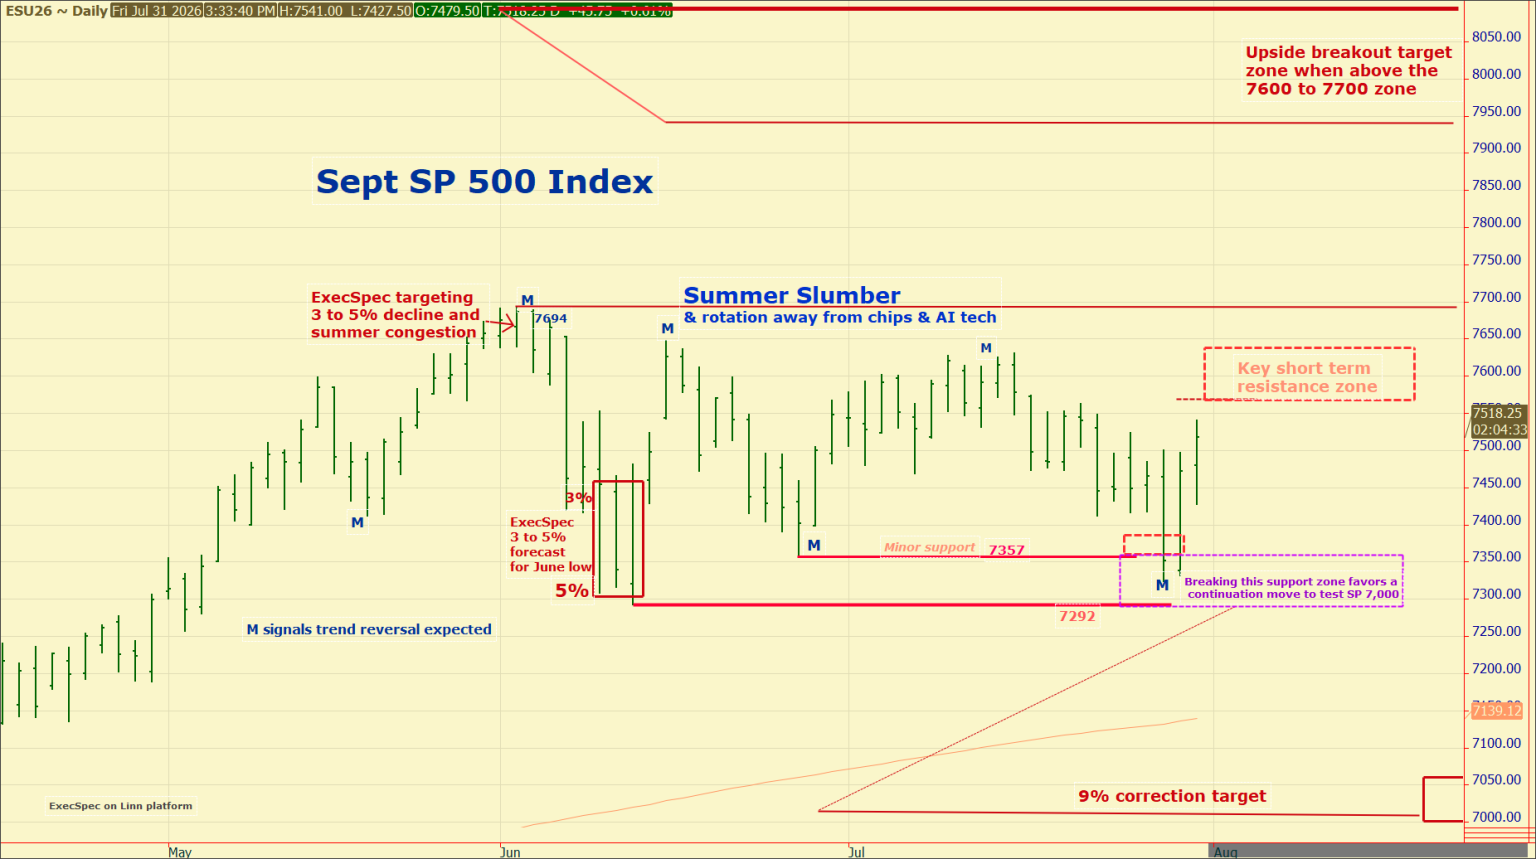
The summer slumber
For three months, the S&P 500 has been compressed inside a narrowing trading range of approximately 5%. The index is up roughly 9% for the year—a perfectly respectable return rendered strangely disappointing by the spectacular gains that preceded it—and remains only about 2% below its record high.
The chart resembles a coiled spring. Unfortunately, springs do not disclose the direction in which they intend to uncoil.
The September S&P futures chart defines the battlefield:
The 7,600–7,700 region remains the principal resistance zone.
A sustained breakout above 7,700 would target approximately 7,950–8,100.
Initial support resides near 7,350.
The summer low near 7,290 is the more consequential dividing line.
A decisive break below 7,290 would favor an eventual test of 7,000.
Our base case continues to allow for another downdraft beneath the summer lows before November. Yet the market has shown no eagerness to cooperate with either bulls or bears. It has instead practiced the bipartisan art of postponing difficult decisions. Neutral sentiment, strong earnings and broad economic resilience argue against assuming that a breakdown is inevitable. Conversely, elevated valuations, higher bond yields and a still-crowded technical condition argue against treating every modest decline as an engraved invitation to buy. A range-bound market requires a catalyst. Until one arrives, rallies toward resistance are likely to attract sellers and declines toward support are likely to summon buyers.
Breadth: resilient, but hardly washed out
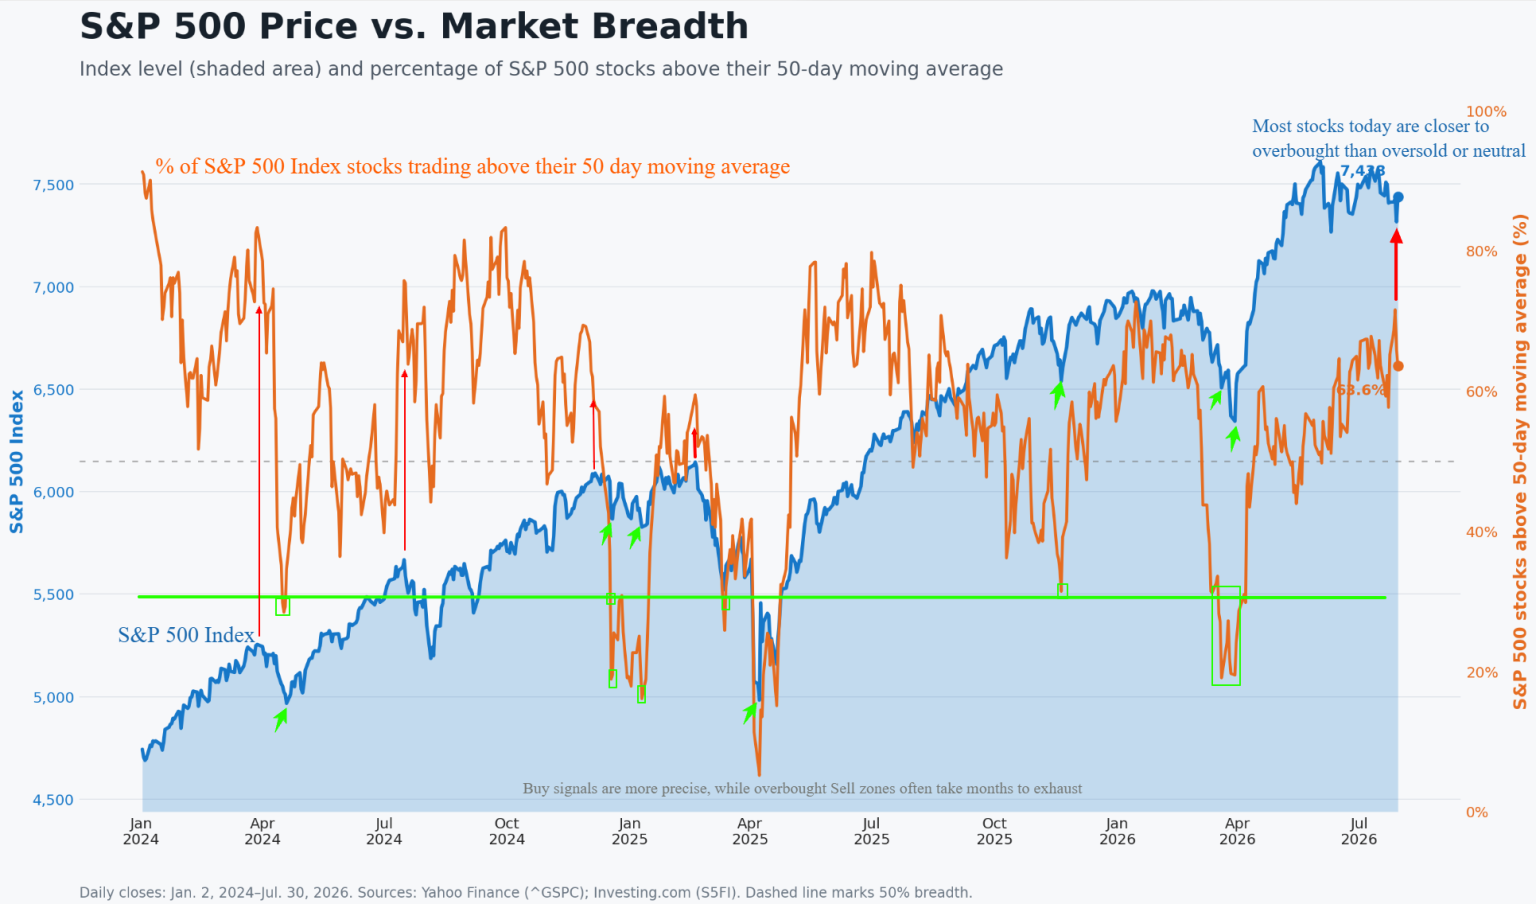
The market-breadth chart helps explain why the averages remain resilient despite the damage in prominent chip and AI shares. Approximately 64% of S&P 500 constituents remain above their 50-day moving averages. This is not an extreme overbought reading, but neither is it the despondent condition normally associated with a durable trading low. Most stocks are closer to technically extended than deeply oversold. The history since January 2024 shows that breadth readings near or below 20% have produced more precise buying opportunities. High readings above 70% have been less punctual as sell signals; markets can remain broadly overbought for months, particularly when earnings and liquidity are supportive. Breadth is therefore a thermometer, not a calendar. The current reading says that the fever in chip stocks has not infected the entire market. It also says there is considerable room for participation to deteriorate if a fundamental shock arrives. The market is healthy enough to resist ordinary bad news but not cheap or oversold enough to be immunized against consequential bad news. That distinction will matter as autumn approaches.
The bond market is revoking the easy-money assumption
The most immediate threat to equity valuations is not an earnings recession. It is the rising price of money. The 10-year Treasury yield has climbed to approximately 4.74%, near an 18-month high, while 30-year mortgage rates have returned to roughly 6.8%. A move toward 5% on the 10-year would exert increasing pressure on housing, capital spending, leveraged acquisitions, and the valuation of long-duration growth stocks. The stock market can tolerate elevated interest rates when profits are rising rapidly. It becomes less tolerant when rates continue climbing after optimistic earnings assumptions have already been discounted. Inflation provides the bond market with ample reason for vigilance. June headline PCE inflation eased from 4.1% to 3.7%, while core PCE moderated only slightly to 3.3%. Both remain well above the Federal Reserve’s 2% target.
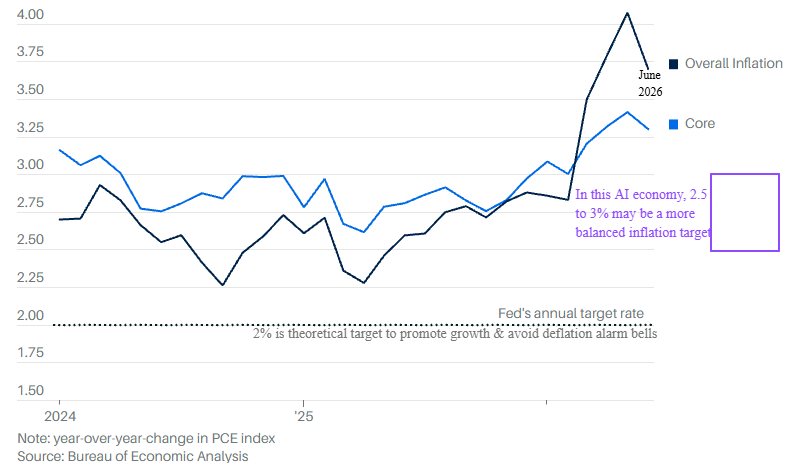
The Bureau of Economic Analysis also reported that consumer spending increased 0.3% during June. The inflation news is improving, but “less bad” is not a synonym for “solved.” In an economy being reshaped by AI investment, a core inflation rate between 2.5% and 3% may eventually prove compatible with healthy growth and productivity. Federal Reserve officials, however, cannot formally abandon the 2% target and adopt a higher conclusion without appearing to redefine victory after failing to capture it. Chairman Kevin Warsh therefore confronts an unenviable choice. The institutional hurdle for raising rates immediately before the November elections is high. Yet robust consumer spending, immense AI capital expenditures, elevated energy prices and rising long-term yields may force the Fed to contemplate a September increase. The Fed prefers not to surprise markets; thus, if investors maintain a high odds of a rate hike into late September, Warsh may be obliged to accommodate.
Iran, energy and the September decision
The most important swing variable may reside in the Strait of Hormuz. A meaningful de-escalation by Iran’s Islamic Revolutionary Guard Corps would likely reduce oil prices, restrain headline inflation and relieve pressure on Treasury yields. Under that scenario, the case for a September rate increase would weaken considerably. Falling energy costs might allow the Fed to remain patient while the previous inflation shock continues to work its way out of the annual comparisons.
But peace requires tankers to move, insurance costs to fall, and physical energy flows to normalize. Tehran’s IRGC has demonstrated an unwavering desire to keep this war going, which favors elevated energy prices and more pain for Iran and its neighbors. The bond market is already beginning to reach that conclusion on the Fed’s behalf.
Investment conclusions
The present market is neither a bubble awaiting a pin nor a bargain awaiting recognition. It is a profitable, expensive and increasingly selective market caught between powerful earnings and a rising cost of capital.
For investors, several conclusions follow:
AI remains a secular investment boom, but cash flow now matters.
Companies able to demonstrate visible demand, backlog growth and relatively short payback periods should command a premium. Capital spending without measurable monetization will receive progressively less indulgence.Software may stabilize before hardware completes its correction.
Microsoft’s recurring revenue and superior cash generation provide insulation that pure infrastructure suppliers lack. Chip shares can rebound sharply, but their previous ascent created both substantial profits and substantial temptation to realize them.Value leadership deserves respect.
The unusually strong relative performance of value stocks is not merely defensive. It reflects a broadening of earnings leadership and a reappraisal of companies that entered the year with modest expectations and reasonable valuations.Market breadth argues against complacency, not necessarily against stocks.
With roughly two-thirds of S&P 500 members above their 50-day averages, the market is resilient but not washed out. Better buying opportunities would likely accompany a deeper breadth contraction.The 7,300–7,700 range should govern near-term positioning.
Above 7,700, the technical target becomes 7,950–8,100. Below 7,300, the probability of a 7,000 test rises substantially. Between those levels, discipline is more useful than prediction.The 10-year Treasury yield may be the market’s most important ticker.
A retreat in yields would support technology valuations and improve the odds of an upside breakout. A sustained move toward or above 5% would threaten both housing and high-multiple equities.
Our preference remains to maintain liquidity, add selectively during weakness, and resist chasing either the most glamorous AI rebound or the most fashionable value rotation.


Comments
Log in or sign up to join the conversation.