

SPX Monitoring purposes; Covered 1/24/22 open 4356.32=7.57%; Short SPX 1/11/22 at 4713.07.
Monitoring purposes GOLD: Long GDX on 10/9/20 at 40.78.
Long Term SPX monitor purposes; Neutral
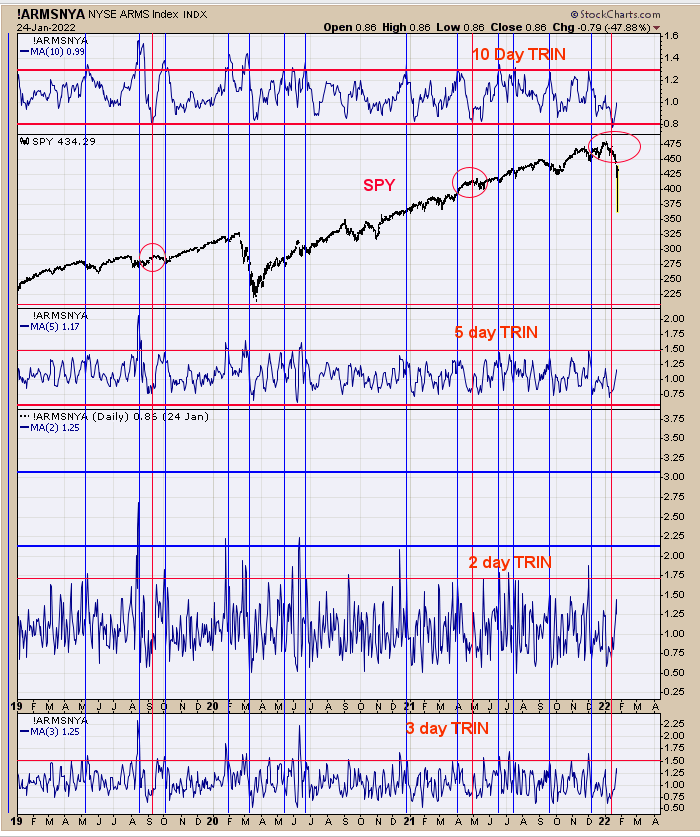
The top window is the 10-day trin. Intermediate-term lows form when the 10-day trin is 1.30 and higher and the current reading stands at .99. The blue vertical lines show times when 10-day Trin is at 1.30 and higher. Usually, high TRIN closes (panic) come on big declines in the market and to push the 10-day trin to 1.30 will need more big down days in the market or at least tests of Monday’s low. FOMC meeting is tomorrow and could produce more volatility in the market short term and push a high TRIN close, which would be a bullish sign. We covered on short SPX on Yesterday’s open for a gain of 7.57% and remain flat for now.
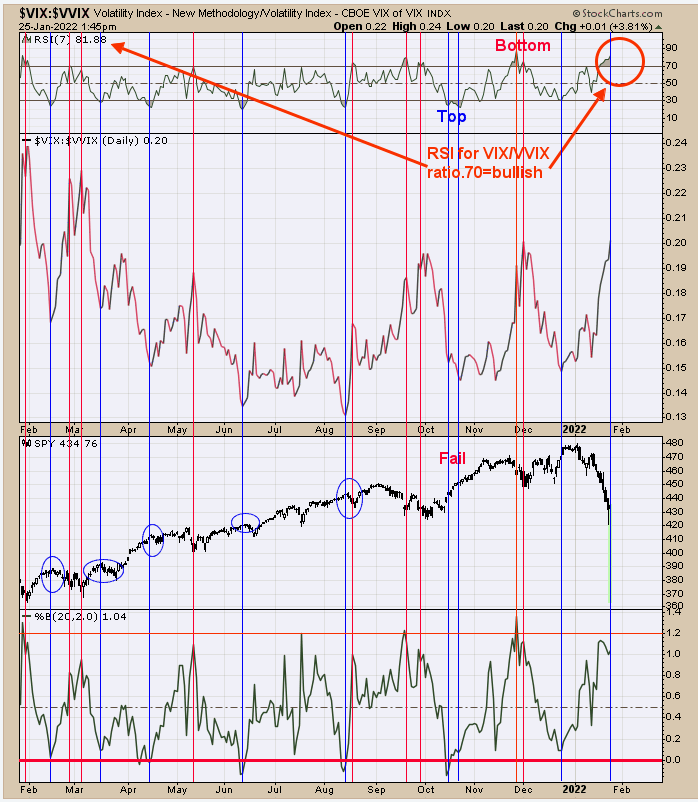
The middle window is the VIX/VVIX ratio and the top window is the RSI (7) of this ratio. Intermediate-term lows have formed when the RSI of this ratio reached above 70 (current reading is 81.88) which is identified with red vertical lines. In most cases where bottoms were forming on the SPX there were re-test of the low and most likely that will happen here. There appears a bottom is in the process of forming and Yesterday’s low may be tested at least once if not more. The 10-day TRIN sets at .99 (page 1) in an area where more panic high TRIN closes is needed to get the 10 day TRIN up >1.30 to suggest a longer-term low is forming. This condition would suggest a test of yesterday’s low is needed to get the TRIN up to panic levels. There is an old adage that says “where January goes so goes the year”. Covered short SPX on 1/24/22 open at 4356.32 for gain of 7.57%; Short SPX on 1/11/22 at 4713.07.
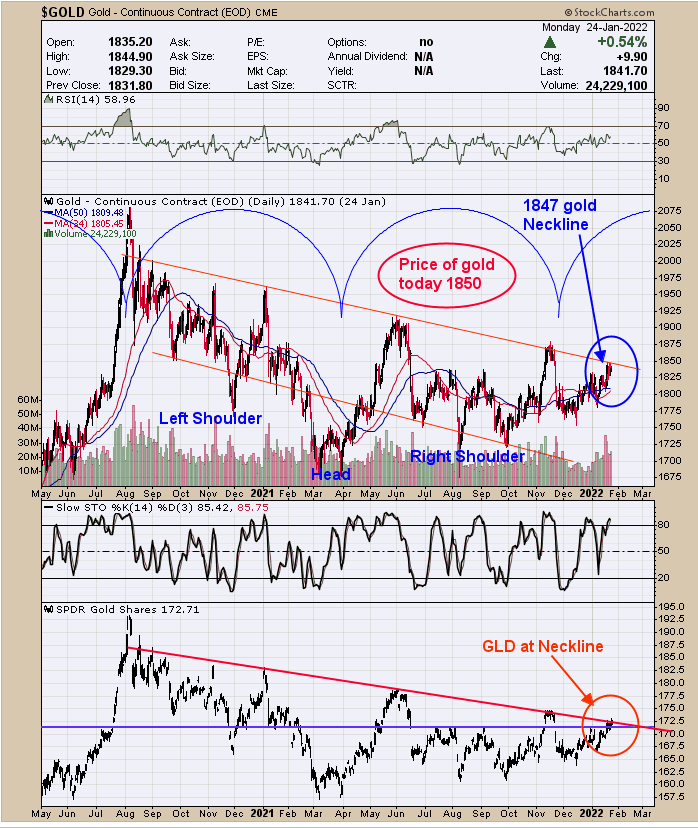
The Neckline for the Head and Shoulders' bottom for Gold where the Head is the March April 2021 bottom appears to be breaking out. I’m writing this page before the market is closed and the current spot gold is at 1850 which is above the Neckline at 1847. The bottom window is GLD which is the ETF for gold and it too also appears to be closing above its Neckline. The blue arch on the Gold chart is a cycle arch and it lines up well for a cycle low in December. There could be backing and filling short term but the price is holding at or above the breakout and a bullish sign. This is where a “Sign of Strength” should show up to confirm the breakout. Russia's invasion of Ukraine may be near to trigger the rally in gold (which may be the story for the gold rally).



Comments
Log in or sign up to join the conversation.