

The PPI was flat in July, mostly due to big decline in gasoline and food. This won’t last.
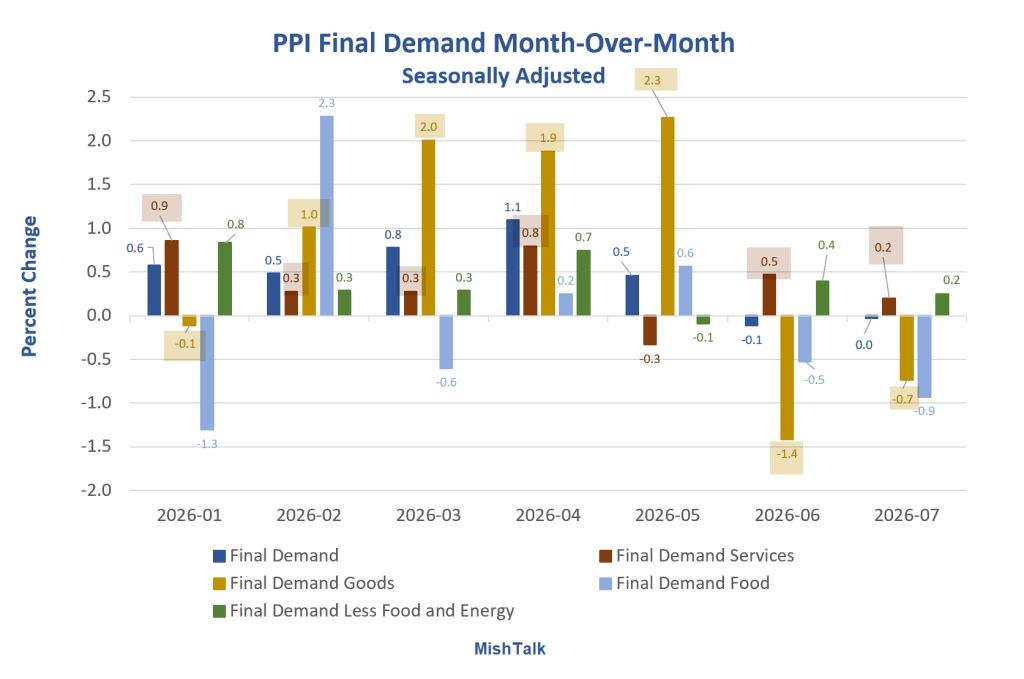
PPI Final Demand Month-Over-Month Percent Change
PPI June 2026
Please consider the BLS Producer Price Report for June 2026.
The Producer Price Index for final demand was unchanged in July.
On an unadjusted basis, the index for final demand increased 4.7 percent for the 12 months ended in July.
In July, a 0.2-percent increase in the index for final demand services and a 2.2-percent advance in prices for final demand construction offset a 0.7-percent decrease in the index for final demand goods.
Prices for final demand less foods, energy, and trade services rose 0.4 percent in July after inching up 0.1 percent in June.
For the 12 months ended in July, the index for final demand less foods, energy, and trade services advanced 4.7 percent.
PPI Final Demand Month-Over-Month Details
Final Demand: 0.0 percent
Final Demand Goods: -0.7 percent
Final Demand Services: 0.2 percent
Final Demand Food: -0.9 percent
Final Demand Less Food and Energy: 0.2 percent
Final Demand Synopsis
Final Demand Goods: The index for final demand goods fell 0.7 percent in July after moving down 1.4 percent in June. A major factor in the July decrease was a 3.1-percent decline in prices for final demand energy. The index for final demand foods moved down 0.9 percent. Conversely, prices for final demand goods less foods and energy increased 0.1 percent.
Goods Detail: More than half of the July decrease in the index for final demand goods can be attributed to a 5.7-percent decline in prices for gasoline. The indexes for fresh and dry vegetables, diesel fuel, jet fuel, residual fuels, and thermoplastic resins and materials also fell. In contrast, prices for motor vehicles and equipment moved up 0.3 percent. The indexes for electric power and for grains also increased.
Final Demand Services: Prices for final demand services advanced 0.2 percent in July after rising 0.5 percent in June. The July increase can be traced to the index for final demand services less trade, transportation, and warehousing, which moved up 0.6 percent. Conversely, the indexes for final demand transportation and warehousing services and for final demand trade services decreased 1.8 percent and 0.1 percent, respectively.
Product Detail: Leading the July increase in prices for final demand services, the index for portfolio management advanced 6.5 percent. Margins for health, beauty, and optical goods retailing; automobiles and automobile parts retailing; lawn, garden, and farm equipment and supplies retailing; food and alcohol retailing; and food and alcohol wholesaling also moved higher. In contrast, prices for truck transportation of freight fell 1.8 percent. The indexes for machinery and vehicle wholesaling and for securities brokerage, dealing, and investment advice also decreased.
Services were impacted by the decline in energy as noted by truck transportation costs.
Diesel fuel (a key input for trucking) fell 6.7%, gasoline dropped 5.7%, and broader energy prices were down 3.1%.
PPI Final Demand Year-Over-Year
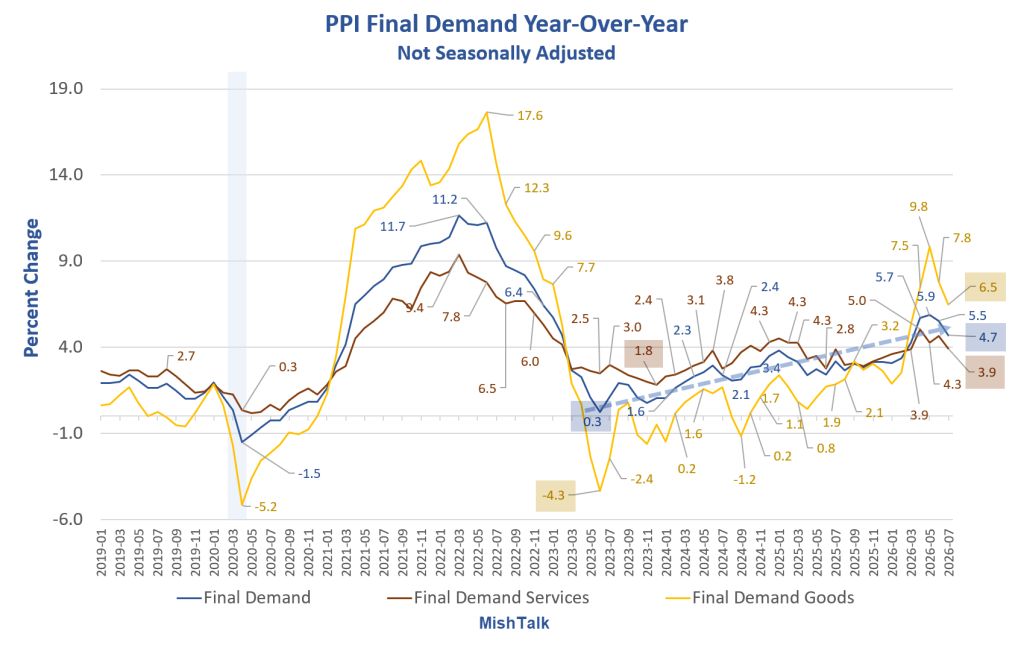
PPI Final Demand Year-Over-Year Percent Change
PPI Final Demand Year-Over-Year Notes
Final Demand: 4.7 percent
Final Demand Goods: 6.5 percent
Final Demand Services: 3.9 percent
PPI Final Demand Services
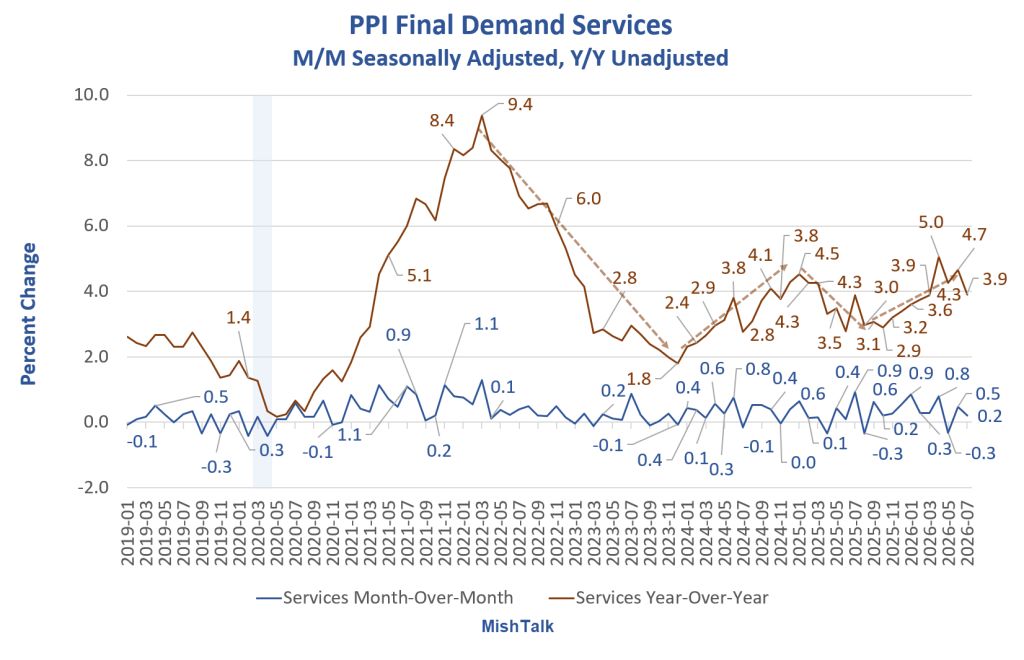
Services Key Points
Services represent a dominant portion of the Producer Price Index (PPI) for final demand, accounting for approximately 68% to over 70% of total PPI coverage as of early 2026.
Services are often the primary driver of PPI inflation, significantly outweighing goods.
The trend in services is not good. Year-over-year services PPI is up 3.9 percent.
PPI Synopsis
What’s happening now is neither temporary nor random.
Prices declined following the memorandum of understanding (MOU) with Iran, opening the Strait of Hormuz. The strait is now closed again.
Price pressures will persist as long as the strait is closed.
Bond Market Reaction
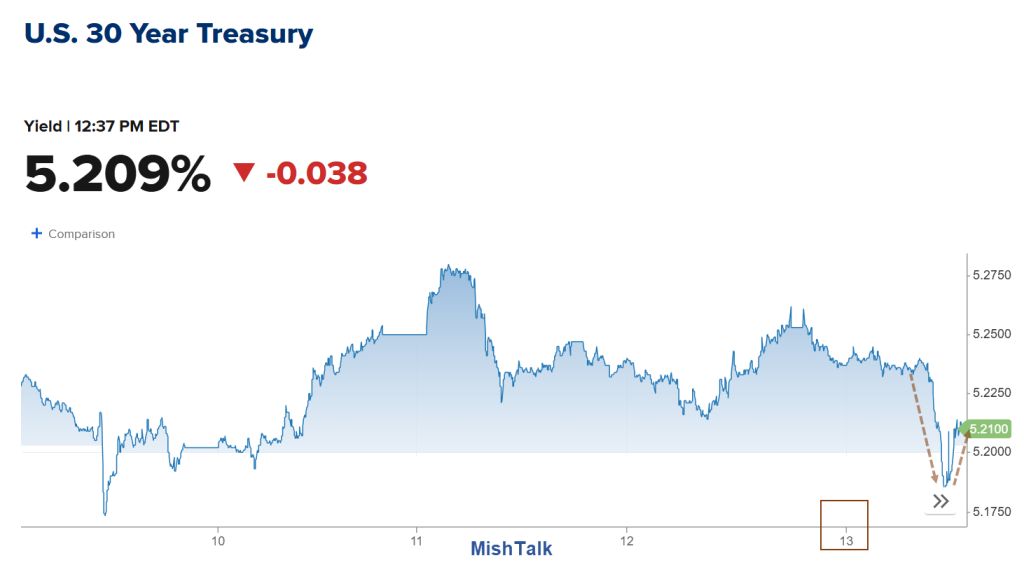
Want to know is a report is good or bad?
The best way to tell is look at the bond market reaction.
The bond market immediate reaction was good. But yields have now recovered about half of the decline. And the 30-year long bond yield is back above 5.20 percent.
The best thing in the report was the price of food.
Looking Ahead
In the last month the national average price of diesel rose from $4.8746 to $5.4043.
That is a rise of 10.9 percent. The PPI will depend more precisely on the BLS sampling dates and the price of diesel on those dates.
But the tail wind of the MOU is over. The headwind of the strait closure is back.
This explains the bond market’s second thoughts.
Related Posts
August 12, 2026: July CPI Report Not as Good as Numbers Look at First Glance
The consumer price index rose the expected 0.1 percent, but significant troubles lie ahead.
August 12, 2026: Look Ahead Inflation Numbers Do Not Support a Fed Pause in September
Today’s CPI report is history. Let’s look ahead.
We now have two decent reports from an inflation standpoint, but both of them are backward looking.


Comments
Log in or sign up to join the conversation.