

Since December 2022 sales have gone nowhere.
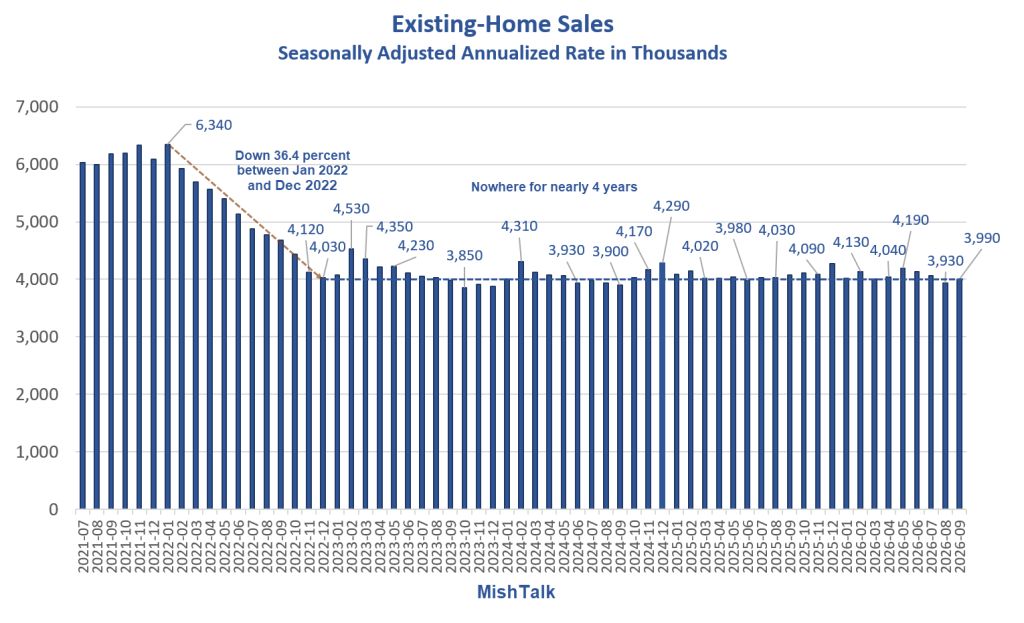
The National Association of Realtors reports Existing-Home Sales Increased 1.5% in September
Existing-home sales increased by 1.5% in September 2026. Month over month sales increased in the South and West, while holding steady in the Midwest and declining in the Northeast. Year over year sales declined in all four regions.
“Despite the small monthly gain on a seasonally adjusted basis, August and September marked the two slowest months for home sales this year,” said NAR Chief Economist Lawrence Yun. “Further increases in mortgage rates in recent weeks mean fewer buyers can qualify to purchase a home.”
Yun continued, “Higher inventory and lengthening days on market give buyers improved negotiating power. Home sellers need to be realistic about local market conditions, which could require price discounts and other incentives to attract buyers.”
Existing-Home Sales Month-Over-Month
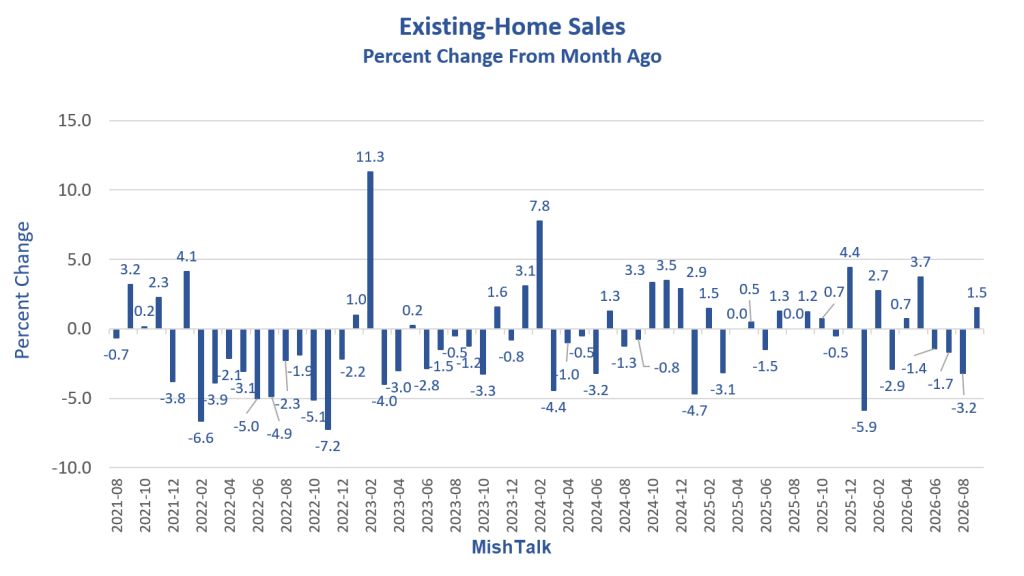
Changes have been essentially trendless for years.
Key September 2026 Statistics
Month-Over-Month: 1.5% increase in existing-home sales to a seasonally adjusted annual rate of 3.99 million in September
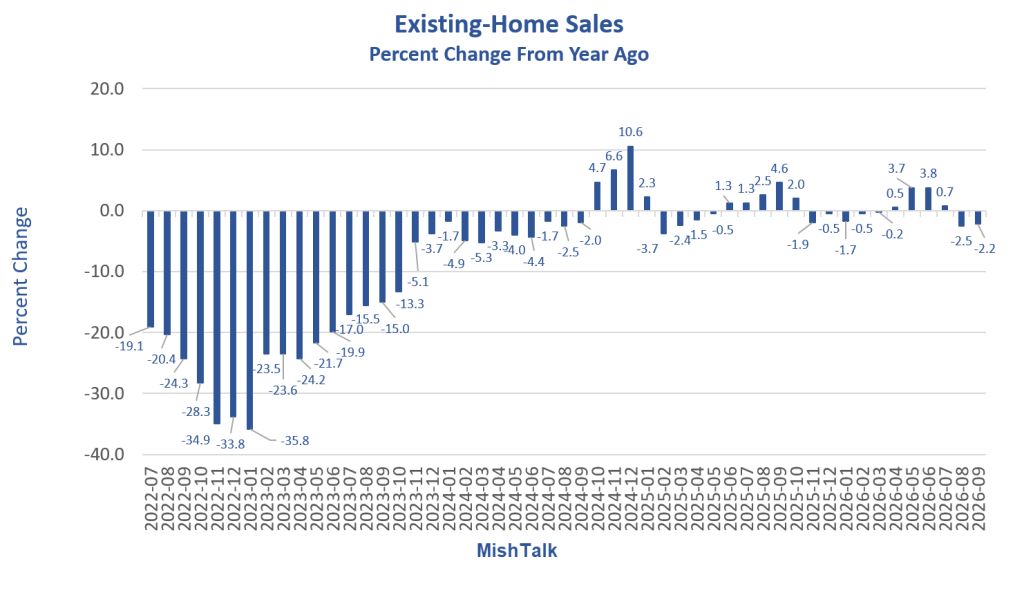
Sales Year-Over-Year: 2.2% decrease in existing-home sales.
Inventory Units: Total housing inventory reached 1.60 million units, up 1.9% from August and 4.6% from September 2025.
Inventory Supply: 4.8 months’ supply, unchanged from August and up from 4.5 months one year ago.
Median existing-home price: The median existing-home price for all housing types was $417,500.
Price Change From Year Ago: Prices increased 1.3% from one year ago ($412,300), marking the 39th consecutive month of year-over-year price gains.
Market Time: 31 days: Median time on market for properties, 33 days, up from 31 days in August and unchanged from September 2025.
Truly Nonsensical NAR Measures of Affordability
The Housing Affordability Index registered at 105.4, down from 106.7 one year ago.
Northeast: -4.5%
Midwest: -3.1%
South: -0.4%
West: +1.0%
For August, the Housing Affordability Index registered at 104.7, up from 101.2 a year ago.
If homes were more affordable, more homes would be selling.
Existing-Home Sales Year-Over-Year
Existing Home Sales Supply
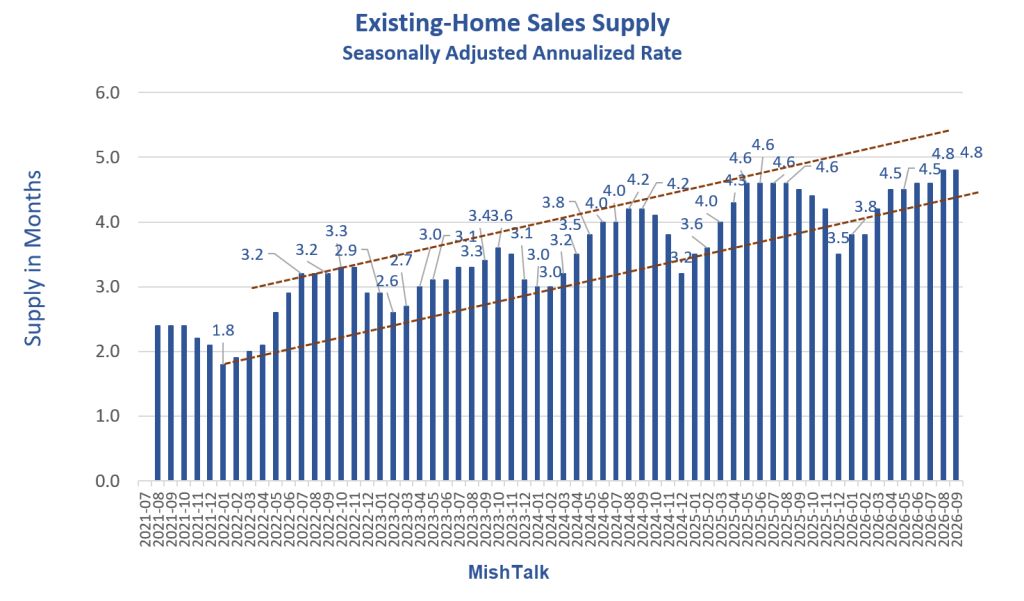
The NAR does not seasonally adjust much of its data as evidenced by the above chart.
Nonetheless, we can see rising supply over time. But rising supply has not helped sales. And growth in supply seems to have stalled.
Existing-Home Sales vs Mortgage Rates
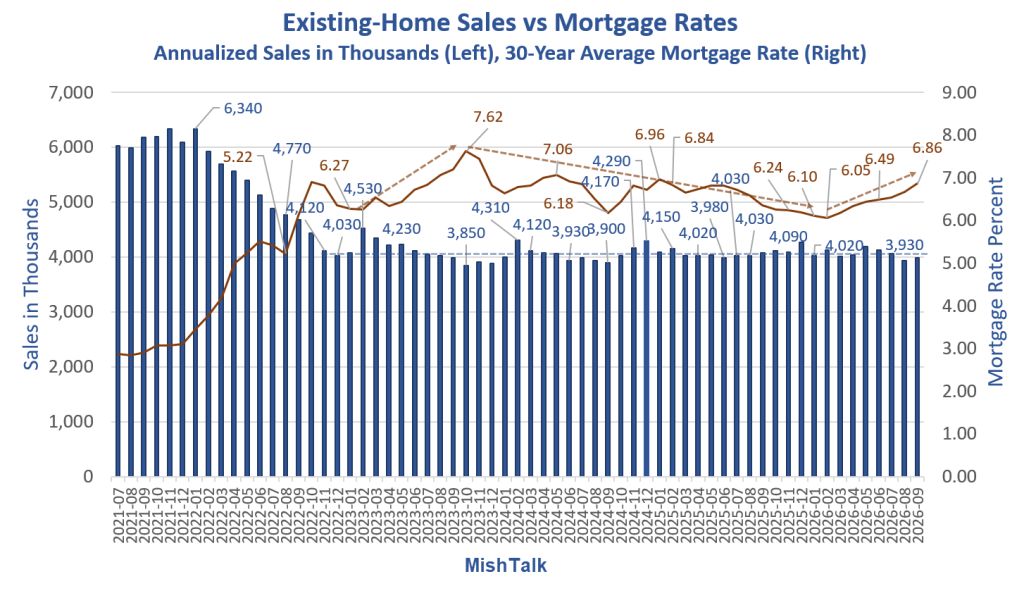
There are sometime jumps in sales when rates drop. However, there has not been any lasting traction.
Sales have basically gone nowhere even as rates fell from 7.62 percent to 6.05 percent.
But rates have risen again. The current Mortgage News Daily rate is 7.46 percent.
MND is more accurate than the Freddie Mac data in my chart because it includes points and fees. I use Freddie Mac data because I have a download from the St. Louis Fed.
Three Key Conclusions
Home prices are too high, mortgage rates are too high, or both, for most people.
There is a pool of price-insensitive buyers, around 4 million annualized, who are able and willing to buy regardless of point one.
If we see a sustained decline in the stock market, a recession, or other economic shock, point two will not hold.
Point 3 above is my big caution.
Synopsis
Real Income falling
Home prices rising
Mortgage rates rising
Until this month, Yun claims affordability is improving
Related Posts
October 7, 2026: Long-Term Bond Yields Surge to New 24-Year Highs
What happened to Bessent’s “I am the house” theory?
October 9, 2026: Consumer Sentiment Current Conditions Index Drop to Record Low
By political affiliation, sentiment declines the most for independents.



Comments
Log in or sign up to join the conversation.